Wausau, WI (Wisconsin) Houses and Residents
| Wausau: | $151,913 |
| Wisconsin: | $252,800 |
Mean price in 2022:
Detached houses: $214,928
Here: $214,928 State: $308,468 Townhouses or other attached units: $301,234
Here: $301,234 State: $265,873 In 2-unit structures: $162,589
Here: $162,589 State: $203,667 In 3-to-4-unit structures: $312,585
Here: $312,585 State: $216,833 In 5-or-more-unit structures: $176,682
Here: $176,682 State: $280,537 Mobile homes: $68,582
Here: $68,582 State: $79,042
Total population: 39,302 (Urban population: 38,090, Rural population: 314 (all nonfarm))
Houses: 19,001 (17,500 occupied: 10,206 owner occupied, 7,148 renter occupied)
| % of renters here: | 41% |
| State: | 32% |
Housing density: 1,152 houses/condos per square mile
Median price asked for vacant for-sale houses and condos in 2022: $102,181.
Median contract rent in 2022: $782 (lower quartile is $575, upper quartile is $933)
Median rent asked for vacant for-rent units in 2022: $1,166
Median gross rent in Wausau, WI in 2022: $895
Housing units in Wausau with a mortgage: 5,793 (546 second mortgage, 9 home equity loan, 384 both second mortgage and home equity loan)
Houses without a mortgage: 164
Median household income for houses/condos with a mortgage: $82,224
Median household income for apartments without a mortgage: $62,098
Median monthly housing costs: $891
Compare current foreclosures in Wausau, WI:
| Photo | Address | Area | Beds / Baths | Price | Details |
|---|---|---|---|---|---|

|
#1
Chicago Ave
Wausau, WI 54403
|
- sq. feet
|
- baths - beds |
show details | |

|
#2
Fulton St, Apt 107
Wausau, WI 54403
|
- sq. feet
|
- baths - beds |
show details | |

|
#3
S 12th Ave
Wausau, WI 54401
|
- sq. feet
|
- baths - beds |
show details | |

|
#4
Townline Rd
Wausau, WI 54403
|
- sq. feet
|
- baths - beds |
show details | |

|
#5
S 14th Ave
Wausau, WI 54401
|
- sq. feet
|
- baths - beds |
show details | |

|
#6
N 72nd Ave
Wausau, WI 54401
|
- sq. feet
|
- baths - beds |
show details | |

|
#7
Mortenson Dr
Wausau, WI 54401
|
- sq. feet
|
- baths - beds |
show details | |

|
#8
N 28th Ave
Wausau, WI 54401
|
- sq. feet
|
- baths - beds |
show details | |

|
#9
Flax Ln
Wausau, WI 54401
|
- sq. feet
|
- baths - beds |
show details | |

|
#10
N 1st St # 4
Wausau, WI 54403
|
- sq. feet
|
- baths - beds |
show details |
| Photo | Address | Area | Beds / Baths | Price | Details |
|---|---|---|---|---|---|

|
#11
N 6th St
Wausau, WI 54403
|
- sq. feet
|
- baths - beds |
show details | |

|
#12
S 50th Ave Apt 12
Wausau, WI 54401
|
- sq. feet
|
- baths - beds |
show details | |

|
#13
Stewart Ave Ste 140
Wausau, WI 54401
|
- sq. feet
|
- baths - beds |
show details | |

|
#14
N 28th Ave Apt 3
Wausau, WI 54401
|
- sq. feet
|
- baths - beds |
show details | |

|
#15
S 56th Ave Apt 7
Wausau, WI 54401
|
- sq. feet
|
- baths - beds |
show details | |

|
#16
County Rd W
Wausau, WI 54403
|
- sq. feet
|
- baths - beds |
show details | |

|
#17
Prospect Ave
Wausau, WI 54403
|
- sq. feet
|
- baths - beds |
show details | |

|
#18
Manson St Apt 5
Wausau, WI 54403
|
- sq. feet
|
- baths - beds |
show details | |

|
#19
Crossbill Ave
Wausau, WI 54401
|
- sq. feet
|
- baths - beds |
show details | |

|
#20
Bopf St
Wausau, WI 54401
|
- sq. feet
|
- baths - beds |
show details |
| Photo | Address | Area | Beds / Baths | Price | Details |
|---|---|---|---|---|---|

|
#21
Lakeshore Dr
Wausau, WI 54401
|
- sq. feet
|
- baths - beds |
show details | |

|
#22
N 9th Ave Apt 10h
Wausau, WI 54401
|
- sq. feet
|
- baths - beds |
show details | |

|
#23
E Randolph St
Wausau, WI 54401
|
- sq. feet
|
- baths - beds |
show details | |

|
#24
Bertha St
Wausau, WI 54403
|
- sq. feet
|
- baths - beds |
show details | |

|
#25
S Mountain Rd
Wausau, WI 54401
|
- sq. feet
|
- baths - beds |
show details | |

|
#26
Mcindoe St
Wausau, WI 54403
|
- sq. feet
|
- baths - beds |
show details | |

|
#27
N 16th St
Wausau, WI 54403
|
- sq. feet
|
- baths - beds |
show details | |

|
#28
N 6th St
Wausau, WI 54403
|
- sq. feet
|
- baths - beds |
show details | |

|
#29
S 22nd Pl
Wausau, WI 54401
|
- sq. feet
|
- baths - beds |
show details | |

|
#30
S 14th Ave
Wausau, WI 54401
|
- sq. feet
|
- baths - beds |
show details |
| Photo | Address | Area | Beds / Baths | Price | Details |
|---|---|---|---|---|---|

|
#31
S 5th Ave
Wausau, WI 54401
|
- sq. feet
|
- baths - beds |
show details | |

|
#32
S 5th Ave
Wausau, WI 54401
|
- sq. feet
|
- baths - beds |
show details | |

|
#33
Mcintosh St
Wausau, WI 54403
|
- sq. feet
|
- baths - beds |
show details | |

|
#34
Stewart Ave
Wausau, WI 54401
|
- sq. feet
|
- baths - beds |
show details | |

|
#35
Seymour Ln
Wausau, WI 54401
|
- sq. feet
|
- baths - beds |
show details | |

|
#36
Le Messurier St
Wausau, WI 54403
|
- sq. feet
|
- baths - beds |
show details | |

|
#37
N 2nd Ave
Wausau, WI 54401
|
- sq. feet
|
- baths - beds |
show details | |

|
#38
W Wausau Ave
Wausau, WI 54401
|
- sq. feet
|
- baths - beds |
show details | |

|
#39
Joyce St
Wausau, WI 54401
|
- sq. feet
|
- baths - beds |
show details | |

|
#40
Lombardy Dr
Wausau, WI 54401
|
- sq. feet
|
- baths - beds |
show details |
| Photo | Address | Area | Beds / Baths | Price | Details |
|---|---|---|---|---|---|

|
#41
Silver Spring St Apt 5
Wausau, WI 54401
|
- sq. feet
|
- baths - beds |
show details | |

|
#42
1/2 Gowen St
Wausau, WI 54403
|
- sq. feet
|
- baths - beds |
show details | |

|
#43
N 10th St
Wausau, WI 54403
|
- sq. feet
|
- baths - beds |
show details | |

|
#44
N 10th Ave
Wausau, WI 54401
|
- sq. feet
|
- baths - beds |
show details | |

|
#45
Prospect Ave
Wausau, WI 54403
|
- sq. feet
|
- baths - beds |
show details | |

|
#46
Sherman St
Wausau, WI 54401
|
- sq. feet
|
- baths - beds |
show details | |

|
#47
N 3rd Ave
Wausau, WI 54401
|
- sq. feet
|
- baths - beds |
show details | |

|
#48
Spruce St
Wausau, WI 54401
|
- sq. feet
|
- baths - beds |
show details | |

|
#49
S 11th Ave
Wausau, WI 54401
|
- sq. feet
|
- baths - beds |
show details | |

|
Check over 1 million property listings on Foreclosure.com!
|
browse all offers | |||

Latest news about housing in Wausau, WI collected exclusively by city-data.com from local newspapers, TV, and radio stations

 | Moving back to Wisconsin-Wausau area (16 replies) |
| Single Parent Looking to Move to Wisconsin (23 replies) |
| Wausau or Oshkosh? (10 replies) |
| Moving to Wausau (4 replies) |
| Retire in Wausau? (7 replies) |
| Recommendations: Less Urban + Nature Access (12 replies) |

Median year apartment built: 1966
Household type by relationship:
Households: 39,945- Male householders: 8,564 (2,940 living alone), Female householders: 8,752 (3,247 living alone)
6,758 spouses (6,668 opposite-sex spouses), 1,813 unmarried partners, (1,747 opposite-sex unmarried partners), 10,170 children (9,550 natural, 141 adopted, 478 stepchildren), 477 grandchildren, 270 brothers or sisters, 249 parents, 0 foster children, 428 other relatives, 1,386 non-relatives
- In group quarters: 1,074
Size of family households: 4,794 2-persons, 1,677 3-persons, 1,267 4-persons, 383 5-persons, 626 6-persons, 244 7-or-more-persons.
Size of nonfamily households: 6,653 1-person, 1,746 2-persons, 259 3-persons, 53 5-persons, 14 6-persons.
5,374 married couples with children.
2,554 single-parent households (892 men, 1,662 women).
87.8% of residents of Wausau speak English at home.
2.9% of residents speak Spanish at home (36% speak English very well, 14% speak English well, 17% speak English not well, 32% don't speak English at all).
1.7% of residents speak other Indo-European language at home (91% speak English very well, 3% speak English well, 5% speak English not well).
7.7% of residents speak Asian or Pacific Island language at home (62% speak English very well, 23% speak English well, 13% speak English not well, 3% don't speak English at all).
0.2% of residents speak other language at home (84% speak English very well, 16% speak English well).
Foreign born population: 3,634 (9.1%)
(49.8% of them are naturalized citizens)
| Here: | 6.6 |
| State: | 6.5 |
| Here: | 4.3 |
| State: | 4.1 |

- Bedrooms in owner-occupied houses and condos in Wausau, Wisconsin
- 0no bedroom
- 1291 bedroom
- 2,0272 bedrooms
- 4,9833 bedrooms
- 2,4094 bedrooms
- 6595+ bedrooms

- Bedrooms in renter-occupied apartments in Wausau, Wisconsin
- 262no bedroom
- 1,6561 bedroom
- 3,6142 bedrooms
- 1,2743 bedrooms
- 2914 bedrooms
- 525+ bedrooms

- Cars and other vehicles available in Wausau in owner-occupied houses/condos
- 361no vehicle
- 3,2161 vehicle
- 4,7092 vehicles
- 1,4343 vehicles
- 3364 vehicles
- 1505+ vehicles

- Cars and other vehicles available in Wausau in renter-occupied apartments
- 1,199no vehicle
- 3,5271 vehicle
- 1,8172 vehicles
- 5013 vehicles
- 534 vehicles
- 525+ vehicles

- Rooms in owner-occupied houses in Wausau, Wisconsin
- 01 room
- 72 rooms
- 1193 rooms
- 9594 rooms
- 1,6785 rooms
- 2,1356 rooms
- 1,7677 rooms
- 1,6498 rooms
- 1,8929+ rooms

- Rooms in renter-occupied apartments in Wausau, Wisconsin
- 2621 room
- 4562 rooms
- 1,5283 rooms
- 2,1014 rooms
- 1,2445 rooms
- 7466 rooms
- 3337 rooms
- 2508 rooms
- 2299+ rooms


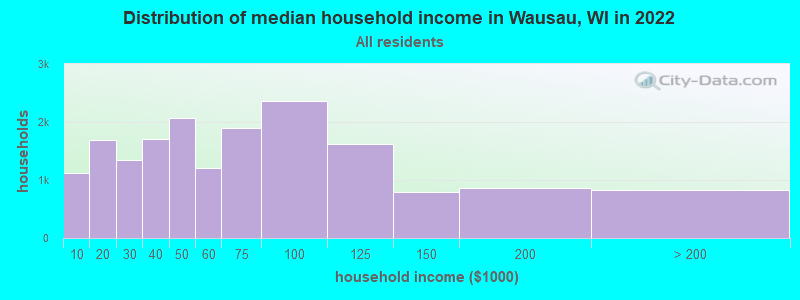
Wausau, WI household income distribution

- 1,126Less than $10,000
- 1,698$10,000 to $19,999
- 1,353$20,000 to $29,999
- 1,715$30,000 to $39,999
- 2,074$40,000 to $49,999
- 1,203$50,000 to $59,999
- 1,899$60,000 to $74,999
- 2,365$75,000 to $99,999
- 1,616$100,000 to $124,999
- 791$125,000 to $149,999
- 869$150,000 to $199,999
- 823$200,000 or more
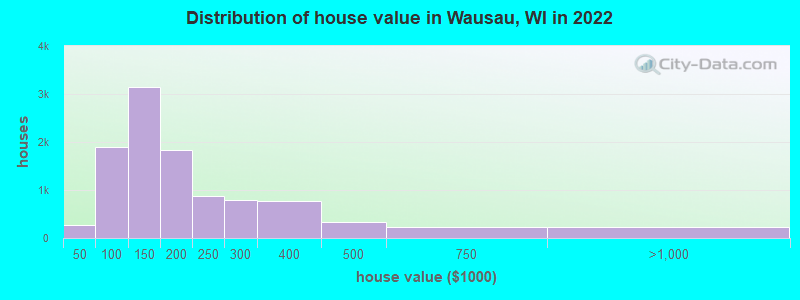
Home value of owner - occupied houses in 2022 in Wausau, WI
-
- 110Less than $10,000
- 56$10,000 to $14,999
- 55$15,000 to $19,999
- 18$20,000 to $24,999
- 27$25,000 to $29,999
- 1$30,000 to $34,999
- 1$40,000 to $49,999
- 105$50,000 to $59,999
- 278$60,000 to $69,999
- 364$70,000 to $79,999
- 538$80,000 to $89,999
- 614$90,000 to $99,999
- 1,532$100,000 to $124,999
- 1,613$125,000 to $149,999
- 1,241$150,000 to $174,999
- 592$175,000 to $199,999
- 873$200,000 to $249,999
- 789$250,000 to $299,999
- 780$300,000 to $399,999
- 334$400,000 to $499,999
- 223$500,000 to $749,999
- 214$750,000 to $999,999
- 5$1,000,000 to $1,499,999
- 8$2,000,000 or more
Rent paid by renters in 2022 in Wausau, WI
-
- 74Less than $100
- 8$100 to $149
- 10$150 to $199
- 187$200 to $249
- 37$250 to $299
- 57$300 to $349
- 200$350 to $399
- 242$400 to $449
- 343$450 to $499
- 231$500 to $549
- 601$550 to $599
- 350$600 to $649
- 344$650 to $699
- 212$700 to $749
- 705$750 to $799
- 1,133$800 to $899
- 532$900 to $999
- 864$1,000 to $1,249
- 135$1,250 to $1,499
- 116$1,500 to $1,999
- 75$2,000 to $2,499
- 14$3,500 or more
- 156No cash rent


Percentage of workers working in this county: 92.3%
Number of people working at home: 1,961 (10.3% of all workers)
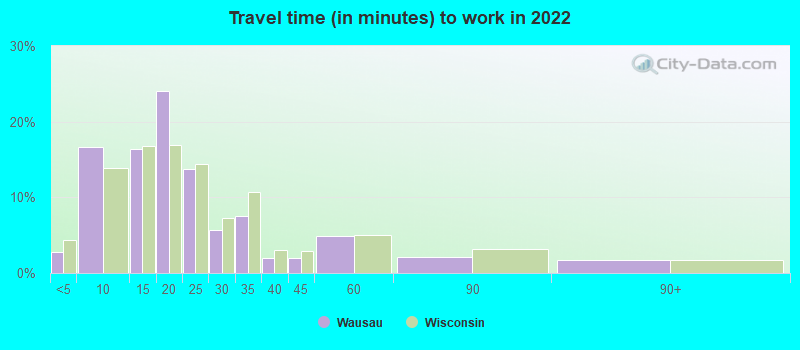
Travel time to work (commute)
- Less than 5 minutes: 737
- 5 to 9 minutes: 4,403
- 10 to 14 minutes: 3,538
- 15 to 19 minutes: 4,383
- 20 to 24 minutes: 2,201
- 25 to 29 minutes: 565
- 30 to 34 minutes: 659
- 35 to 39 minutes: 143
- 40 to 44 minutes: 258
- 45 to 59 minutes: 228
- 60 to 89 minutes: 115
- 90 or more minutes: 75
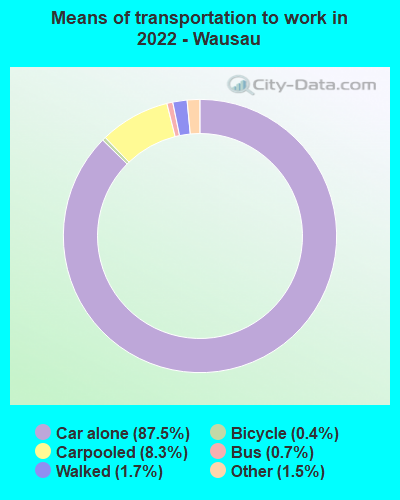
Means of transportation to work:
- Drove a car alone: 23,399 (81.1%)
- Carpooled: 2,065 (7.2%)
- Bus: 253 (0.9%)
- Taxi: 481 (1.7%)
- Bicycle: 73 (0.3%)
- Walked: 571 (2.0%)
- Worked at home: 1,961 (6.8%)

- Unemployment by race in 2022
- Unemployment rate for White non-Hispanic residents
- 5.3%Males
- 2.8%Females
- Unemployment rate for Black residents
- 8.5%Males
- Unemployment rate for Asian residents
- 4.0%Males
- 5.2%Females
- Unemployment rate for other race residents
- 31.0%Males
- Unemployment rate for two or more race residents
- 5.2%Males
- 0.9%Females
- Unemployment rate for Hispanic or Latino residents
- 17.4%Males
- 0.3%Females

- Year of entry for the foreign-born population in Wausau, Wisconsin
- 8282010 or later
- 7422000 to 2009
- 4971990 to 1999
- 1,1901980 to 1989
- 3161970 to 1979
- 262Before 1970

First ancestries reported:
- German: 7,439 (39.6%)
- Polish: 1,395 (7.4%)
- English: 758 (4.0%)
- Irish: 611 (3.3%)
- American: 499 (2.7%)
- Italian: 340 (1.8%)
- Norwegian: 334 (1.8%)
- European: 317 (1.7%)
- Swedish: 173 (0.9%)
- Dutch: 133 (0.7%)
- French: 115 (0.6%)
- Czech: 88 (0.5%)
- Finnish: 80 (0.4%)
- Scandinavian: 62 (0.3%)
- African: 62 (0.3%)
- Danish: 60 (0.3%)
- Russian: 56 (0.3%)
- French Canadian: 53 (0.3%)
- Hungarian: 48 (0.3%)
- Scottish: 41 (0.2%)
- Canadian: 35 (0.2%)
- Greek: 34 (0.2%)
- Portuguese: 28 (0.1%)
- Scotch-Irish: 26 (0.1%)
- Swiss: 22 (0.1%)
- Eastern European: 20 (0.1%)
- Brazilian: 19 (0.1%)
- British: 19 (0.1%)
- Celtic: 19 (0.1%)
- Latvian: 18 (0.10%)
- Lithuanian: 18 (0.10%)
- Northern European: 15 (0.08%)
- Palestinian: 13 (0.07%)
- Slovak: 13 (0.07%)
- Welsh: 11 (0.06%)
- Slovene: 1 (0.01%)
Most common places of birth for foreign-born residents (%):
| Wausau: | 21.9% (652) |
| Wisconsin: | 4.3% (12,681) |
| Wausau: | 21.0% (625) |
| Wisconsin: | 1.1% (3,231) |
| Wausau: | 16.3% (486) |
| Wisconsin: | 3.3% (9,655) |
| Wausau: | 12.3% (365) |
| Wisconsin: | 29.5% (87,182) |
| Wausau: | 9.1% (272) |
| Wisconsin: | 8.0% (23,594) |
| Wausau: | 4.1% (123) |
| Wisconsin: | 5.1% (15,165) |
| Wausau: | 2.7% (79) |
| Wisconsin: | 1.5% (4,400) |
| Wausau: | 2.5% (74) |
| Wisconsin: | 2.3% (6,747) |
| Wausau: | 2.3% (68) |
| Wisconsin: | 0.1% (357) |
| Wausau: | 2.1% (62) |
| Wisconsin: | 3.0% (8,773) |
| Wausau: | 1.8% (54) |
| Wisconsin: | 0.7% (2,079) |
Place of birth for U.S.-born residents:
- This state: 27,898
- Other state: 8,532
- Northeast: 469
- Midwest: 4,903
- South: 1,479
- West: 1,801
83.1% of Wausau residents lived in the same house 1 years ago.
Out of people who lived in different houses, 30.4% lived in this county.
Out of people who lived in different counties, 68.3% lived in Wisconsin.
| Wausau: | 83.1% |
| State average: | 87.7% |
Education attainment for males 25 years and older:
- No schooling: 188
- Nursery to 4th grade: 0
- 5th and 6th grade: 343
- 7th and 8th grade: 38
- 9th grade: 85
- 10th grade: 126
- 11th grade: 222
- 12th grade, no diploma: 544
- High school graduate (or equivalency): 3,672
- Less than 1 year of college: 919
- Some college more than 1 year, no degree: 1,626
- Associate degree: 1,483
- Bachelor's degree: 2,965
- Master's degree: 917
- Professional school degree: 600
- Doctorate degree: 163

Education attainment for females 25 years and older:
- No schooling: 330
- Nursery to 4th grade: 80
- 5th and 6th grade: 133
- 7th and 8th grade: 118
- 9th grade: 80
- 10th grade: 50
- 11th grade: 43
- 12th grade, no diploma: 277
- High school graduate (or equivalency): 4,269
- Less than 1 year of college: 1,007
- Some college more than 1 year, no degree: 1,516
- Associate degree: 1,675
- Bachelor's degree: 3,100
- Master's degree: 1,326
- Professional school degree: 169
- Doctorate degree: 140


Housing units in structures:
- One, detached: 12,327
- One, attached: 533
- Two: 1,546
- 3 or 4: 435
- 5 to 9: 1,138
- 10 to 19: 992
- 20 to 49: 710
- 50 or more: 1,272
- Mobile homes: 32
- Boats, RVs, vans, etc.: 13
Median worth of mobile homes: $1,064,152
Housing units lacking complete kitchen facilities in 2022: 2.2%
House/condo owner moved in on average 11 years ago
Renter moved in on average 2 years ago

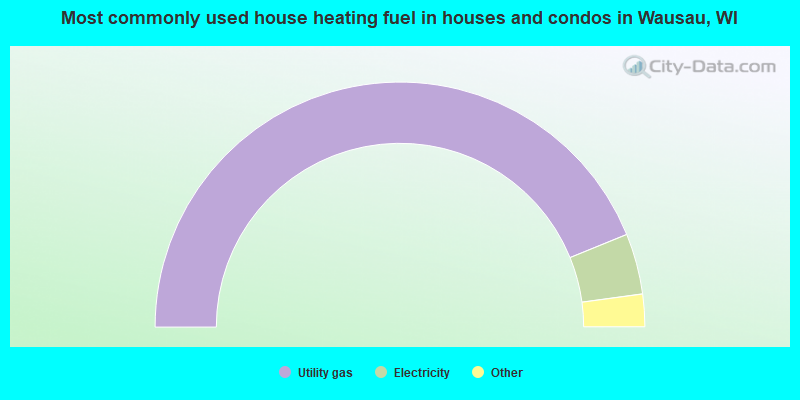
- 87.6%Utility gas
- 8.0%Electricity
- 2.3%Fuel oil, kerosene, etc.
- 0.7%Wood
- 0.6%Bottled, tank, or LP gas
- 0.5%Other fuel
- 0.1%No fuel used
- 0.1%Solar energy
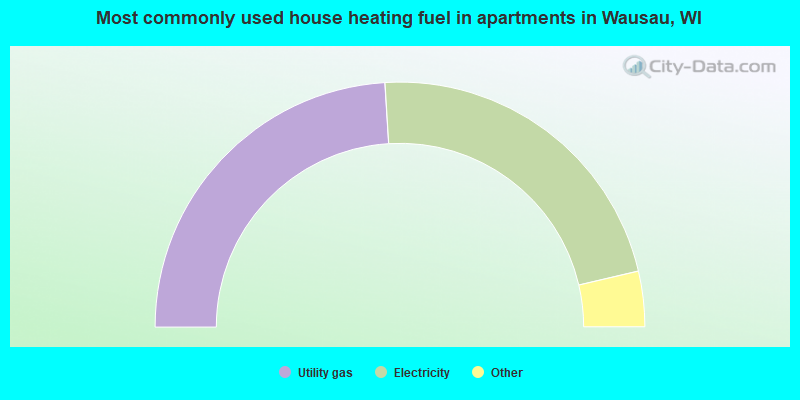
- 48.0%Utility gas
- 44.6%Electricity
- 3.7%Other fuel
- 1.3%No fuel used
- 1.2%Fuel oil, kerosene, etc.
- 0.7%Bottled, tank, or LP gas
- 0.2%Wood
- 0.2%Coal or coke
Private vs. public school enrollment:
| Here: | 9.1% |
| Wisconsin: | 16.7% |
| Here: | 10.3% |
| Wisconsin: | 12.5% |
| Here: | 7.8% |
| Wisconsin: | 17.5% |


