Waverly, MI (Michigan) Houses and Residents
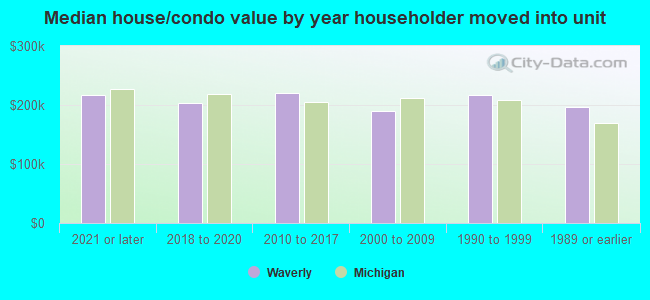
| Waverly: | $211,474 |
| Michigan: | $224,400 |
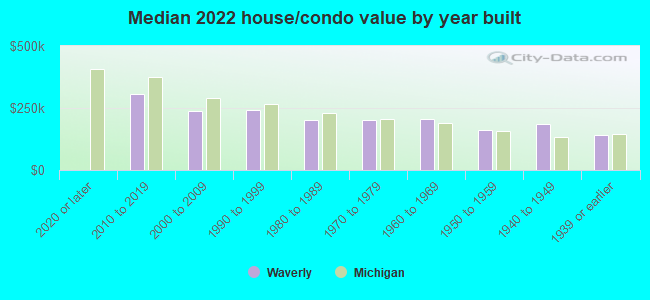
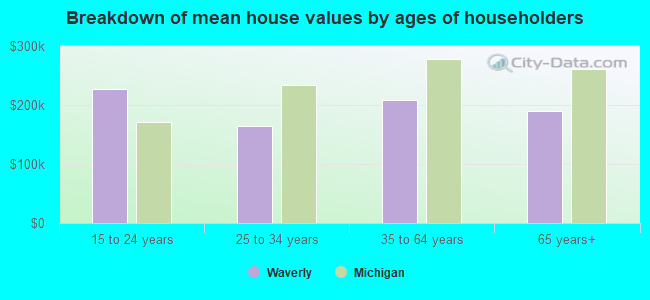
Mean price in 2022:
Detached houses: $245,536
Here: $245,536 State: $280,038 Townhouses or other attached units: $237,756
Here: $237,756 State: $239,520 In 2-unit structures: $287,674
Here: $287,674 State: $219,481 In 3-to-4-unit structures: $214,432
Here: $214,432 State: $207,067 In 5-or-more-unit structures: $85,942
Here: $85,942 State: $192,733 Mobile homes: $27,535
Here: $27,535 State: $72,868
Total population: 23,925 (Urban population: 16,153, Rural population: 0)
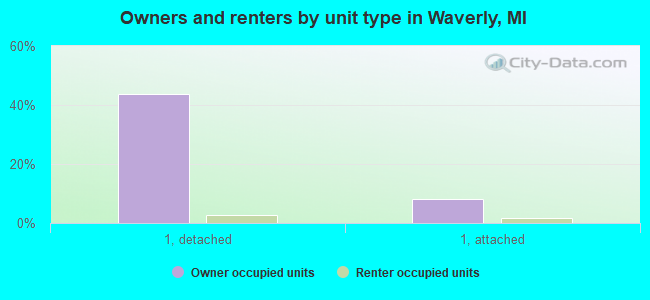
Houses: 12,037 (11,593 occupied: 6,241 owner occupied, 5,301 renter occupied)
| % of renters here: | 46% |
| State: | 27% |
Housing density: 2,115 houses/condos per square mile
Median price asked for vacant for-sale houses and condos in 2022: $252,287.
Median contract rent in 2022: $949 (lower quartile is $838, upper quartile is $1,153)
Median rent asked for vacant for-rent units in 2022: $1,594
Median gross rent in Waverly, MI in 2022: $1,100
Housing units in Waverly with a mortgage: 3,901 (262 second mortgage, 0 home equity loan, 208 both second mortgage and home equity loan)
Houses without a mortgage: 144
Median household income for houses/condos with a mortgage: $89,991
Median household income for apartments without a mortgage: $69,620
Median monthly housing costs: $1,031
Compare current foreclosures near Waverly, MI:
| Photo | Address | Area | Beds / Baths | Price | Details |
|---|---|---|---|---|---|

|
#1
Knollwood Ave
Lansing, MI 48906
|
964 sq. feet
|
1 baths 3 beds |
$138,500
|
show details |

|
#2
W Howe Rd
Eagle, MI 48822
|
1,709 sq. feet
|
2 baths 4 beds |
$299,900
|
show details |

|
#3
Dart Rd
Mason, MI 48854
|
1,118 sq. feet
|
2 baths 4 beds |
$296,500
|
show details |

|
#4
Tomlinson Rd
Mason, MI 48854
|
1,456 sq. feet
|
2 baths 3 beds |
$408,500
|
show details |

|
#5
W Sheridan Rd
Lansing, MI 48906
|
1,295 sq. feet
|
2 baths 2 beds |
$57,600
|
show details |

|
#6
Porter St
Lansing, MI 48906
|
1,292 sq. feet
|
1 baths - beds |
$27,900
|
show details |

|
#7
Wilson St
Dewitt, MI 48820
|
3,214 sq. feet
|
3 baths 4 beds |
show details | |

|
#8
Lincoln Ave
Lansing, MI 48910
|
686 sq. feet
|
1 baths 2 beds |
show details | |

|
#9
Nonette Dr
Lansing, MI 48911
|
979 sq. feet
|
1 baths 3 beds |
show details | |

|
#10
S Holmes St
Lansing, MI 48912
|
660 sq. feet
|
1 baths 2 beds |
show details |
| Photo | Address | Area | Beds / Baths | Price | Details |
|---|---|---|---|---|---|

|
#11
W Lawrence Ave
Charlotte, MI 48813
|
2,334 sq. feet
|
1 baths 4 beds |
show details | |

|
#12
Somerset Drive
Holt, MI 48842
|
2,368 sq. feet
|
3 baths 4 beds |
show details | |

|
#13
W Wieland Rd
Lansing, MI 48906
|
- sq. feet
|
1 baths 3 beds |
show details | |

|
#14
Hamilton Ave
Lansing, MI 48910
|
1,456 sq. feet
|
1 baths 2 beds |
show details | |

|
#15
Pine Tree Rd
Holt, MI 48842
|
963 sq. feet
|
1 baths 3 beds |
show details | |

|
#16
Newark Ave
Lansing, MI 48911
|
528 sq. feet
|
1 baths 2 beds |
show details | |

|
#17
N Genesee Dr
Lansing, MI 48915
|
1,320 sq. feet
|
1 baths 3 beds |
show details | |

|
#18
Wacousta Rd
Grand Ledge, MI 48837
|
1,716 sq. feet
|
1 baths 3 beds |
show details | |

|
#19
Tulane Dr
Lansing, MI 48912
|
1,359 sq. feet
|
2 baths 4 beds |
show details | |

|
#20
Aurelius Rd
Lansing, MI 48910
|
1,860 sq. feet
|
2 baths 3 beds |
show details |
| Photo | Address | Area | Beds / Baths | Price | Details |
|---|---|---|---|---|---|

|
#21
Moreno Dr
Lansing, MI 48911
|
2,185 sq. feet
|
2 baths 4 beds |
show details | |

|
#22
Hartel Rd
Grand Ledge, MI 48837
|
1,440 sq. feet
|
1 baths 3 beds |
show details | |

|
#23
Gould Rd
Lansing, MI 48917
|
997 sq. feet
|
1 baths 2 beds |
show details | |

|
#24
Rossman Hwy
Eaton Rapids, MI 48827
|
1,202 sq. feet
|
1 baths 3 beds |
show details | |

|
#25
Florence St
Lansing, MI 48910
|
880 sq. feet
|
1 baths 2 beds |
show details | |

|
#26
Barnard St
Lansing, MI 48912
|
1,340 sq. feet
|
2 baths 3 beds |
show details | |

|
#27
Green Rd
Haslett, MI 48840
|
972 sq. feet
|
1 baths 2 beds |
show details | |

|
#28
Churchill Ave
Lansing, MI 48911
|
864 sq. feet
|
1 baths 3 beds |
show details | |

|
#29
Leland Pl
Lansing, MI 48917
|
1,477 sq. feet
|
3 baths 3 beds |
show details | |

|
#30
S Grand Ave
Lansing, MI 48910
|
1,478 sq. feet
|
2 baths 3 beds |
show details |
| Photo | Address | Area | Beds / Baths | Price | Details |
|---|---|---|---|---|---|

|
#31
W Berry Ave
Lansing, MI 48910
|
1,449 sq. feet
|
3 baths 5 beds |
show details | |

|
#32
Hylewood Ave
Lansing, MI 48906
|
824 sq. feet
|
1 baths 2 beds |
show details | |

|
#33
Potter St
Haslett, MI 48840
|
896 sq. feet
|
1 baths 2 beds |
show details | |

|
#34
E Libbie Dr
Lansing, MI 48917
|
1,382 sq. feet
|
1 baths 3 beds |
show details | |

|
#35
S Hinman Rd
Eagle, MI 48822
|
2,496 sq. feet
|
1 baths 2 beds |
show details | |

|
#36
Fenton St
Lansing, MI 48910
|
815 sq. feet
|
1 baths - beds |
show details | |

|
#37
Biltmore Blvd
Lansing, MI 48906
|
1,165 sq. feet
|
1 baths 3 beds |
show details | |

|
#38
Coolidge St
Lansing, MI 48906
|
1,484 sq. feet
|
2 baths 3 beds |
show details | |

|
#39
W Jolly Rd
Lansing, MI 48911
|
1,676 sq. feet
|
1 baths 2 beds |
show details | |

|
#40
Aurora Dr
Lansing, MI 48910
|
1,316 sq. feet
|
1 baths 4 beds |
show details |
| Photo | Address | Area | Beds / Baths | Price | Details |
|---|---|---|---|---|---|

|
#41
Cartago Dr
Lansing, MI 48911
|
2,744 sq. feet
|
3 baths 4 beds |
show details | |

|
#42
Trumbull St
Lansing, MI 48911
|
1,674 sq. feet
|
1 baths 4 beds |
show details | |

|
#43
Ducharme Dr
Dewitt, MI 48820
|
1,640 sq. feet
|
2 baths 3 beds |
show details | |

|
#44
Sheffield Blvd
Lansing, MI 48911
|
2,071 sq. feet
|
1 baths 3 beds |
show details | |

|
#45
Academy Ln
Lansing, MI 48906
|
1,536 sq. feet
|
2 baths 2 beds |
show details | |

|
#46
Rockingham Dr
Lansing, MI 48911
|
1,664 sq. feet
|
2 baths 4 beds |
show details | |

|
#47
Moreno Dr
Lansing, MI 48911
|
2,185 sq. feet
|
1 baths 4 beds |
show details | |

|
#48
Stillwell Ave
Lansing, MI 48911
|
1,127 sq. feet
|
1 baths - beds |
show details | |

|
#49
N East St
Lansing, MI 48906
|
972 sq. feet
|
1 baths - beds |
show details | |

|
Check over 1 million property listings on Foreclosure.com!
|
browse all offers | |||

Latest news about housing in Waverly, MI collected exclusively by city-data.com from local newspapers, TV, and radio stations

 | Rivershell Apartments Lansing Safe? (7 replies) |
| Moving from Fl to Lansing. (8 replies) |
| Lansing Here We Come (3 replies) |
| Info on Lansing, MI - Neighborhoods & General city info (2 replies) |
| Visiting Lansing before potential move (3 replies) |
| 70K to 80K Salary... (11 replies) |

Median year apartment built: 1978
Household type by relationship:
Households: 23,705- Male householders: 5,451 (1,747 living alone), Female householders: 6,097 (2,558 living alone)
4,457 spouses (4,422 opposite-sex spouses), 969 unmarried partners, (911 opposite-sex unmarried partners), 5,077 children (4,392 natural, 386 adopted, 297 stepchildren), 144 grandchildren, 236 brothers or sisters, 170 parents, 0 foster children, 181 other relatives, 713 non-relatives
- In group quarters: 203
Size of family households: 3,447 2-persons, 1,907 3-persons, 736 4-persons, 183 5-persons, 105 6-persons, 33 7-or-more-persons.
Size of nonfamily households: 4,361 1-person, 685 2-persons, 85 3-persons.
1,901 married couples with children.
1,340 single-parent households (308 men, 1,032 women).
86.3% of residents of Waverly speak English at home.
3.6% of residents speak Spanish at home (92% speak English very well, 8% speak English well).
4.1% of residents speak other Indo-European language at home (75% speak English very well, 24% speak English well).
4.3% of residents speak Asian or Pacific Island language at home (67% speak English very well, 16% speak English well, 17% speak English not well).
1.9% of residents speak other language at home (69% speak English very well, 23% speak English well, 7% speak English not well).
Foreign born population: 1,971 (8.3%)
(69.9% of them are naturalized citizens)
| Here: | 6.9 |
| State: | 6.5 |
| Here: | 4.0 |
| State: | 4.3 |
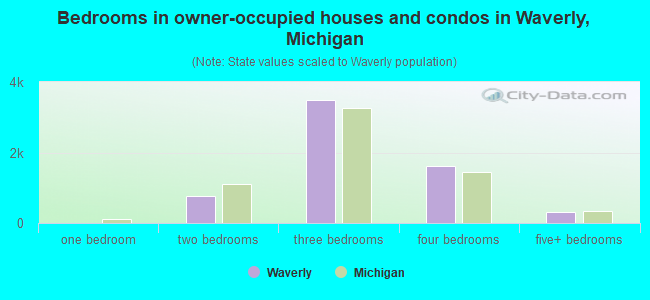
- Bedrooms in owner-occupied houses and condos in Waverly, Michigan
- 10no bedroom
- 101 bedroom
- 7782 bedrooms
- 3,4943 bedrooms
- 1,6284 bedrooms
- 3225+ bedrooms
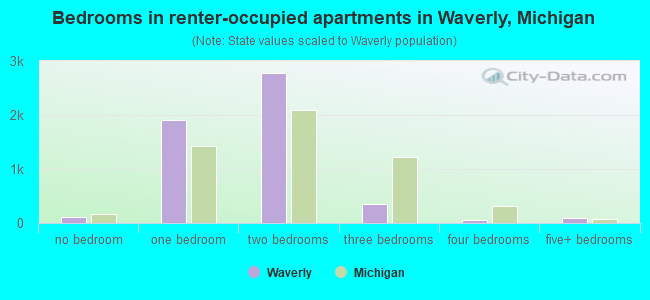
- Bedrooms in renter-occupied apartments in Waverly, Michigan
- 113no bedroom
- 1,9031 bedroom
- 2,7842 bedrooms
- 3513 bedrooms
- 524 bedrooms
- 995+ bedrooms
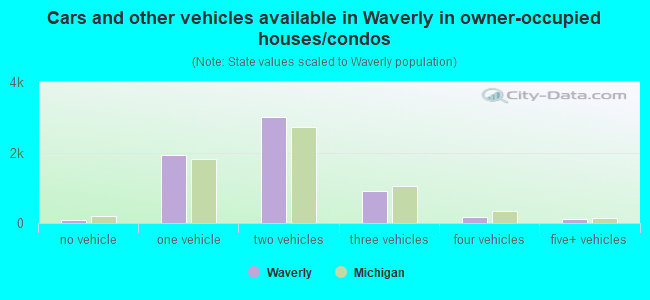
- Cars and other vehicles available in Waverly in owner-occupied houses/condos
- 93no vehicle
- 1,9391 vehicle
- 3,0182 vehicles
- 9103 vehicles
- 1654 vehicles
- 1175+ vehicles
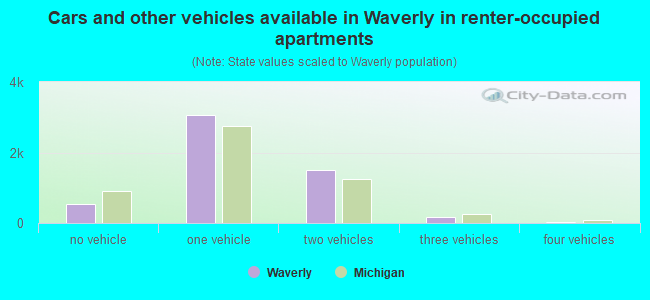
- Cars and other vehicles available in Waverly in renter-occupied apartments
- 547no vehicle
- 3,0601 vehicle
- 1,4922 vehicles
- 1623 vehicles
- 244 vehicles
- 165+ vehicles
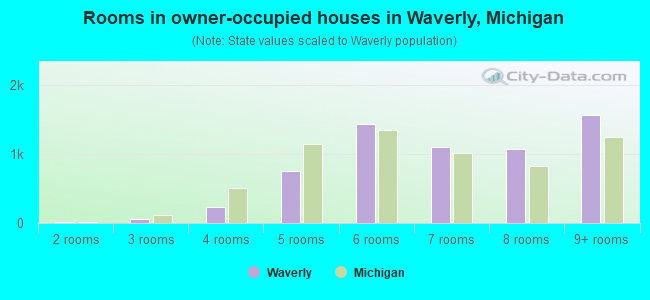
- Rooms in owner-occupied houses in Waverly, Michigan
- 101 room
- 102 rooms
- 573 rooms
- 2264 rooms
- 7545 rooms
- 1,4376 rooms
- 1,1007 rooms
- 1,0788 rooms
- 1,5719+ rooms
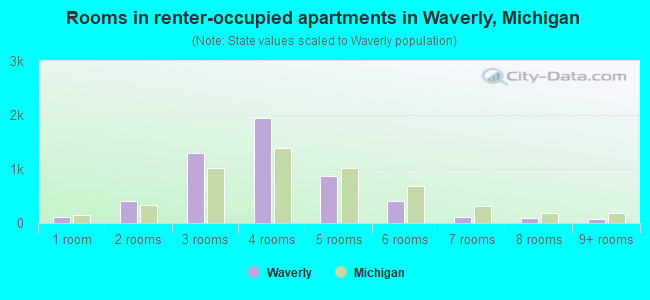
- Rooms in renter-occupied apartments in Waverly, Michigan
- 1051 room
- 4002 rooms
- 1,2973 rooms
- 1,9364 rooms
- 8715 rooms
- 4106 rooms
- 1187 rooms
- 908 rooms
- 749+ rooms
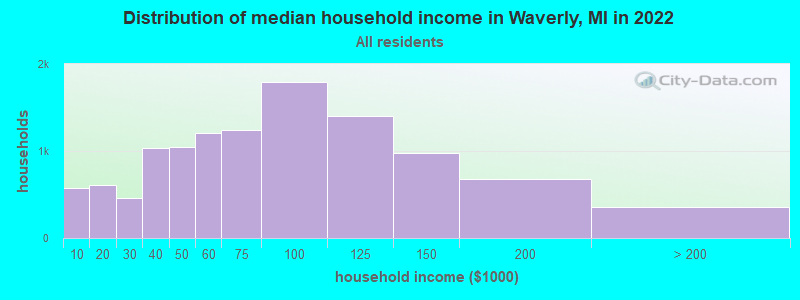
Waverly, MI household income distribution

- 578Less than $10,000
- 610$10,000 to $19,999
- 465$20,000 to $29,999
- 1,037$30,000 to $39,999
- 1,049$40,000 to $49,999
- 1,204$50,000 to $59,999
- 1,243$60,000 to $74,999
- 1,794$75,000 to $99,999
- 1,406$100,000 to $124,999
- 976$125,000 to $149,999
- 674$150,000 to $199,999
- 355$200,000 or more
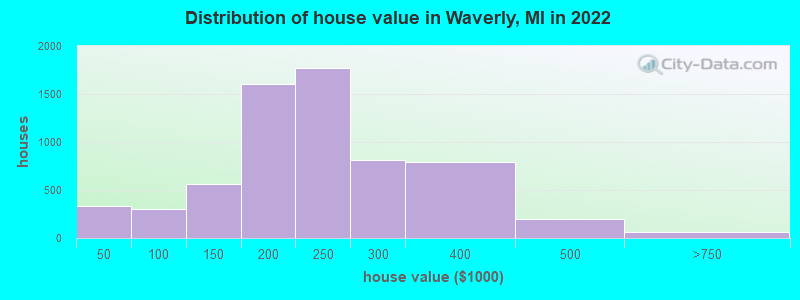
Home value of owner - occupied houses in 2022 in Waverly, MI
-
- 33Less than $10,000
- 28$10,000 to $14,999
- 137$15,000 to $19,999
- 41$20,000 to $24,999
- 29$25,000 to $29,999
- 44$30,000 to $34,999
- 22$40,000 to $49,999
- 59$50,000 to $59,999
- 57$60,000 to $69,999
- 62$70,000 to $79,999
- 10$80,000 to $89,999
- 86$90,000 to $99,999
- 280$100,000 to $124,999
- 281$125,000 to $149,999
- 782$150,000 to $174,999
- 819$175,000 to $199,999
- 1,774$200,000 to $249,999
- 816$250,000 to $299,999
- 787$300,000 to $399,999
- 202$400,000 to $499,999
- 63$500,000 to $749,999
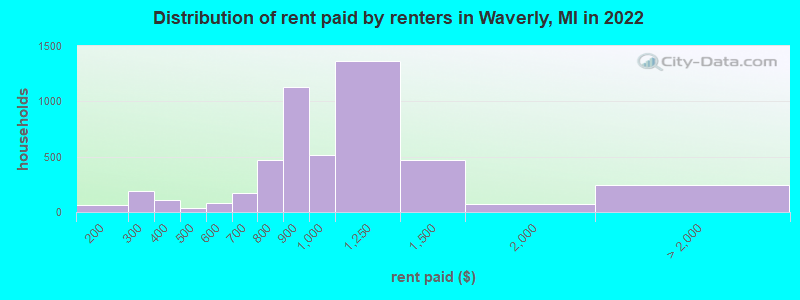
Rent paid by renters in 2022 in Waverly, MI
-
- 66$150 to $199
- 58$200 to $249
- 128$250 to $299
- 18$300 to $349
- 88$350 to $399
- 29$400 to $449
- 7$450 to $499
- 7$500 to $549
- 70$550 to $599
- 41$600 to $649
- 128$650 to $699
- 214$700 to $749
- 251$750 to $799
- 1,127$800 to $899
- 512$900 to $999
- 1,361$1,000 to $1,249
- 466$1,250 to $1,499
- 73$1,500 to $1,999
- 40$2,000 to $2,499
- 36$2,500 to $2,999
- 9$3,000 to $3,499
- 29$3,500 or more
- 132No cash rent
Percentage of workers working in this county: 51.5%
Number of people working at home: 2,470 (19.3% of all workers)
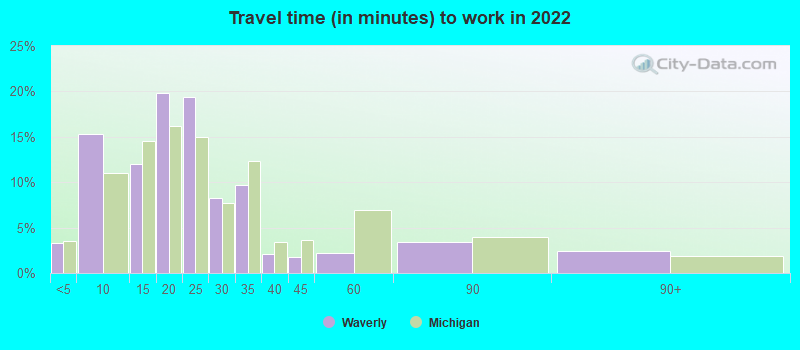
Travel time to work (commute)
- Less than 5 minutes: 343
- 5 to 9 minutes: 1,894
- 10 to 14 minutes: 2,044
- 15 to 19 minutes: 2,056
- 20 to 24 minutes: 1,824
- 25 to 29 minutes: 441
- 30 to 34 minutes: 468
- 35 to 39 minutes: 8
- 40 to 44 minutes: 39
- 45 to 59 minutes: 346
- 60 to 89 minutes: 648
- 90 or more minutes: 50
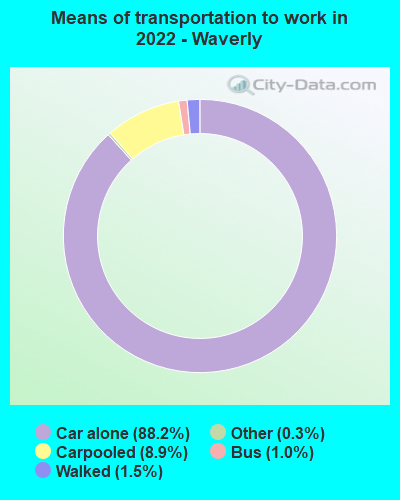
Means of transportation to work:
- Drove a car alone: 8,143 (71.0%)
- Carpooled: 833 (7.3%)
- Bus: 75 (0.7%)
- Taxi: 35 (0.3%)
- Bicycle: 9 (0.1%)
- Walked: 138 (1.2%)
- Worked at home: 2,470 (21.5%)
- Unemployment by race in 2022
- Unemployment rate for White non-Hispanic residents
- 4.6%Males
- 2.2%Females
- Unemployment rate for Black residents
- 10.6%Males
- 14.2%Females
- Unemployment rate for Asian residents
- 1.4%Females
- Unemployment rate for other race residents
- 6.9%Males
- 20.5%Females
- Unemployment rate for two or more race residents
- 9.6%Males
- Unemployment rate for Hispanic or Latino residents
- 5.5%Males
- 11.5%Females
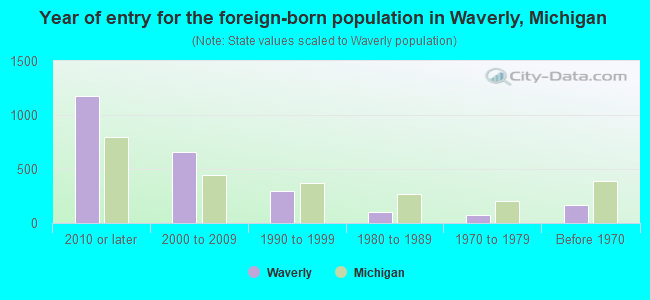
- Year of entry for the foreign-born population in Waverly, Michigan
- 1,1722010 or later
- 6592000 to 2009
- 2961990 to 1999
- 991980 to 1989
- 781970 to 1979
- 166Before 1970

First ancestries reported:
- German: 1,357 (12.1%)
- English: 1,129 (10.1%)
- Irish: 651 (5.8%)
- American: 649 (5.8%)
- Italian: 302 (2.7%)
- Polish: 204 (1.8%)
- Afghan: 172 (1.5%)
- Lebanese: 129 (1.1%)
- Haitian: 124 (1.1%)
- Somali: 116 (1.0%)
- Dutch: 111 (1.0%)
- African: 101 (0.9%)
- Scottish: 99 (0.9%)
- French Canadian: 99 (0.9%)
- European: 97 (0.9%)
- Ukrainian: 87 (0.8%)
- Ethiopian: 74 (0.7%)
- French: 69 (0.6%)
- Swedish: 62 (0.6%)
- Danish: 46 (0.4%)
- Scotch-Irish: 45 (0.4%)
- Swiss: 42 (0.4%)
- British: 41 (0.4%)
- Hungarian: 34 (0.3%)
- Norwegian: 30 (0.3%)
- Welsh: 29 (0.3%)
- Guyanese: 24 (0.2%)
- Greek: 22 (0.2%)
- Czech: 21 (0.2%)
- Kenyan: 20 (0.2%)
- Slovak: 19 (0.2%)
- Northern European: 18 (0.2%)
- Croatian: 17 (0.2%)
- Iranian: 17 (0.2%)
- Jamaican: 17 (0.2%)
- Lithuanian: 16 (0.1%)
- Finnish: 15 (0.1%)
- Eastern European: 12 (0.1%)
- Iraqi: 11 (0.10%)
- Palestinian: 9 (0.08%)
- Cypriot: 8 (0.07%)
- Russian: 8 (0.07%)
- Canadian: 6 (0.05%)
- Latvian: 6 (0.05%)
- Macedonian: 4 (0.04%)
- Brazilian: 4 (0.04%)
Most common places of birth for foreign-born residents (%):
| Waverly: | 32.9% (861) |
| Michigan: | 11.1% (77,240) |
| Waverly: | 5.4% (140) |
| Michigan: | 0.6% (4,087) |
| Waverly: | 5.1% (134) |
| Michigan: | 2.8% (19,112) |
| Waverly: | 4.9% (127) |
| Michigan: | 1.8% (12,679) |
| Waverly: | 4.2% (111) |
| Michigan: | 0.2% (1,173) |
| Waverly: | 3.6% (94) |
| Michigan: | 0.3% (1,985) |
| Waverly: | 3.4% (90) |
| Michigan: | 3.0% (20,884) |
| Waverly: | 3.1% (82) |
| Michigan: | 0.5% (3,687) |
| Waverly: | 2.8% (74) |
| Michigan: | 10.9% (75,965) |
| Waverly: | 2.3% (61) |
| Michigan: | 3.7% (25,634) |
| Waverly: | 2.3% (60) |
| Michigan: | 0.4% (2,853) |
| Waverly: | 2.2% (57) |
| Michigan: | 0.1% (1,042) |
| Waverly: | 2.1% (56) |
| Michigan: | 0.6% (4,245) |
| Waverly: | 2.0% (53) |
| Michigan: | 0.2% (1,481) |
| Waverly: | 1.9% (50) |
| Michigan: | 0.7% (4,645) |
| Waverly: | 1.8% (48) |
| Michigan: | 0.2% (1,685) |
| Waverly: | 1.7% (44) |
| Michigan: | 0.8% (5,492) |
| Waverly: | 1.6% (41) |
| Michigan: | 0.1% (401) |
Place of birth for U.S.-born residents:
- This state: 16,744
- Other state: 4,332
- Northeast: 758
- Midwest: 2,125
- South: 990
- West: 436
84.5% of Waverly residents lived in the same house 1 years ago.
Out of people who lived in different houses, 23.9% lived in this county.
Out of people who lived in different counties, 75.8% lived in Michigan.
| Waverly: | 84.5% |
| State average: | 88.4% |
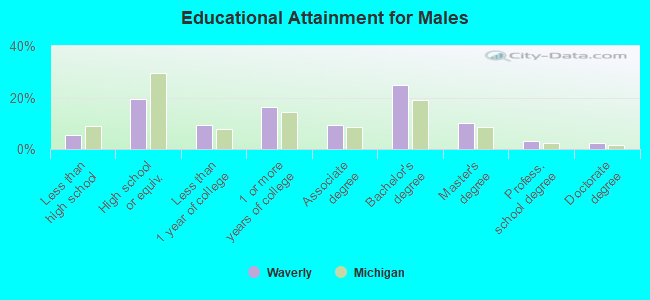
Education attainment for males 25 years and older:
- No schooling: 34
- Nursery to 4th grade: 17
- 5th and 6th grade: 0
- 7th and 8th grade: 5
- 9th grade: 13
- 10th grade: 78
- 11th grade: 182
- 12th grade, no diploma: 98
- High school graduate (or equivalency): 1,554
- Less than 1 year of college: 760
- Some college more than 1 year, no degree: 1,303
- Associate degree: 755
- Bachelor's degree: 2,015
- Master's degree: 803
- Professional school degree: 246
- Doctorate degree: 193
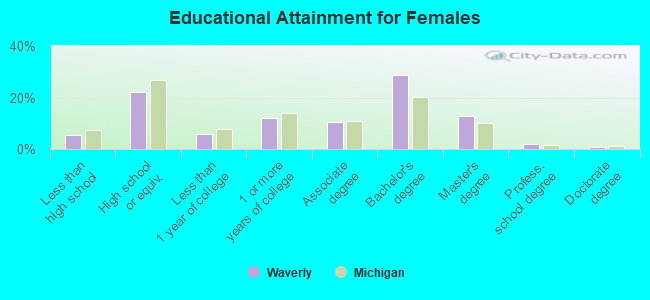
Education attainment for females 25 years and older:
- No schooling: 119
- Nursery to 4th grade: 24
- 5th and 6th grade: 9
- 7th and 8th grade: 9
- 9th grade: 10
- 10th grade: 93
- 11th grade: 181
- 12th grade, no diploma: 104
- High school graduate (or equivalency): 2,161
- Less than 1 year of college: 591
- Some college more than 1 year, no degree: 1,201
- Associate degree: 1,015
- Bachelor's degree: 2,819
- Master's degree: 1,270
- Professional school degree: 181
- Doctorate degree: 59


Housing units in structures:
- One, detached: 5,622
- One, attached: 1,071
- Two: 86
- 3 or 4: 514
- 5 to 9: 1,021
- 10 to 19: 1,893
- 20 to 49: 732
- 50 or more: 857
- Mobile homes: 174
- Boats, RVs, vans, etc.: 64
Median worth of mobile homes: $29,341
Housing units lacking complete kitchen facilities in 2022: 0.7%
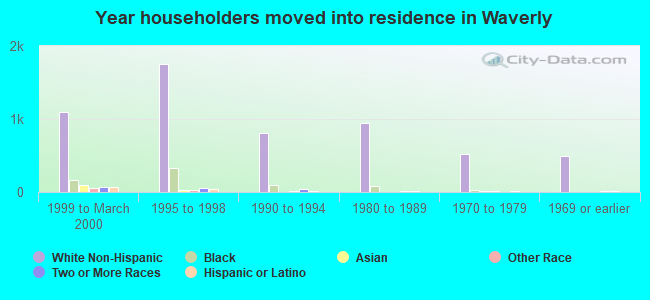
House/condo owner moved in on average 13 years ago
Renter moved in on average 1 years ago
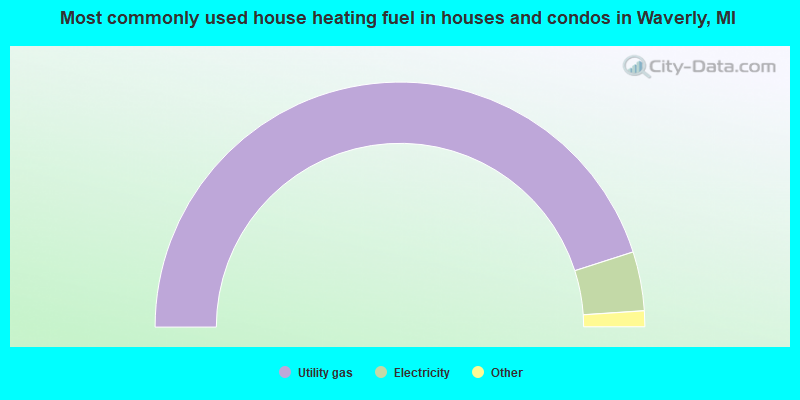
- 90.2%Utility gas
- 7.8%Electricity
- 1.9%Bottled, tank, or LP gas
- 0.1%Wood
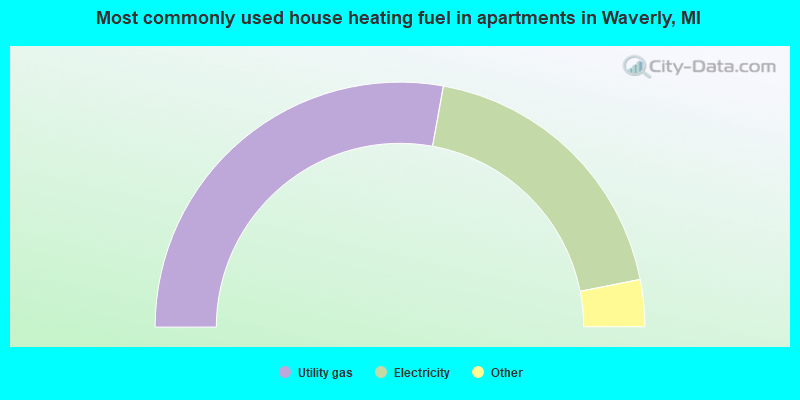
- 55.7%Utility gas
- 38.1%Electricity
- 2.4%No fuel used
- 1.8%Bottled, tank, or LP gas
- 1.7%Other fuel
- 0.3%Fuel oil, kerosene, etc.
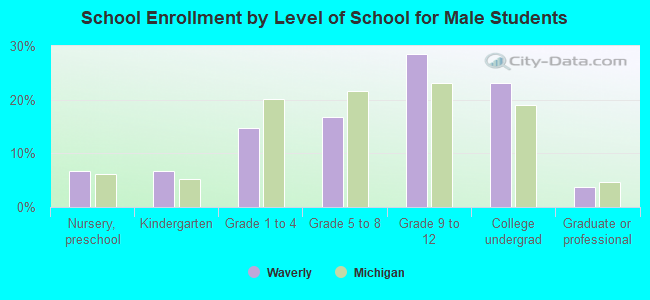
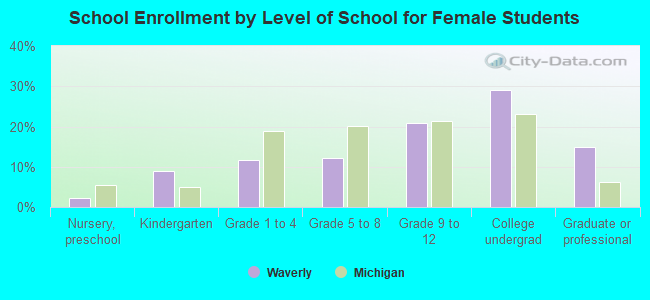
Private vs. public school enrollment:
| Here: | 30.5% |
| Michigan: | 12.4% |
| Here: | 6.3% |
| Michigan: | 9.8% |
| Here: | 16.7% |
| Michigan: | 14.9% |