Wayne, IL (Illinois) Houses and Residents
| Wayne: | $669,975 |
| Illinois: | $251,600 |
Mean price in 2022:
Detached houses: $744,241
Here: $744,241 State: $310,164
Total population: 2,442 (Urban population: 2,015, Rural population: 84 (all nonfarm))
Houses: 917 (900 occupied: 847 owner occupied, 54 renter occupied)
| % of renters here: | 6% |
| State: | 33% |
Housing density: 158 houses/condos per square mile
Median price asked for vacant for-sale houses and condos in 2022 in this county: $467,579.
Median gross rent in Wayne, IL in 2022: $-640,017,192
Housing units in Wayne with a mortgage: 592 (54 second mortgage, 0 home equity loan, 55 both second mortgage and home equity loan)
Houses without a mortgage: 49
Median household income for houses/condos with a mortgage: $167,217
Median household income for apartments without a mortgage: $161,758
Median monthly housing costs: $2,861
Compare current foreclosures near Wayne, IL:
| Photo | Address | Area | Beds / Baths | Price | Details |
|---|---|---|---|---|---|

|
#1
Brewster Creek Cir
Wayne, IL 60184
|
- sq. feet
|
- baths - beds |
show details | |

|
#2
Honey Hill Circle
Wayne, IL 60184
|
- sq. feet
|
- baths - beds |
show details | |

|
#3
Rochefort Ln
Wayne, IL 60184
|
- sq. feet
|
- baths - beds |
show details | |

|
#4
Honey Hill Cir
Wayne, IL 60184
|
- sq. feet
|
- baths - beds |
show details | |

|
#5
Wisconsin Ave
Barrington, IL 60010
|
1,297 sq. feet
|
2 baths 3 beds |
$489,900
|
show details |

|
#6
E Crest Ave
Addison, IL 60101
|
2,023 sq. feet
|
1 baths 5 beds |
$296,100
|
show details |

|
#7
Corron Rd
Elgin, IL 60124
|
3,352 sq. feet
|
3 baths 4 beds |
$685,000
|
show details |

|
#8
Briar Hill Dr
Schaumburg, IL 60194
|
1,600 sq. feet
|
2 baths 4 beds |
$410,400
|
show details |

|
#9
Tall Oaks Dr
Aurora, IL 60505
|
685 sq. feet
|
1 baths 1 beds |
$127,000
|
show details |

|
#10
Wilke Rd
Rolling Meadows, IL 60008
|
1,061 sq. feet
|
1 baths 2 beds |
$319,900
|
show details |
| Photo | Address | Area | Beds / Baths | Price | Details |
|---|---|---|---|---|---|

|
#11
Serendipity Dr
Aurora, IL 60504
|
- sq. feet
|
1 baths 3 beds |
$213,200
|
show details |

|
#12
Hesterman Dr
Glendale Heights, IL 60139
|
1,263 sq. feet
|
2 baths 2 beds |
show details | |

|
#13
Kirkland Lane
Villa Park, IL 60181
|
1,100 sq. feet
|
2 baths 3 beds |
show details | |

|
#14
Scarsdale Ct Unit C2
Schaumburg, IL 60193
|
950 sq. feet
|
1 baths 2 beds |
show details | |

|
#15
Wilson St
Hanover Park, IL 60133
|
1,040 sq. feet
|
2 baths 2 beds |
show details | |

|
#16
Pine St
Sugar Grove, IL 60554
|
2,840 sq. feet
|
4 baths 4 beds |
show details | |

|
#17
Prairie Ct
West Chicago, IL 60185
|
2,291 sq. feet
|
3 baths 3 beds |
show details | |

|
#18
S Hart St
Palatine, IL 60067
|
1,183 sq. feet
|
1 baths 3 beds |
show details | |

|
#19
Ridgewood Ave
Bensenville, IL 60106
|
1,378 sq. feet
|
2 baths 4 beds |
show details | |

|
#20
Cherry Ave
Hanover Park, IL 60133
|
1,246 sq. feet
|
1 baths 3 beds |
show details |
| Photo | Address | Area | Beds / Baths | Price | Details |
|---|---|---|---|---|---|

|
#21
Pond Gate Dr
Barrington, IL 60010
|
4,996 sq. feet
|
2 baths 4 beds |
show details | |

|
#22
N Shady Ln.
Elgin, IL 60124
|
2,544 sq. feet
|
2 baths 3 beds |
show details | |

|
#23
Pennsylvania Ave
Aurora, IL 60506
|
855 sq. feet
|
1 baths 2 beds |
show details | |

|
#24
Woodside Dr
Wood Dale, IL 60191
|
3,504 sq. feet
|
4 baths 5 beds |
show details | |

|
#25
Jester Ln
Algonquin, IL 60102
|
1,299 sq. feet
|
2 baths 4 beds |
show details | |

|
#26
Sequoia Dr
Hanover Park, IL 60133
|
1,773 sq. feet
|
2 baths 3 beds |
show details | |

|
#27
Breckenridge Cir
Aurora, IL 60504
|
2,250 sq. feet
|
2 baths 4 beds |
show details | |

|
#28
E State St
North Aurora, IL 60542
|
2,070 sq. feet
|
1 baths 5 beds |
show details | |

|
#29
N Harvard Ave
Arlington Heights, IL 60004
|
1,614 sq. feet
|
2 baths 4 beds |
show details | |

|
#30
N Westwood Ave
Lombard, IL 60148
|
1,208 sq. feet
|
2 baths 3 beds |
show details |
| Photo | Address | Area | Beds / Baths | Price | Details |
|---|---|---|---|---|---|

|
#31
Blume Dr
Elgin, IL 60124
|
3,373 sq. feet
|
3 baths 5 beds |
show details | |

|
#32
Laurel Ln
Naperville, IL 60540
|
1,612 sq. feet
|
1 baths 4 beds |
show details | |

|
#33
Indian Dr
Glen Ellyn, IL 60137
|
1,327 sq. feet
|
1 baths 3 beds |
show details | |

|
#34
Getty St
Elgin, IL 60120
|
1,280 sq. feet
|
3 baths 3 beds |
show details | |

|
#35
S Harvard Ave
Addison, IL 60101
|
1,080 sq. feet
|
2 baths 5 beds |
show details | |

|
#36
N Braintree Dr
Schaumburg, IL 60194
|
2,265 sq. feet
|
3 baths 4 beds |
show details | |

|
#37
N River St
Aurora, IL 60506
|
2,240 sq. feet
|
2 baths 4 beds |
show details | |

|
#38
Church Rd
Bensenville, IL 60106
|
- sq. feet
|
2 baths 2 beds |
show details | |

|
#39
Bonner Ave
Aurora, IL 60505
|
748 sq. feet
|
1 baths 2 beds |
show details | |

|
#40
Williamsburg Dr
Hoffman Estates, IL 60169
|
1,176 sq. feet
|
1 baths 3 beds |
show details |
| Photo | Address | Area | Beds / Baths | Price | Details |
|---|---|---|---|---|---|

|
#41
Rebecca Ct
Schaumburg, IL 60193
|
2,330 sq. feet
|
5 baths 4 beds |
show details | |

|
#42
Partridge Ct
Algonquin, IL 60102
|
1,400 sq. feet
|
2 baths 2 beds |
show details | |

|
#43
2nd Ave
Aurora, IL 60505
|
864 sq. feet
|
1 baths 3 beds |
show details | |

|
#44
Winston Dr
Schaumburg, IL 60192
|
1,379 sq. feet
|
2 baths 3 beds |
show details | |

|
#45
Cottonwood Dr
Elgin, IL 60123
|
1,751 sq. feet
|
3 baths 3 beds |
show details | |

|
#46
W 104 Vly View Drive
Glen Ellyn, IL 60137
|
- sq. feet
|
1 baths 3 beds |
show details | |

|
#47
Newcastle Dr
Roselle, IL 60172
|
1,743 sq. feet
|
3 baths 3 beds |
show details | |

|
#48
Heather Ct
Warrenville, IL 60555
|
1,332 sq. feet
|
2 baths 3 beds |
show details | |

|
#49
W Wrightwood Ave
Glendale Heights, IL 60139
|
1,104 sq. feet
|
1 baths 3 beds |
show details | |

|
Check over 1 million property listings on Foreclosure.com!
|
browse all offers | |||

Latest news about housing in Wayne, IL collected exclusively by city-data.com from local newspapers, TV, and radio stations

 | Suburbs in Dupage County/western chicagoland with biggest houses? (17 replies) |
| Homesteading + supportive community (16 replies) |
| Very weak housing market in Highland Park (66 replies) |
| It's really hard to find a house in Hinsdale! (65 replies) |
| Property Taxes and COVID-19 (187 replies) |
| Are suburbs growing in popularity because of Covid? (41 replies) |

Median year apartment built: 1965
Household type by relationship:
Households: 2,201- Male householders: 421 (48 living alone), Female householders: 465 (132 living alone)
628 spouses (628 opposite-sex spouses), 32 unmarried partners, (25 opposite-sex unmarried partners), 573 children (566 natural, 0 adopted, 7 stepchildren), 16 grandchildren, 0 brothers or sisters, 5 parents, 0 foster children, 5 other relatives, 51 non-relatives
Size of family households: 379 2-persons, 110 3-persons, 139 4-persons, 30 5-persons, 17 6-persons.
Size of nonfamily households: 187 1-person, 35 2-persons, 1 4-persons.
269 married couples with children.
28 single-parent households (4 men, 24 women).
85.0% of residents of Wayne speak English at home.
3.7% of residents speak Spanish at home (94% speak English very well, 6% speak English well).
11.8% of residents speak other Indo-European language at home (45% speak English very well, 54% speak English well, 2% speak English not well).
0.2% of residents speak Asian or Pacific Island language at home (100% speak English well).
0.3% of residents speak other language at home (100% speak English very well).
Foreign born population: 357 (16.2%)
(83.5% of them are naturalized citizens)
| Here: | 8.2 |
| State: | 6.4 |
| Here: | 8.1 |
| State: | 4.1 |

- Bedrooms in owner-occupied houses and condos in Wayne, Illinois
- 6no bedroom
- 71 bedroom
- 302 bedrooms
- 3123 bedrooms
- 3314 bedrooms
- 1615+ bedrooms

- Bedrooms in renter-occupied apartments in Wayne, Illinois
- 0no bedroom
- 191 bedroom
- 52 bedrooms
- 133 bedrooms
- 84 bedrooms
- 95+ bedrooms

- Cars and other vehicles available in Wayne in owner-occupied houses/condos
- 20no vehicle
- 1841 vehicle
- 3012 vehicles
- 2293 vehicles
- 664 vehicles
- 465+ vehicles

- Cars and other vehicles available in Wayne in renter-occupied apartments
- 0no vehicle
- 71 vehicle
- 332 vehicles
- 93 vehicles
- 54 vehicles
- 05+ vehicles

- Rooms in owner-occupied houses in Wayne, Illinois
- 01 room
- 02 rooms
- 103 rooms
- 204 rooms
- 75 rooms
- 916 rooms
- 1987 rooms
- 1288 rooms
- 3939+ rooms

- Rooms in renter-occupied apartments in Wayne, Illinois
- 01 room
- 02 rooms
- 03 rooms
- 194 rooms
- 45 rooms
- 06 rooms
- 07 rooms
- 58 rooms
- 269+ rooms


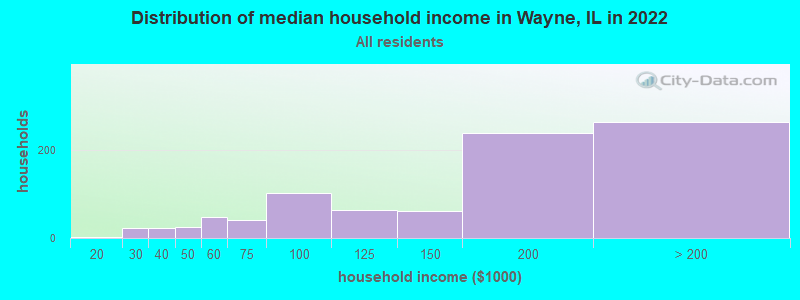
Wayne, IL household income distribution

- 3$10,000 to $19,999
- 23$20,000 to $29,999
- 22$30,000 to $39,999
- 26$40,000 to $49,999
- 47$50,000 to $59,999
- 42$60,000 to $74,999
- 102$75,000 to $99,999
- 63$100,000 to $124,999
- 61$125,000 to $149,999
- 238$150,000 to $199,999
- 264$200,000 or more
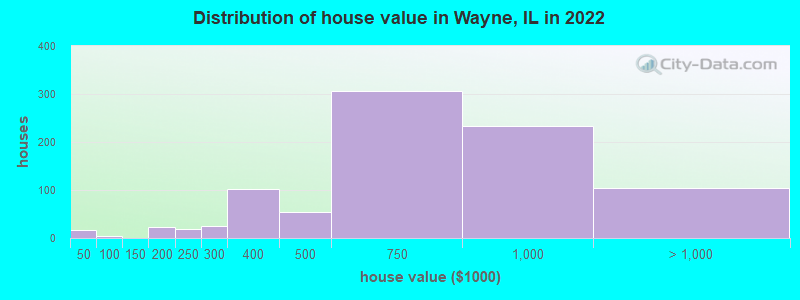
Home value of owner - occupied houses in 2022 in Wayne, IL
-
- 8Less than $10,000
- 8$30,000 to $34,999
- 3$70,000 to $79,999
- 16$150,000 to $174,999
- 6$175,000 to $199,999
- 17$200,000 to $249,999
- 23$250,000 to $299,999
- 102$300,000 to $399,999
- 53$400,000 to $499,999
- 305$500,000 to $749,999
- 233$750,000 to $999,999
- 55$1,000,000 to $1,499,999
- 14$1,500,000 to $1,999,999
- 33$2,000,000 or more
Rent paid by renters in 2022 in Wayne, IL
-
- 24$800 to $899
- 3$1,500 to $1,999
- 4$2,000 to $2,499
- 15$3,000 to $3,499
- 10$3,500 or more
- 4No cash rent


Percentage of workers working in this county: 60.7%
Number of people working at home: 246 (18.7% of all workers)
Travel time to work (commute)
- Less than 5 minutes: 0
- 5 to 9 minutes: 109
- 10 to 14 minutes: 112
- 15 to 19 minutes: 171
- 20 to 24 minutes: 86
- 25 to 29 minutes: 64
- 30 to 34 minutes: 232
- 35 to 39 minutes: 34
- 40 to 44 minutes: 26
- 45 to 59 minutes: 121
- 60 to 89 minutes: 80
- 90 or more minutes: 9
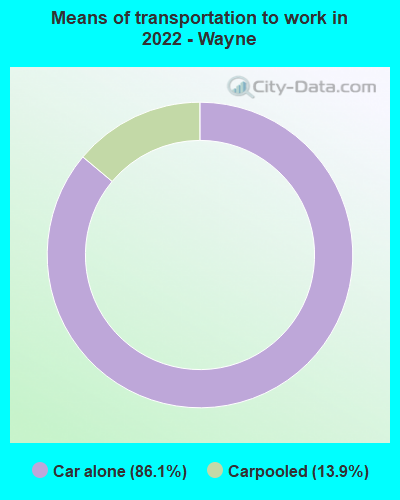
Means of transportation to work:
- Drove a car alone: 153 (38.8%)
- Carpooled: 30 (7.6%)
- Worked at home: 246 (62.4%)

- Unemployment by race in 2022
- Unemployment rate for White non-Hispanic residents
- 3.9%Males
- Unemployment rate for two or more race residents
- 3.1%Males
- 25.2%Females
- Unemployment rate for Hispanic or Latino residents
- 33.6%Females

- Year of entry for the foreign-born population in Wayne, Illinois
- 72010 or later
- 522000 to 2009
- 871990 to 1999
- 101980 to 1989
- 401970 to 1979
- 48Before 1970

First ancestries reported:
- Polish: 163 (16.2%)
- Italian: 97 (9.6%)
- American: 82 (8.1%)
- Irish: 54 (5.4%)
- German: 53 (5.3%)
- European: 47 (4.7%)
- Romanian: 41 (4.1%)
- English: 29 (2.9%)
- Czech: 21 (2.1%)
- Swedish: 19 (1.9%)
- Croatian: 15 (1.5%)
- French Canadian: 14 (1.4%)
- Jordanian: 10 (1.0%)
- Eastern European: 9 (0.9%)
- Northern European: 9 (0.9%)
- British: 8 (0.8%)
- Serbian: 8 (0.8%)
- Dutch: 6 (0.6%)
- Egyptian: 5 (0.5%)
- Canadian: 5 (0.5%)
- Swiss: 5 (0.5%)
- Norwegian: 4 (0.4%)
- Turkish: 4 (0.4%)
- Slovak: 3 (0.3%)
- Slovene: 3 (0.3%)
- Welsh: 2 (0.2%)
- Russian: 1 (0.10%)
Most common places of birth for foreign-born residents (%):
| Wayne: | 24.5% (88) |
| Illinois: | 6.9% (124,474) |
| Wayne: | 19.5% (70) |
| Illinois: | 1.6% (29,519) |
| Wayne: | 13.6% (49) |
| Illinois: | 9.2% (166,409) |
| Wayne: | 12.5% (45) |
| Illinois: | 0.3% (4,938) |
| Wayne: | 8.4% (30) |
| Illinois: | 1.1% (19,306) |
| Wayne: | 7.5% (27) |
| Illinois: | 34.7% (626,958) |
| Wayne: | 2.5% (9) |
| Illinois: | 0.5% (8,551) |
| Wayne: | 2.5% (9) |
| Illinois: | 0.6% (10,943) |
| Wayne: | 1.7% (6) |
| Illinois: | 0.2% (3,977) |
| Wayne: | 1.7% (6) |
| Illinois: | 0.4% (7,171) |
Place of birth for U.S.-born residents:
- This state: 1,488
- Other state: 334
- Northeast: 58
- Midwest: 142
- South: 70
- West: 60
89.3% of Wayne residents lived in the same house 1 years ago.
Out of people who lived in different houses, 41.2% lived in this county.
Out of people who lived in different counties, 95.3% lived in Illinois.
| Wayne: | 89.3% |
| State average: | 88.3% |
Education attainment for males 25 years and older:
- No schooling: 26
- Nursery to 4th grade: 0
- 5th and 6th grade: 0
- 7th and 8th grade: 0
- 9th grade: 0
- 10th grade: 0
- 11th grade: 0
- 12th grade, no diploma: 6
- High school graduate (or equivalency): 107
- Less than 1 year of college: 32
- Some college more than 1 year, no degree: 140
- Associate degree: 54
- Bachelor's degree: 280
- Master's degree: 182
- Professional school degree: 55
- Doctorate degree: 16

Education attainment for females 25 years and older:
- No schooling: 5
- Nursery to 4th grade: 0
- 5th and 6th grade: 0
- 7th and 8th grade: 0
- 9th grade: 0
- 10th grade: 0
- 11th grade: 0
- 12th grade, no diploma: 4
- High school graduate (or equivalency): 93
- Less than 1 year of college: 59
- Some college more than 1 year, no degree: 177
- Associate degree: 70
- Bachelor's degree: 233
- Master's degree: 124
- Professional school degree: 53
- Doctorate degree: 9


Housing units in structures:
- One, detached: 909
- One, attached: 8
House/condo owner moved in on average 12 years ago
Renter moved in on average 6 years ago

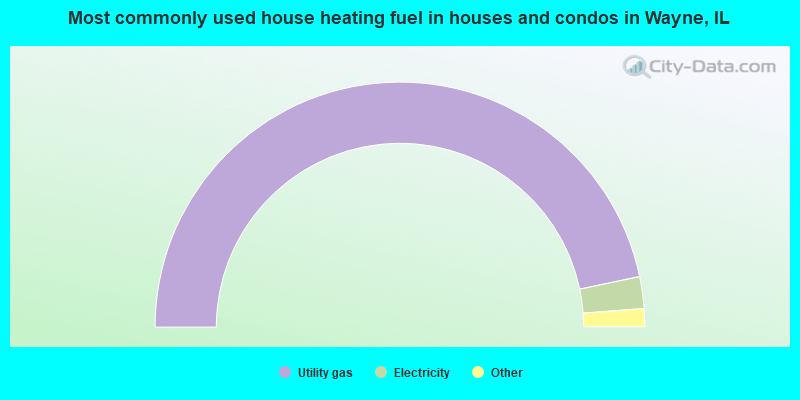
- 93.5%Utility gas
- 4.2%Electricity
- 1.5%Bottled, tank, or LP gas
- 0.8%Wood
- 100.0%Utility gas
Private vs. public school enrollment:
| Here: | 19.4% |
| Illinois: | 13.3% |
| Here: | 32.6% |
| Illinois: | 9.9% |
| Here: | 17.7% |
| Illinois: | 27.4% |


