Wellesley, MA (Massachusetts) Houses and Residents
| Wellesley: | $1,514,923 |
| Massachusetts: | $534,700 |
Mean price in 2022:
Detached houses: $1,870,242
Here: $1,870,242 State: $651,570 Townhouses or other attached units: $1,118,396
Here: $1,118,396 State: $617,749 In 2-unit structures: $857,493
Here: $857,493 State: $594,808 In 3-to-4-unit structures: $451,509
Here: $451,509 State: $601,912 In 5-or-more-unit structures: $960,156
Here: $960,156 State: $555,768
Total population: 27,982 (Urban population: 26,613, Rural population: 0)
Houses: 9,461 (9,091 occupied: 7,635 owner occupied, 1,408 renter occupied)
| % of renters here: | 16% |
| State: | 38% |
Housing density: 929 houses/condos per square mile
Median price asked for vacant for-sale houses and condos in 2022: $1,776,948.
Median contract rent in 2022: over $2,000 (lower quartile is $1,429, upper quartile is over $2,000)
Median rent asked for vacant for-rent units in 2022: $1,988
Median gross rent in Wellesley, MA in 2022: over $2,000
Housing units in Wellesley with a mortgage: 4,818 (855 second mortgage, 17 home equity loan, 776 both second mortgage and home equity loan)
Houses without a mortgage: 126
Median household income for houses/condos with a mortgage: $249,907
Median household income for apartments without a mortgage: $185,896
Median monthly housing costs: $3,486
Compare current foreclosures near Wellesley, MA:
| Photo | Address | Area | Beds / Baths | Price | Details |
|---|---|---|---|---|---|

|
#1
Stillman St
Framingham, MA 01702
|
1,122 sq. feet
|
1 baths 2 beds |
$418,000
|
show details |

|
#2
Boyd St
Boston, MA 02124
|
3,970 sq. feet
|
3 baths 9 beds |
$650,000
|
show details |

|
#3
Church St
Boston, MA 02122
|
3,663 sq. feet
|
3 baths 6 beds |
show details | |

|
#4
Bittersweet Ln
Randolph, MA 02368
|
882 sq. feet
|
1 baths 2 beds |
show details | |

|
#5
Kendrick Ave Apt 307
Quincy, MA 02169
|
1,234 sq. feet
|
2 baths 2 beds |
show details | |

|
#6
Fenwick St
Revere, MA 02151
|
2,080 sq. feet
|
1 baths 3 beds |
show details | |

|
#7
Savin Hill Avenue, Unit 2 190 Savin Hill Avenue Condominium
Boston, MA 02125
|
1,022 sq. feet
|
1 baths 2 beds |
show details | |

|
#8
Thomas St
Jamaica Plain, MA 02130
|
1,990 sq. feet
|
2 baths 2 beds |
show details | |

|
#9
Marcy Rd
Mattapan, MA 02126
|
1,168 sq. feet
|
1 baths 3 beds |
show details | |

|
#10
Emily Jeffers Rd # L
Randolph, MA 02368
|
1,350 sq. feet
|
1 baths 3 beds |
show details |
| Photo | Address | Area | Beds / Baths | Price | Details |
|---|---|---|---|---|---|

|
#11
Pond St
Franklin, MA 02038
|
1,100 sq. feet
|
1 baths 3 beds |
show details | |

|
#12
Everett Cir
Hopkinton, MA 01748
|
5,180 sq. feet
|
3 baths 4 beds |
show details | |

|
#13
Riverside Rd
Franklin, MA 02038
|
3,093 sq. feet
|
2 baths 4 beds |
show details | |

|
#14
Bower St
Medford, MA 02155
|
2,323 sq. feet
|
2 baths 4 beds |
show details | |

|
#15
Crestway Rd
Boston, MA 02128
|
1,370 sq. feet
|
2 baths 4 beds |
show details | |

|
#16
Marks Way
Maynard, MA 01754
|
2,596 sq. feet
|
2 baths 4 beds |
show details | |

|
#17
Richmond St
Boston, MA 02124
|
2,516 sq. feet
|
2 baths 4 beds |
show details | |

|
#18
Webster St
Randolph, MA 02368
|
1,080 sq. feet
|
1 baths 3 beds |
show details | |

|
#19
Goodnow Ln
Framingham, MA 01702
|
2,342 sq. feet
|
2 baths 4 beds |
show details | |

|
#20
Brahms St
Roslindale, MA 02131
|
1,604 sq. feet
|
1 baths 4 beds |
show details |
| Photo | Address | Area | Beds / Baths | Price | Details |
|---|---|---|---|---|---|

|
#21
Great Rd
Stow, MA 01775
|
2,026 sq. feet
|
2 baths 3 beds |
show details | |

|
#22
Congress Pl
Dedham, MA 02026
|
1,966 sq. feet
|
2 baths 4 beds |
show details | |

|
#23
Neponset St
Canton, MA 02021
|
1,053 sq. feet
|
1 baths 2 beds |
show details | |

|
#24
Condor St # 2
Boston, MA 02128
|
3,024 sq. feet
|
1 baths 3 beds |
show details | |

|
#25
Bainbridge St
Malden, MA 02148
|
1,600 sq. feet
|
1 baths 3 beds |
show details | |

|
#26
Vernal St
Everett, MA 02149
|
2,601 sq. feet
|
2 baths 5 beds |
show details | |

|
#27
Cedar St
Ashland, MA 01721
|
2,756 sq. feet
|
3 baths 4 beds |
show details | |

|
#28
Eastern Ave
Malden, MA 02148
|
2,288 sq. feet
|
3 baths 4 beds |
show details | |

|
#29
Deer Path Apt 5
Maynard, MA 01754
|
1,540 sq. feet
|
1 baths 2 beds |
show details | |

|
#30
Ballou St
Quincy, MA 02169
|
1,758 sq. feet
|
1 baths 3 beds |
show details |
| Photo | Address | Area | Beds / Baths | Price | Details |
|---|---|---|---|---|---|

|
#31
Pearson Ave
Somerville, MA 02144
|
3,104 sq. feet
|
3 baths 4 beds |
show details | |

|
#32
Cardington Ave
Billerica, MA 01821
|
1,573 sq. feet
|
2 baths 5 beds |
show details | |

|
#33
Berkshire Ave
Sharon, MA 02067
|
1,289 sq. feet
|
2 baths 3 beds |
show details | |

|
#34
Old Bolton Rd
Hudson, MA 01749
|
1,244 sq. feet
|
1 baths 3 beds |
show details | |

|
#35
Ridgehill Rd
Canton, MA 02021
|
1,196 sq. feet
|
1 baths 3 beds |
show details | |

|
#36
Magnolia St
Boston, MA 02125
|
3,654 sq. feet
|
3 baths 6 beds |
show details | |

|
#37
Gilbert Rd
Needham, MA 02492
|
1,778 sq. feet
|
2 baths 3 beds |
show details | |

|
#38
Grv St
Needham, MA 02492
|
6,542 sq. feet
|
4 baths 6 beds |
show details | |

|
#39
Lindberg Ave
Randolph, MA 02368
|
1,448 sq. feet
|
1 baths 3 beds |
show details | |

|
#40
Azalea Ln
Marlborough, MA 01752
|
1,359 sq. feet
|
2 baths 2 beds |
show details |
| Photo | Address | Area | Beds / Baths | Price | Details |
|---|---|---|---|---|---|

|
#41
Tonawanda St # 2
Boston, MA 02124
|
3,333 sq. feet
|
3 baths 5 beds |
show details | |

|
#42
Briar Dr
Milford, MA 01757
|
1,900 sq. feet
|
2 baths 4 beds |
show details | |

|
#43
Gatta Cir
Woburn, MA 01801
|
1,350 sq. feet
|
2 baths 4 beds |
show details | |

|
#44
E Brookline St Apt 3
Boston, MA 02118
|
642 sq. feet
|
1 baths 2 beds |
show details | |

|
#45
Gladstone St
Boston, MA 02128
|
2,184 sq. feet
|
2 baths 6 beds |
show details | |

|
#46
Washington St
Boston, MA 02124
|
2,206 sq. feet
|
2 baths 3 beds |
show details | |

|
#47
Bower St # 3
Medford, MA 02155
|
2,142 sq. feet
|
2 baths 4 beds |
show details | |

|
#48
Magnolia St
Boston, MA 02125
|
2,970 sq. feet
|
3 baths 6 beds |
show details | |

|
#49
Union St
Quincy, MA 02169
|
1,705 sq. feet
|
2 baths 4 beds |
show details | |

|
Check over 1 million property listings on Foreclosure.com!
|
browse all offers | |||

Latest news about housing in Wellesley, MA collected exclusively by city-data.com from local newspapers, TV, and radio stations

 | Parents buying houses for kids (207 replies) |
| How Much Massachusetts Households Make Per Year: Census Data (37 replies) |
| ISO Boston-area condos with vibrant social scene for intellectual elderly (8 replies) |
| 2023 Real Estate Observations (5278 replies) |
| For those who are thinking about moving to Wellesley (48 replies) |
| What is the difference between Newton and Wellesley? (94 replies) |

Median year apartment built: 1964
Household type by relationship:
Households: 30,003- Male householders: 4,387 (344 living alone), Female householders: 4,610 (1,440 living alone)
6,239 spouses (6,168 opposite-sex spouses), 156 unmarried partners, (129 opposite-sex unmarried partners), 9,259 children (8,698 natural, 143 adopted, 416 stepchildren), 94 grandchildren, 15 brothers or sisters, 297 parents, 0 foster children, 142 other relatives, 316 non-relatives
- In group quarters: 4,483
Size of family households: 2,529 2-persons, 1,425 3-persons, 1,614 4-persons, 938 5-persons, 406 6-persons, 38 7-or-more-persons.
Size of nonfamily households: 1,863 1-person, 143 2-persons, 28 3-persons.
6,696 married couples with children.
657 single-parent households (119 men, 538 women).
79.4% of residents of Wellesley speak English at home.
3.8% of residents speak Spanish at home (77% speak English very well, 16% speak English well, 7% speak English not well).
6.9% of residents speak other Indo-European language at home (74% speak English very well, 15% speak English well, 9% speak English not well, 2% don't speak English at all).
9.0% of residents speak Asian or Pacific Island language at home (70% speak English very well, 19% speak English well, 10% speak English not well, 1% don't speak English at all).
0.9% of residents speak other language at home (100% speak English very well).
Foreign born population: 5,364 (17.9%)
(53.2% of them are naturalized citizens)
| Here: | 10.0 |
| State: | 6.5 |
| Here: | 5.3 |
| State: | 4.0 |

- Bedrooms in owner-occupied houses and condos in Wellesley, Massachusetts
- 39no bedroom
- 681 bedroom
- 5402 bedrooms
- 2,1603 bedrooms
- 2,7184 bedrooms
- 2,1095+ bedrooms

- Bedrooms in renter-occupied apartments in Wellesley, Massachusetts
- 20no bedroom
- 3271 bedroom
- 4822 bedrooms
- 3053 bedrooms
- 2064 bedrooms
- 695+ bedrooms

- Cars and other vehicles available in Wellesley in owner-occupied houses/condos
- 98no vehicle
- 1,5871 vehicle
- 4,1542 vehicles
- 1,4243 vehicles
- 2314 vehicles
- 1405+ vehicles

- Cars and other vehicles available in Wellesley in renter-occupied apartments
- 294no vehicle
- 6241 vehicle
- 3822 vehicles
- 853 vehicles
- 04 vehicles
- 245+ vehicles

- Rooms in owner-occupied houses in Wellesley, Massachusetts
- 391 room
- 352 rooms
- 193 rooms
- 2094 rooms
- 4235 rooms
- 7176 rooms
- 9607 rooms
- 1,2918 rooms
- 3,9419+ rooms

- Rooms in renter-occupied apartments in Wellesley, Massachusetts
- 201 room
- 1422 rooms
- 1403 rooms
- 2484 rooms
- 2045 rooms
- 2176 rooms
- 1267 rooms
- 1808 rooms
- 1309+ rooms


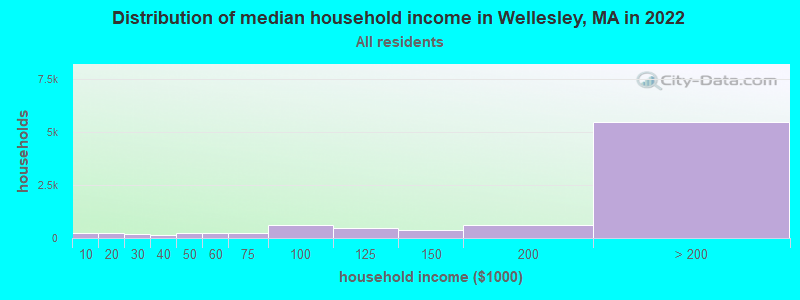
Wellesley, MA household income distribution

- 230Less than $10,000
- 237$10,000 to $19,999
- 192$20,000 to $29,999
- 140$30,000 to $39,999
- 218$40,000 to $49,999
- 226$50,000 to $59,999
- 256$60,000 to $74,999
- 593$75,000 to $99,999
- 490$100,000 to $124,999
- 360$125,000 to $149,999
- 598$150,000 to $199,999
- 5,460$200,000 or more
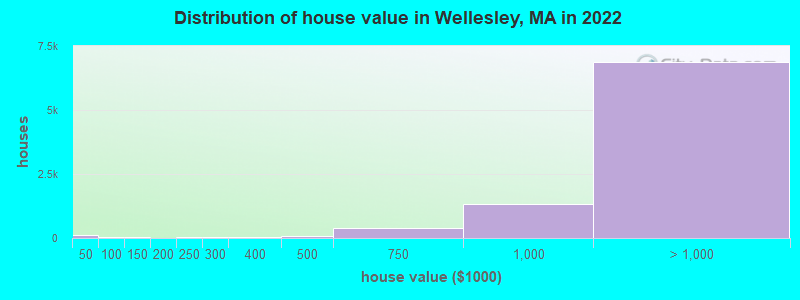
Home value of owner - occupied houses in 2022 in Wellesley, MA
-
- 75Less than $10,000
- 34$10,000 to $14,999
- 20$80,000 to $89,999
- 25$100,000 to $124,999
- 7$125,000 to $149,999
- 4$175,000 to $199,999
- 54$200,000 to $249,999
- 19$250,000 to $299,999
- 23$300,000 to $399,999
- 74$400,000 to $499,999
- 386$500,000 to $749,999
- 1,315$750,000 to $999,999
- 2,491$1,000,000 to $1,499,999
- 2,040$1,500,000 to $1,999,999
- 2,331$2,000,000 or more
Rent paid by renters in 2022 in Wellesley, MA
-
- 10$150 to $199
- 16$200 to $249
- 47$250 to $299
- 31$300 to $349
- 6$350 to $399
- 8$400 to $449
- 17$450 to $499
- 3$500 to $549
- 6$550 to $599
- 7$700 to $749
- 13$800 to $899
- 27$900 to $999
- 50$1,000 to $1,249
- 90$1,250 to $1,499
- 105$1,500 to $1,999
- 194$2,000 to $2,499
- 198$2,500 to $2,999
- 145$3,000 to $3,499
- 338$3,500 or more
- 79No cash rent


Percentage of workers working in this county: 58.1%
Number of people working at home: 4,565 (35.2% of all workers)
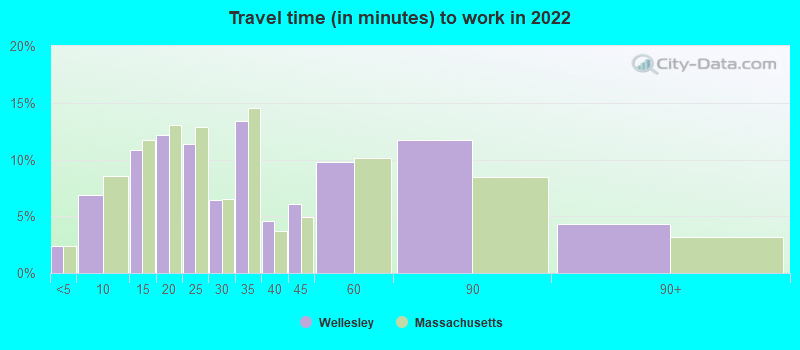
Travel time to work (commute)
- Less than 5 minutes: 318
- 5 to 9 minutes: 865
- 10 to 14 minutes: 1,160
- 15 to 19 minutes: 1,066
- 20 to 24 minutes: 827
- 25 to 29 minutes: 469
- 30 to 34 minutes: 1,203
- 35 to 39 minutes: 317
- 40 to 44 minutes: 477
- 45 to 59 minutes: 1,301
- 60 to 89 minutes: 712
- 90 or more minutes: 132
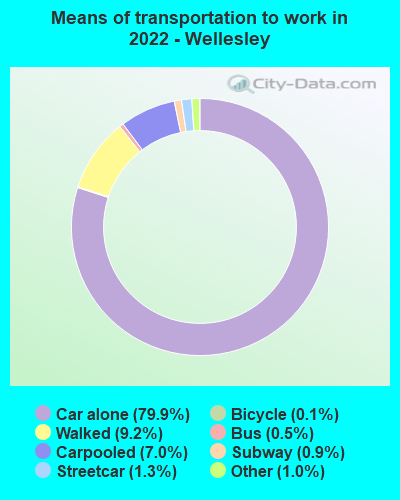
Means of transportation to work:
- Drove a car alone: 13,327 (62.8%)
- Carpooled: 1,150 (5.4%)
- Bus: 60 (0.3%)
- Subway or elevated rail: 211 (1.0%)
- Long-distance train or commuter rail: 179 (0.8%)
- Light rail, streetcar or trolley: 12 (0.1%)
- Taxi: 173 (0.8%)
- Bicycle: 14 (0.1%)
- Walked: 1,454 (6.9%)
- Worked at home: 4,565 (21.5%)

- Unemployment by race in 2022
- Unemployment rate for White non-Hispanic residents
- 3.3%Males
- 4.0%Females
- Unemployment rate for Black residents
- 6.3%Males
- 25.7%Females
- Unemployment rate for Asian residents
- 1.3%Males
- 0.9%Females
- Unemployment rate for two or more race residents
- 1.2%Males
- 5.8%Females
- Unemployment rate for Hispanic or Latino residents
- 2.3%Females

- Year of entry for the foreign-born population in Wellesley, Massachusetts
- 2,4202010 or later
- 8282000 to 2009
- 1,0491990 to 1999
- 6061980 to 1989
- 3241970 to 1979
- 673Before 1970
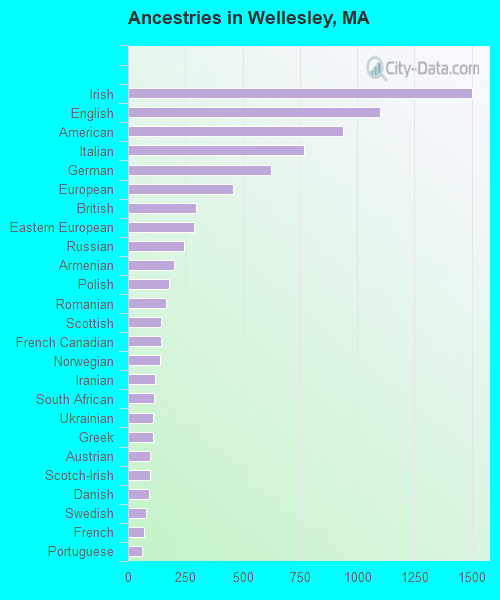
First ancestries reported:
- Irish: 1,501 (10.8%)
- English: 1,102 (7.9%)
- American: 937 (6.7%)
- Italian: 770 (5.5%)
- German: 623 (4.5%)
- European: 460 (3.3%)
- British: 295 (2.1%)
- Eastern European: 289 (2.1%)
- Russian: 245 (1.8%)
- Armenian: 203 (1.5%)
- Polish: 179 (1.3%)
- Romanian: 164 (1.2%)
- Scottish: 144 (1.0%)
- French Canadian: 144 (1.0%)
- Norwegian: 141 (1.0%)
- Iranian: 120 (0.9%)
- South African: 112 (0.8%)
- Ukrainian: 109 (0.8%)
- Greek: 108 (0.8%)
- Austrian: 95 (0.7%)
- Scotch-Irish: 95 (0.7%)
- Danish: 91 (0.7%)
- Swedish: 79 (0.6%)
- French: 71 (0.5%)
- Portuguese: 59 (0.4%)
- Canadian: 56 (0.4%)
- African: 52 (0.4%)
- Finnish: 51 (0.4%)
- Northern European: 48 (0.3%)
- Albanian: 40 (0.3%)
- Lithuanian: 33 (0.2%)
- Haitian: 33 (0.2%)
- Dutch: 32 (0.2%)
- Lebanese: 31 (0.2%)
- Brazilian: 28 (0.2%)
- Kenyan: 28 (0.2%)
- Somali: 28 (0.2%)
- Slovak: 23 (0.2%)
- Swiss: 20 (0.1%)
- Jamaican: 20 (0.1%)
- Latvian: 19 (0.1%)
- Hungarian: 19 (0.1%)
- Afghan: 18 (0.1%)
- Ghanaian: 16 (0.1%)
- Czech: 16 (0.1%)
- Turkish: 16 (0.1%)
- Israeli: 15 (0.1%)
- Cape Verdean: 12 (0.09%)
- Belizean: 12 (0.09%)
- Sierra Leonean: 10 (0.07%)
- Croatian: 10 (0.07%)
- Bulgarian: 10 (0.07%)
- Belgian: 9 (0.06%)
- Egyptian: 9 (0.06%)
- Trinidadian and Tobagonian: 9 (0.06%)
- Welsh: 7 (0.05%)
- Jordanian: 7 (0.05%)
- New Zealander: 6 (0.04%)
- Zimbabwean: 4 (0.03%)
Most common places of birth for foreign-born residents (%):
| Wellesley: | 23.3% (1,245) |
| Massachusetts: | 8.4% (103,233) |
| Wellesley: | 7.1% (378) |
| Massachusetts: | 6.8% (82,934) |
| Wellesley: | 7.0% (372) |
| Massachusetts: | 1.0% (12,709) |
| Wellesley: | 4.0% (213) |
| Massachusetts: | 2.3% (28,158) |
| Wellesley: | 3.2% (169) |
| Massachusetts: | 1.4% (17,613) |
| Wellesley: | 2.5% (135) |
| Massachusetts: | 0.3% (3,727) |
| Wellesley: | 2.5% (133) |
| Massachusetts: | 0.7% (8,536) |
| Wellesley: | 2.4% (127) |
| Massachusetts: | 1.5% (18,278) |
| Wellesley: | 2.3% (122) |
| Massachusetts: | 4.9% (60,432) |
| Wellesley: | 2.2% (117) |
| Massachusetts: | 1.0% (12,529) |
| Wellesley: | 1.8% (96) |
| Massachusetts: | 0.4% (4,618) |
| Wellesley: | 1.7% (91) |
| Massachusetts: | 1.1% (13,446) |
| Wellesley: | 1.5% (80) |
| Massachusetts: | 0.9% (10,915) |
Place of birth for U.S.-born residents:
- This state: 12,700
- Other state: 11,503
- Northeast: 4,753
- Midwest: 3,133
- South: 2,334
- West: 1,522
87.9% of Wellesley residents lived in the same house 1 years ago.
Out of people who lived in different houses, 18.5% lived in this county.
Out of people who lived in different counties, 38.8% lived in Massachusetts.
| Wellesley: | 87.9% |
| State average: | 87.7% |
Education attainment for males 25 years and older:
- No schooling: 65
- Nursery to 4th grade: 15
- 5th and 6th grade: 0
- 7th and 8th grade: 0
- 9th grade: 7
- 10th grade: 0
- 11th grade: 1
- 12th grade, no diploma: 53
- High school graduate (or equivalency): 358
- Less than 1 year of college: 157
- Some college more than 1 year, no degree: 176
- Associate degree: 145
- Bachelor's degree: 2,177
- Master's degree: 2,698
- Professional school degree: 1,135
- Doctorate degree: 791

Education attainment for females 25 years and older:
- No schooling: 45
- Nursery to 4th grade: 18
- 5th and 6th grade: 27
- 7th and 8th grade: 0
- 9th grade: 0
- 10th grade: 8
- 11th grade: 9
- 12th grade, no diploma: 28
- High school graduate (or equivalency): 389
- Less than 1 year of college: 131
- Some college more than 1 year, no degree: 318
- Associate degree: 288
- Bachelor's degree: 3,261
- Master's degree: 2,817
- Professional school degree: 1,072
- Doctorate degree: 742


Housing units in structures:
- One, detached: 7,788
- One, attached: 339
- Two: 275
- 3 or 4: 256
- 5 to 9: 87
- 10 to 19: 97
- 20 to 49: 392
- 50 or more: 224
Housing units lacking complete kitchen facilities in 2022: 1.6%
House/condo owner moved in on average 11 years ago
Renter moved in on average 5 years ago

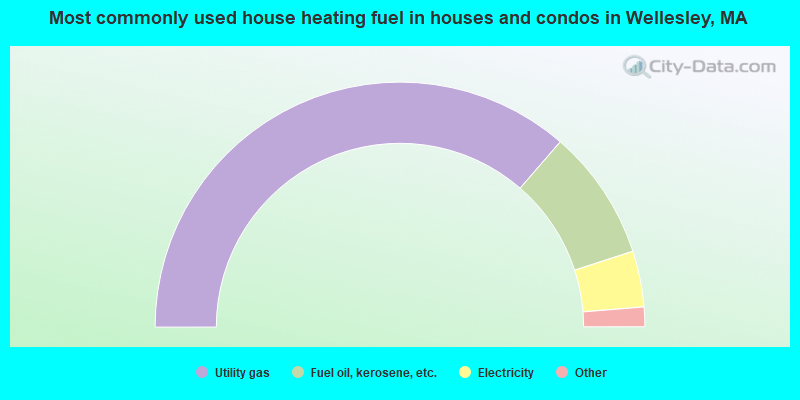
- 72.8%Utility gas
- 17.3%Fuel oil, kerosene, etc.
- 7.4%Electricity
- 1.5%Bottled, tank, or LP gas
- 0.4%No fuel used
- 0.3%Other fuel
- 0.2%Coal or coke
- 0.2%Solar energy
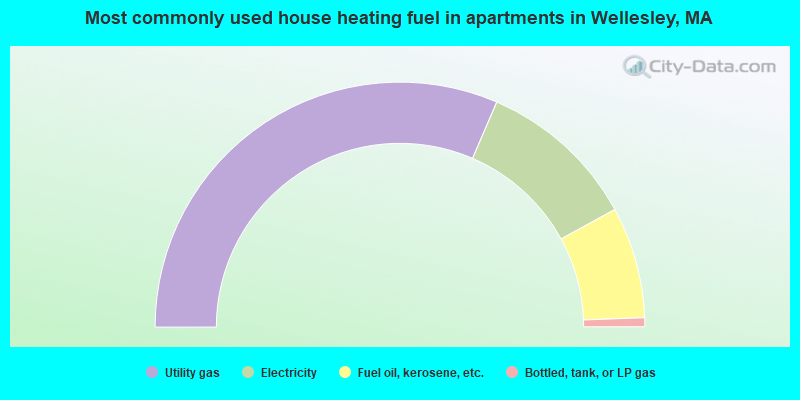
- 62.9%Utility gas
- 21.1%Electricity
- 14.7%Fuel oil, kerosene, etc.
- 1.2%Bottled, tank, or LP gas
Private vs. public school enrollment:
| Here: | 20.2% |
| Massachusetts: | 10.3% |
| Here: | 22.1% |
| Massachusetts: | 12.3% |
| Here: | 93.2% |
| Massachusetts: | 51.2% |


