West Haven, UT (Utah) Houses and Residents
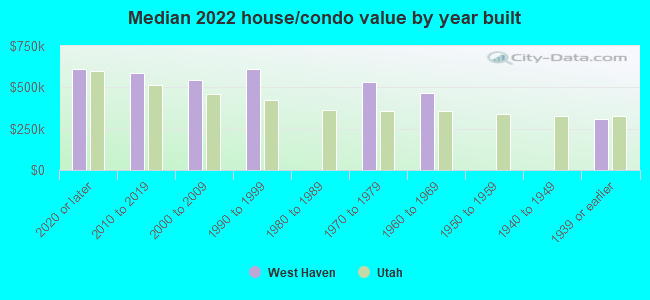
| West Haven: | $581,630 |
| Utah: | $499,500 |
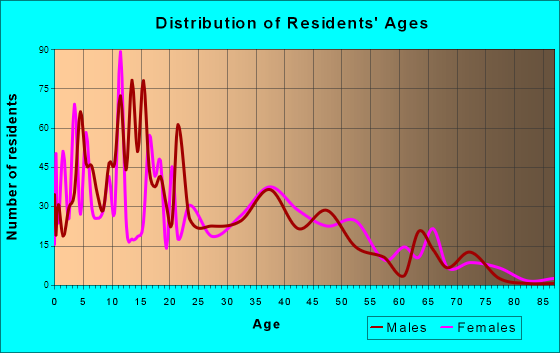
Total population: 11,582 (Urban population: 3,402, Rural population: 590 (31 farm, 559 nonfarm))
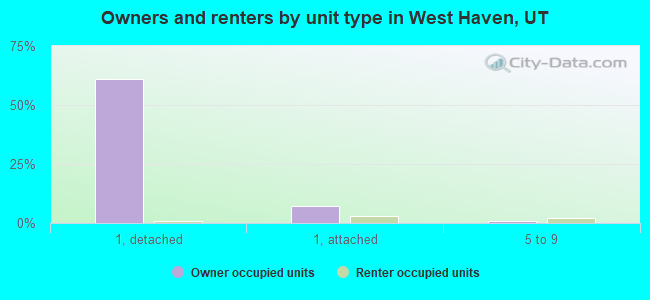
Houses: 6,243 (5,933 occupied: 4,182 owner occupied, 1,815 renter occupied)
| % of renters here: | 30% |
| State: | 29% |
Housing density: 614 houses/condos per square mile
Median price asked for vacant for-sale houses and condos in 2022: $1,605,456.
Median contract rent in 2022: $1,441 (lower quartile is $1,093, upper quartile is $1,822)
Median rent asked for vacant for-rent units in 2022: $1,271
Median gross rent in West Haven, UT in 2022: $1,569
Housing units in West Haven with a mortgage: 3,415 (277 second mortgage, 0 home equity loan, 258 both second mortgage and home equity loan)
Houses without a mortgage: 0
Median household income for houses/condos with a mortgage: $135,793
Median household income for apartments without a mortgage: $67,564
Median monthly housing costs: $1,694
Compare current foreclosures near West Haven, UT:
| Photo | Address | Area | Beds / Baths | Price | Details |
|---|---|---|---|---|---|

|
#1
S 2900 W
Ogden, UT 84401
|
1,186 sq. feet
|
2 baths 3 beds |
show details | |

|
#2
S 2825 W
Roy, UT 84067
|
979 sq. feet
|
2 baths 5 beds |
show details | |

|
#3
N 360 W
Clearfield, UT 84015
|
1,099 sq. feet
|
1 baths 4 beds |
show details | |

|
#4
E Canyon Dr
Ogden, UT 84405
|
1,595 sq. feet
|
2 baths 2 beds |
show details | |

|
#5
N 3450 W
Ogden, UT 84404
|
1,791 sq. feet
|
2 baths 3 beds |
show details | |

|
#6
W 4275 S
Ogden, UT 84401
|
2,154 sq. feet
|
3 baths 3 beds |
show details | |

|
#7
Polk Ave
Ogden, UT 84403
|
1,860 sq. feet
|
1 baths 4 beds |
show details | |

|
#8
W 4925 S
Roy, UT 84067
|
3,668 sq. feet
|
1 baths 5 beds |
show details | |

|
#9
16th St
Ogden, UT 84404
|
- sq. feet
|
1 baths 2 beds |
show details | |

|
#10
Lakeview Dr
Ogden, UT 84414
|
1,595 sq. feet
|
3 baths 6 beds |
show details |
| Photo | Address | Area | Beds / Baths | Price | Details |
|---|---|---|---|---|---|

|
#11
Foothill Dr
Ogden, UT 84403
|
3,219 sq. feet
|
3 baths 4 beds |
show details | |

|
#12
W 3450 N
Ogden, UT 84404
|
- sq. feet
|
2 baths 3 beds |
show details | |

|
#13
Chatelain Rd
Ogden, UT 84403
|
- sq. feet
|
2 baths 5 beds |
show details | |

|
#14
W 1215 S
Syracuse, UT 84075
|
1,429 sq. feet
|
- baths - beds |
show details | |

|
#15
S 550 E
Clearfield, UT 84015
|
- sq. feet
|
- baths - beds |
show details | |

|
#16
Dallas St
Syracuse, UT 84075
|
986 sq. feet
|
- baths - beds |
show details | |

|
#17
W 1215 S
Syracuse, UT 84075
|
1,094 sq. feet
|
- baths - beds |
show details | |

|
#18
N Highway 89, Trlr 320
Ogden, UT 84404
|
- sq. feet
|
- baths - beds |
show details | |

|
#19
S 550 E Apt E-18
Clearfield, UT 84015
|
- sq. feet
|
- baths - beds |
show details | |

|
#20
N Highway 89, Trlr 218
Ogden, UT 84404
|
- sq. feet
|
- baths - beds |
show details |
| Photo | Address | Area | Beds / Baths | Price | Details |
|---|---|---|---|---|---|

|
#21
S 2850 W
Ogden, UT 84401
|
- sq. feet
|
- baths - beds |
show details | |

|
#22
N Highway 89, Trlr 406
Ogden, UT 84404
|
- sq. feet
|
- baths - beds |
show details | |

|
#23
N Highway 89, Trlr 102
Ogden, UT 84404
|
- sq. feet
|
- baths - beds |
show details | |

|
#24
S 550 E Apt F22
Clearfield, UT 84015
|
- sq. feet
|
- baths - beds |
show details | |

|
#25
N Highway 89, Trlr 403
Ogden, UT 84404
|
- sq. feet
|
- baths - beds |
show details | |

|
#26
S State St # B7
Clearfield, UT 84015
|
- sq. feet
|
- baths - beds |
show details | |

|
#27
S 550 E Apt C17
Clearfield, UT 84015
|
- sq. feet
|
- baths - beds |
show details | |

|
#28
W 1290 S
Syracuse, UT 84075
|
- sq. feet
|
- baths - beds |
show details | |

|
#29
N Washington Blvd, Trlr 110
Ogden, UT 84404
|
- sq. feet
|
- baths - beds |
show details | |

|
#30
N Washington Blvd Trlr 190
Ogden, UT 84404
|
- sq. feet
|
- baths - beds |
show details |
| Photo | Address | Area | Beds / Baths | Price | Details |
|---|---|---|---|---|---|

|
#31
N Washington Blvd Trlr 140
Ogden, UT 84404
|
- sq. feet
|
- baths - beds |
show details | |

|
#32
E 1000 S
Clearfield, UT 84015
|
1,032 sq. feet
|
- baths - beds |
show details | |

|
#33
S 1525 W
Clearfield, UT 84015
|
- sq. feet
|
- baths - beds |
show details | |

|
#34
S 550 E # H36
Clearfield, UT 84015
|
- sq. feet
|
- baths - beds |
show details | |

|
#35
W 850 S
Syracuse, UT 84075
|
1,237 sq. feet
|
- baths - beds |
show details | |

|
#36
N Highway 89, Trlr 435
Ogden, UT 84404
|
- sq. feet
|
- baths - beds |
show details | |

|
#37
N 2000 W
Ogden, UT 84404
|
- sq. feet
|
- baths - beds |
show details | |

|
#38
Fashion Point Dr Ste 501
Ogden, UT 84403
|
- sq. feet
|
- baths - beds |
show details | |

|
#39
Fashion Point Dr Ste 501
Ogden, UT 84403
|
- sq. feet
|
- baths - beds |
show details | |

|
#40
Meadow Ln Apt 202
Ogden, UT 84403
|
- sq. feet
|
- baths - beds |
show details |
| Photo | Address | Area | Beds / Baths | Price | Details |
|---|---|---|---|---|---|

|
#41
N 400 W
Ogden, UT 84404
|
- sq. feet
|
- baths - beds |
show details | |

|
#42
Wasatch Dr # 311
Ogden, UT 84403
|
- sq. feet
|
- baths - beds |
show details | |

|
#43
N 200 E
Ogden, UT 84404
|
- sq. feet
|
- baths - beds |
show details | |

|
#44
Maxfield Dr
Ogden, UT 84404
|
- sq. feet
|
- baths - beds |
show details | |

|
#45
Ross Dr
Clearfield, UT 84015
|
1,060 sq. feet
|
- baths - beds |
show details | |

|
#46
S 1280 W
Clearfield, UT 84015
|
1,083 sq. feet
|
- baths - beds |
show details | |

|
#47
Ross Dr
Clearfield, UT 84015
|
854 sq. feet
|
- baths - beds |
show details | |

|
#48
W 1075 S
Syracuse, UT 84075
|
- sq. feet
|
- baths - beds |
show details | |

|
#49
S Depot St, Unit 1
Clearfield, UT 84015
|
- sq. feet
|
- baths - beds |
show details | |

|
Check over 1 million property listings on Foreclosure.com!
|
browse all offers | |||


 | Relocating from the SE? (13 replies) |
| West Haven (10 replies) |
| Pros/cons/info about Ogden area (7 replies) |
| Ogden over Salt Lake? (18 replies) |
| Moving to Ogden (67 replies) |
| Information on Ogden Area (9 replies) |
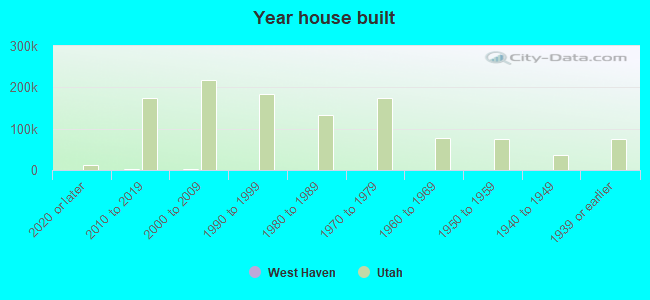
Median year apartment built: 2015
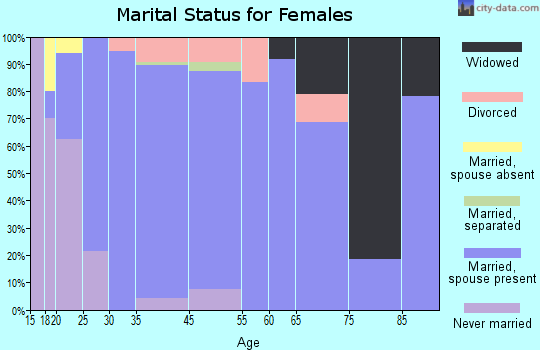
Household type by relationship:
Households: 18,794- Male householders: 3,312 (457 living alone), Female householders: 2,506 (378 living alone)
3,345 spouses (3,345 opposite-sex spouses), 693 unmarried partners, (677 opposite-sex unmarried partners), 7,447 children (6,866 natural, 110 adopted, 470 stepchildren), 229 grandchildren, 168 brothers or sisters, 272 parents, 0 foster children, 252 other relatives, 555 non-relatives
- In group quarters: 10
Size of family households: 1,142 2-persons, 1,032 3-persons, 1,126 4-persons, 1,177 5-persons, 177 6-persons, 96 7-or-more-persons.
Size of nonfamily households: 940 1-person, 224 2-persons, 51 3-persons.
4,648 married couples with children.
1,014 single-parent households (413 men, 601 women).
87.3% of residents of West Haven speak English at home.
9.5% of residents speak Spanish at home (69% speak English very well, 15% speak English well, 14% speak English not well, 3% don't speak English at all).
0.5% of residents speak other Indo-European language at home (81% speak English very well, 19% speak English not well).
2.3% of residents speak Asian or Pacific Island language at home (41% speak English very well, 40% speak English well, 7% speak English not well, 12% don't speak English at all).
0.1% of residents speak other language at home (100% speak English very well).
Foreign born population: 748 (4.0%)
(26.9% of them are naturalized citizens)
| Here: | 6.9 |
| State: | 7.6 |
| Here: | 4.0 |
| State: | 4.3 |
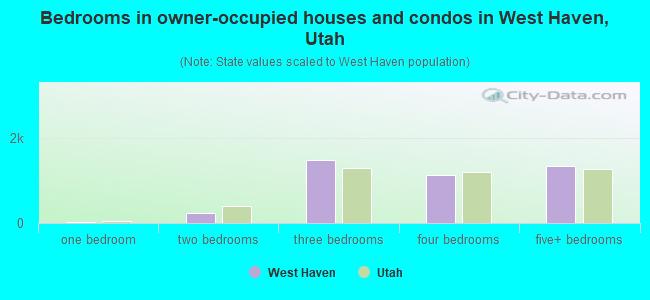
- Bedrooms in owner-occupied houses and condos in West Haven, Utah
- 0no bedroom
- 151 bedroom
- 2382 bedrooms
- 1,4693 bedrooms
- 1,1234 bedrooms
- 1,3385+ bedrooms
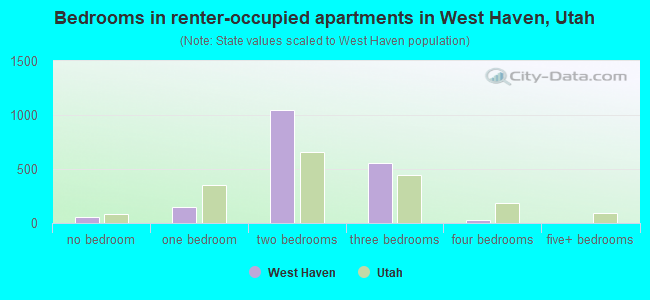
- Bedrooms in renter-occupied apartments in West Haven, Utah
- 53no bedroom
- 1451 bedroom
- 1,0432 bedrooms
- 5513 bedrooms
- 244 bedrooms
- 05+ bedrooms
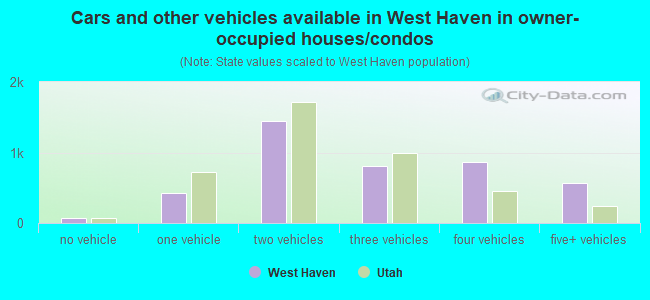
- Cars and other vehicles available in West Haven in owner-occupied houses/condos
- 70no vehicle
- 4281 vehicle
- 1,4492 vehicles
- 8093 vehicles
- 8614 vehicles
- 5655+ vehicles
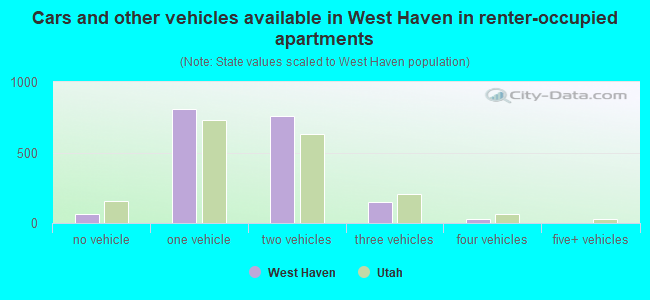
- Cars and other vehicles available in West Haven in renter-occupied apartments
- 67no vehicle
- 8121 vehicle
- 7612 vehicles
- 1463 vehicles
- 314 vehicles
- 05+ vehicles
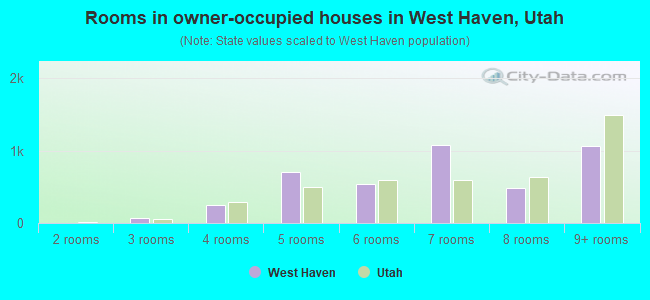
- Rooms in owner-occupied houses in West Haven, Utah
- 01 room
- 02 rooms
- 733 rooms
- 2454 rooms
- 7015 rooms
- 5396 rooms
- 1,0807 rooms
- 4818 rooms
- 1,0649+ rooms
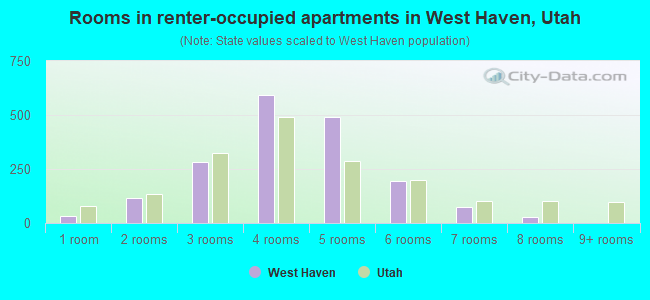
- Rooms in renter-occupied apartments in West Haven, Utah
- 341 room
- 1162 rooms
- 2833 rooms
- 5924 rooms
- 4925 rooms
- 1966 rooms
- 737 rooms
- 308 rooms
- 09+ rooms
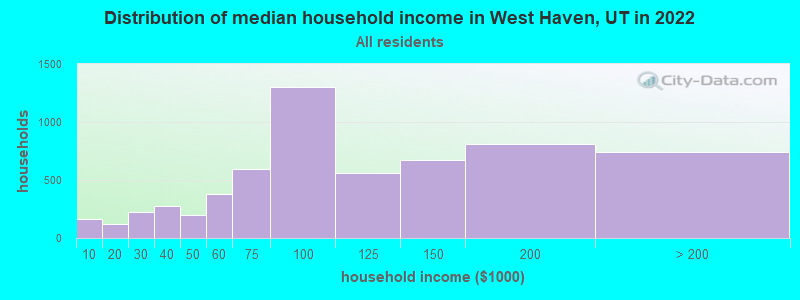
West Haven, UT household income distribution

- 162Less than $10,000
- 118$10,000 to $19,999
- 227$20,000 to $29,999
- 279$30,000 to $39,999
- 199$40,000 to $49,999
- 378$50,000 to $59,999
- 594$60,000 to $74,999
- 1,301$75,000 to $99,999
- 563$100,000 to $124,999
- 673$125,000 to $149,999
- 808$150,000 to $199,999
- 745$200,000 or more
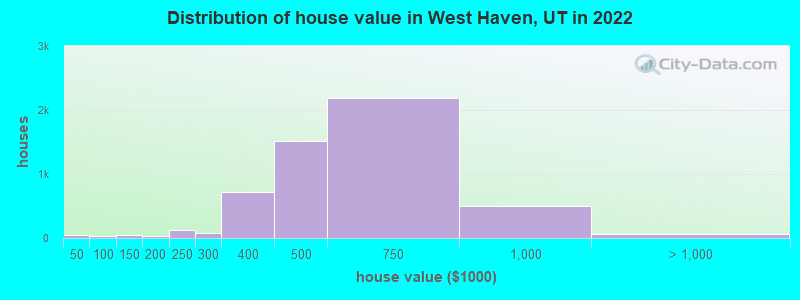
Home value of owner - occupied houses in 2022 in West Haven, UT
-
- 22Less than $10,000
- 9$15,000 to $19,999
- 2$25,000 to $29,999
- 10$40,000 to $49,999
- 15$90,000 to $99,999
- 52$100,000 to $124,999
- 10$150,000 to $174,999
- 21$175,000 to $199,999
- 129$200,000 to $249,999
- 80$250,000 to $299,999
- 719$300,000 to $399,999
- 1,512$400,000 to $499,999
- 2,190$500,000 to $749,999
- 504$750,000 to $999,999
- 58$1,500,000 to $1,999,999
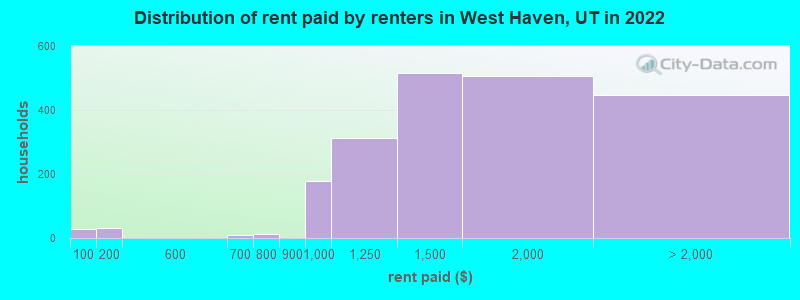
Rent paid by renters in 2022 in West Haven, UT
-
- 27Less than $100
- 30$150 to $199
- 8$650 to $699
- 14$750 to $799
- 178$900 to $999
- 310$1,000 to $1,249
- 515$1,250 to $1,499
- 505$1,500 to $1,999
- 311$2,000 to $2,499
- 135No cash rent
Percentage of workers working in this county: 68.4%
Number of people working at home: 1,936 (19.3% of all workers)
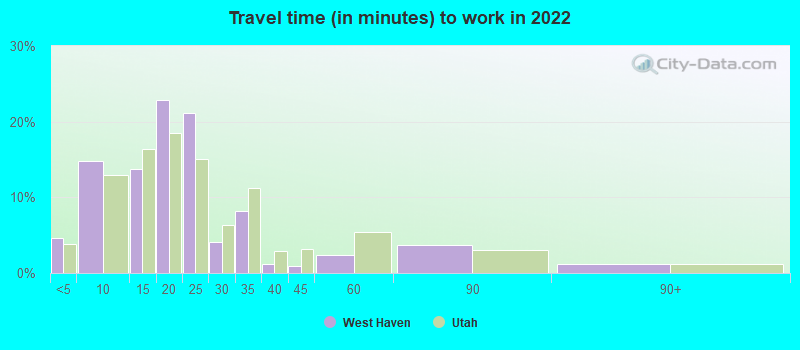
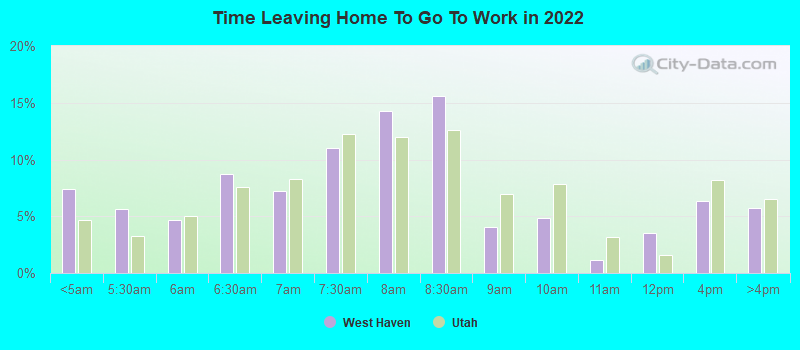
Travel time to work (commute)
- Less than 5 minutes: 315
- 5 to 9 minutes: 842
- 10 to 14 minutes: 1,695
- 15 to 19 minutes: 1,478
- 20 to 24 minutes: 1,380
- 25 to 29 minutes: 454
- 30 to 34 minutes: 724
- 35 to 39 minutes: 183
- 40 to 44 minutes: 126
- 45 to 59 minutes: 376
- 60 to 89 minutes: 452
- 90 or more minutes: 93
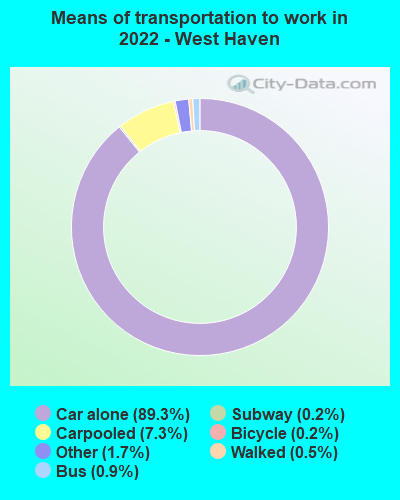
Means of transportation to work:
- Drove a car alone: 3,824 (63.2%)
- Carpooled: 356 (5.9%)
- Bus: 53 (0.9%)
- Long-distance train or commuter rail: 7 (0.1%)
- Taxi: 68 (1.1%)
- Bicycle: 10 (0.2%)
- Walked: 19 (0.3%)
- Worked at home: 1,936 (32.0%)
- Unemployment by race in 2022
- Unemployment rate for White non-Hispanic residents
- 1.6%Males
- 0.8%Females
- Unemployment rate for Asian residents
- 25.6%Males
- Unemployment rate for other race residents
- 5.2%Females
- Unemployment rate for two or more race residents
- 6.6%Males
- 4.4%Females
- Unemployment rate for Hispanic or Latino residents
- 2.5%Females
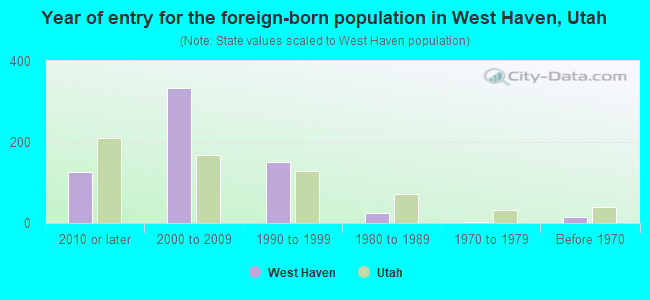
- Year of entry for the foreign-born population in West Haven, Utah
- 1272010 or later
- 3332000 to 2009
- 1501990 to 1999
- 251980 to 1989
- 31970 to 1979
- 14Before 1970
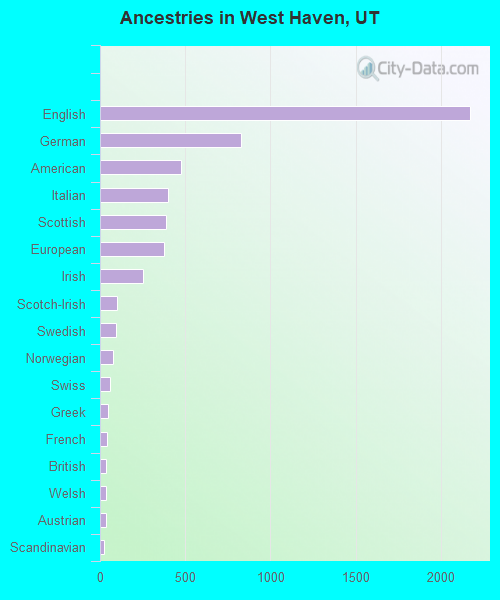
First ancestries reported:
- English: 2,173 (26.2%)
- German: 827 (10.0%)
- American: 473 (5.7%)
- Italian: 396 (4.8%)
- Scottish: 387 (4.7%)
- European: 376 (4.5%)
- Irish: 251 (3.0%)
- Scotch-Irish: 100 (1.2%)
- Swedish: 95 (1.1%)
- Norwegian: 74 (0.9%)
- Swiss: 58 (0.7%)
- Greek: 48 (0.6%)
- French: 39 (0.5%)
- British: 38 (0.5%)
- Welsh: 38 (0.5%)
- Austrian: 35 (0.4%)
- Scandinavian: 22 (0.3%)
- Danish: 15 (0.2%)
- Polish: 12 (0.1%)
- Canadian: 11 (0.1%)
- Northern European: 7 (0.08%)
- Portuguese: 6 (0.07%)
Most common places of birth for foreign-born residents (%):
| West Haven: | 47.4% (362) |
| Utah: | 36.1% (99,740) |
| West Haven: | 25.0% (191) |
| Utah: | 2.9% (8,017) |
| West Haven: | 16.6% (127) |
| Utah: | 0.5% (1,315) |
| West Haven: | 5.2% (40) |
| Utah: | 2.3% (6,468) |
| West Haven: | 5.2% (40) |
| Utah: | 2.1% (5,902) |
| West Haven: | 2.6% (20) |
| Utah: | 0.1% (217) |
| West Haven: | 2.0% (15) |
| Utah: | 0.4% (1,021) |
| West Haven: | 1.6% (12) |
| Utah: | 0.3% (893) |
Place of birth for U.S.-born residents:
- This state: 13,609
- Other state: 4,188
- Northeast: 293
- Midwest: 625
- South: 666
- West: 2,597
86.4% of West Haven residents lived in the same house 1 years ago.
Out of people who lived in different houses, 42.5% lived in this county.
Out of people who lived in different counties, 66.3% lived in Utah.
| West Haven: | 86.4% |
| State average: | 85.7% |
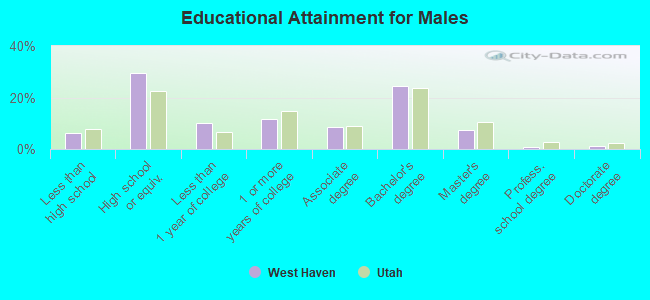
Education attainment for males 25 years and older:
- No schooling: 220
- Nursery to 4th grade: 0
- 5th and 6th grade: 0
- 7th and 8th grade: 0
- 9th grade: 0
- 10th grade: 0
- 11th grade: 0
- 12th grade, no diploma: 112
- High school graduate (or equivalency): 1,524
- Less than 1 year of college: 521
- Some college more than 1 year, no degree: 606
- Associate degree: 438
- Bachelor's degree: 1,273
- Master's degree: 382
- Professional school degree: 49
- Doctorate degree: 66
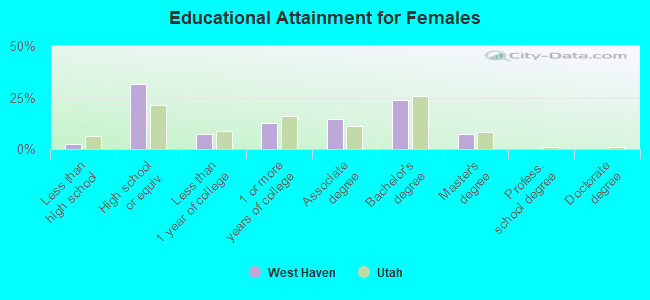
Education attainment for females 25 years and older:
- No schooling: 71
- Nursery to 4th grade: 0
- 5th and 6th grade: 0
- 7th and 8th grade: 0
- 9th grade: 0
- 10th grade: 0
- 11th grade: 9
- 12th grade, no diploma: 48
- High school graduate (or equivalency): 1,677
- Less than 1 year of college: 383
- Some college more than 1 year, no degree: 678
- Associate degree: 769
- Bachelor's degree: 1,255
- Master's degree: 398
- Professional school degree: 12
- Doctorate degree: 0
Housing units in structures:
- One, detached: 3,737
- One, attached: 476
- Two: 11
- 3 or 4: 320
- 5 to 9: 273
- 10 to 19: 416
- 20 to 49: 582
- 50 or more: 387
- Mobile homes: 36
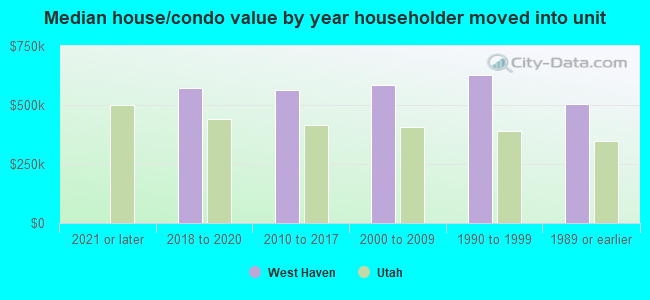
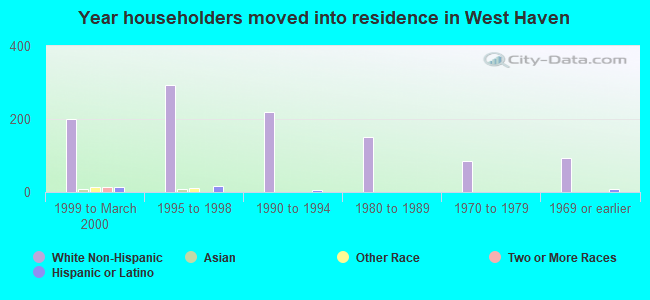
House/condo owner moved in on average 6 years ago
Renter moved in on average 1 years ago
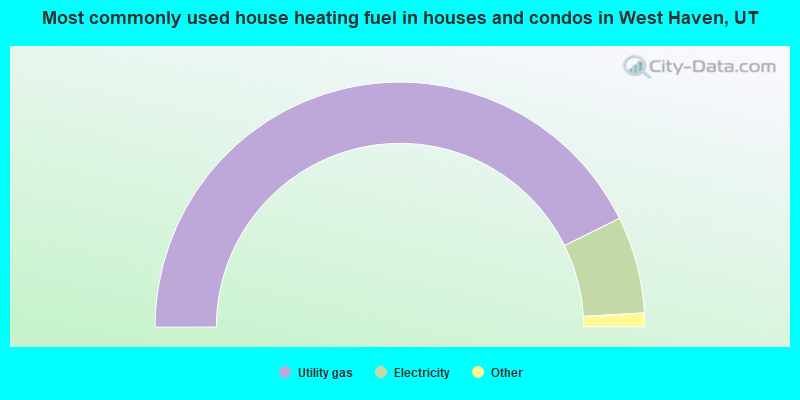
- 85.4%Utility gas
- 12.8%Electricity
- 0.9%No fuel used
- 0.9%Solar energy
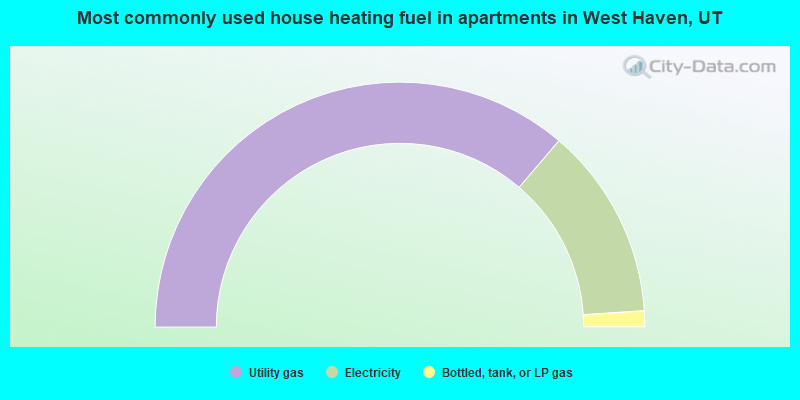
- 72.5%Utility gas
- 25.4%Electricity
- 2.1%Bottled, tank, or LP gas
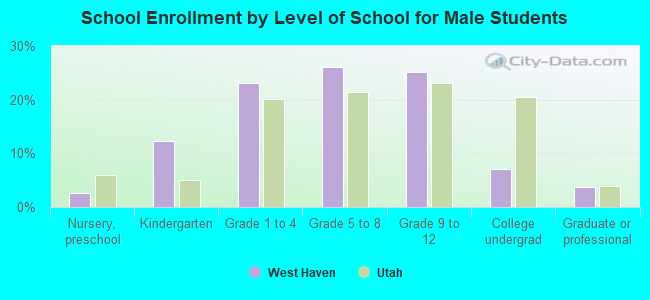
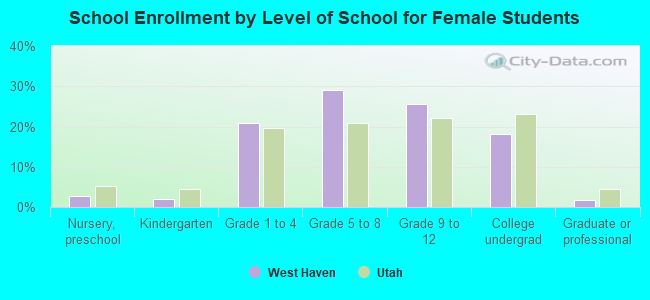
Private vs. public school enrollment:
| Here: | 2.5% |
| Utah: | 7.2% |
| Here: | 3.2% |
| Utah: | 5.3% |
| Here: | 20.4% |
| Utah: | 26.7% |