West Haven, VT (Vermont) Houses and Residents
| West Haven: | $253,625 |
| Vermont: | $304,700 |
Total population: 264 (Urban population: 0, Rural population: 276 (33 farm, 243 nonfarm))
Houses: 119 (106 occupied: 98 owner occupied, 8 renter occupied)
| % of renters here: | 8% |
| State: | 26% |
Housing density: 4 houses/condos per square mile
Median price asked for vacant for-sale houses and condos in 2022 in this county: $156,718.
Median contract rent in 2022: $399 (lower quartile is $367, upper quartile is $426)
Median rent asked for vacant for-rent units in 2022: $666
Median gross rent in West Haven, VT in 2022: $385
Housing units in West Haven with a mortgage: 13 (3 second mortgage, 0 home equity loan, 0 both second mortgage and home equity loan)
Houses without a mortgage: 3
Compare current foreclosures near West Haven, VT:
| Photo | Address | Area | Beds / Baths | Price | Details |
|---|---|---|---|---|---|

|
#1
Callahan Ln
Fort Ann, NY 12827
|
1,000 sq. feet
|
1 baths 3 beds |
$118,500
|
show details |

|
#2
Algonkin St
Ticonderoga, NY 12883
|
1,294 sq. feet
|
1 baths 3 beds |
$29,900
|
show details |

|
#3
Furnace St
Fair Haven, VT 05743
|
3,160 sq. feet
|
3 baths 7 beds |
show details | |

|
#4
County Route 43
Fort Ann, NY 12827
|
2,520 sq. feet
|
1 baths 1 beds |
show details | |

|
#5
Saunders St
Whitehall, NY 12887
|
1,500 sq. feet
|
1 baths 3 beds |
show details | |

|
#6
Mountain St
Whitehall, NY 12887
|
1,752 sq. feet
|
1 baths 3 beds |
show details | |

|
#7
Wicker St
Ticonderoga, NY 12883
|
1,009 sq. feet
|
1 baths 3 beds |
show details | |

|
#8
Pike Brook Rd
Clemons, NY 12819
|
1,976 sq. feet
|
1 baths 4 beds |
show details | |

|
#9
4th Ave
Whitehall, NY 12887
|
1,044 sq. feet
|
1 baths 2 beds |
show details | |

|
#10
Woody Ln
Ticonderoga, NY 12883
|
1,280 sq. feet
|
1 baths 3 beds |
show details |
| Photo | Address | Area | Beds / Baths | Price | Details |
|---|---|---|---|---|---|

|
#11
County Route 11
Whitehall, NY 12887
|
1,058 sq. feet
|
2 baths 3 beds |
show details | |

|
#12
Summit Dr
Hague, NY 12836
|
1,435 sq. feet
|
2 baths 3 beds |
show details | |

|
#13
Alexandria Ave
Ticonderoga, NY 12883
|
720 sq. feet
|
- baths 3 beds |
show details | |

|
#14
Cuttinghill Rd
Whiting, VT 05778
|
- sq. feet
|
- baths - beds |
show details | |

|
#15
State Route 22
Comstock, NY 12821
|
- sq. feet
|
- baths - beds |
show details | |

|
#16
N Old Route 4
Whitehall, NY 12887
|
- sq. feet
|
- baths - beds |
show details | |

|
#17
E Main St
Poultney, VT 05764
|
- sq. feet
|
- baths - beds |
show details | |

|
#18
Route 73
Orwell, VT 05760
|
- sq. feet
|
- baths - beds |
show details | |

|
#19
Vaughn St
Whitehall, NY 12887
|
- sq. feet
|
- baths - beds |
show details | |

|
#20
Champlain Ave
Whitehall, NY 12887
|
- sq. feet
|
- baths - beds |
show details |
| Photo | Address | Area | Beds / Baths | Price | Details |
|---|---|---|---|---|---|

|
#21
Castleton Meadows Ln Apt 6b
Castleton, VT 05735
|
- sq. feet
|
- baths - beds |
show details | |

|
#22
Caernarvon St
Fair Haven, VT 05743
|
- sq. feet
|
- baths - beds |
show details | |

|
#23
Belgo Rd
Castleton, VT 05735
|
- sq. feet
|
- baths - beds |
show details | |

|
#24
Stage Rd
Fair Haven, VT 05743
|
- sq. feet
|
- baths - beds |
show details | |

|
Check over 1 million property listings on Foreclosure.com!
|
browse all offers | |||

 | Kayaking Vermont -- starting from Rutland County (69 replies) |

Household type by relationship:
Households: 59,324- In family households: 46,689 (10,990 male householders, 5,028 female householders)
12,287 spouses, 14,538 children (13,423 natural, 423 adopted, 692 stepchildren), 830 grandchildren, 337 brothers or sisters, 356 parents, foster children, 341 other relatives, 1,706 non-relatives
- In nonfamily households: 12,635 (4,693 male householders (3,474 living alone)), 5,273 female householders (4,364 living alone)), 2,669 nonrelatives
- In group quarters: 2,318 (551 institutionalized population)
10,211 married couples with children.
3,525 single-parent households (877 men, 2,648 women).
91.0% of residents of West Haven speak English at home.
1.1% of residents speak Spanish at home (100% speak English very well).
7.9% of residents speak other Indo-European language at home (100% speak English very well).
Foreign born population: 13 (4.2%)
(61.5% of them are naturalized citizens)
| Here: | 5.3 |
| State: | 6.4 |
| Here: | 4.3 |
| State: | 3.9 |

- Bedrooms in owner-occupied houses and condos in West Haven, Vermont
- 0no bedroom
- 01 bedroom
- 382 bedrooms
- 423 bedrooms
- 114 bedrooms
- 75+ bedrooms

- Bedrooms in renter-occupied apartments in West Haven, Vermont
- 0no bedroom
- 21 bedroom
- 42 bedrooms
- 03 bedrooms
- 04 bedrooms
- 25+ bedrooms

- Cars and other vehicles available in West Haven in owner-occupied houses/condos
- 3no vehicle
- 231 vehicle
- 512 vehicles
- 123 vehicles
- 64 vehicles
- 35+ vehicles

- Cars and other vehicles available in West Haven in renter-occupied apartments
- 0no vehicle
- 61 vehicle
- 02 vehicles
- 03 vehicles
- 24 vehicles
- 05+ vehicles

- Rooms in owner-occupied houses in West Haven, Vermont
- 01 room
- 02 rooms
- 23 rooms
- 224 rooms
- 275 rooms
- 226 rooms
- 27 rooms
- 168 rooms
- 79+ rooms

- Rooms in renter-occupied apartments in West Haven, Vermont
- 01 room
- 22 rooms
- 03 rooms
- 24 rooms
- 25 rooms
- 06 rooms
- 07 rooms
- 08 rooms
- 29+ rooms


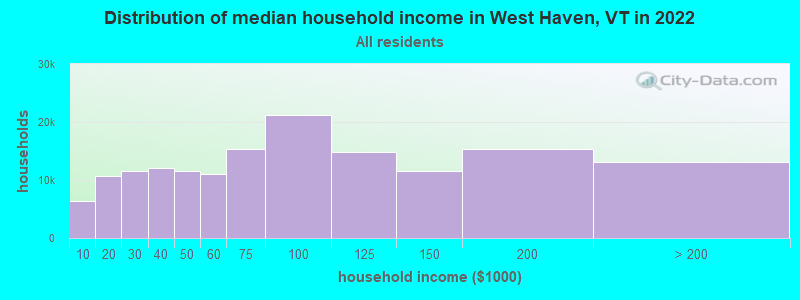
West Haven, VT household income distribution

- 5,596Less than $10,000
- 11,426$10,000 to $19,999
- 13,118$20,000 to $29,999
- 15,269$30,000 to $39,999
- 14,162$40,000 to $49,999
- 13,799$50,000 to $59,999
- 18,367$60,000 to $74,999
- 27,801$75,000 to $99,999
- 18,410$100,000 to $124,999
- 14,698$125,000 to $149,999
- 18,663$150,000 to $199,999
- 16,858$200,000 or more
Percentage of workers working in this county: 83.0%
Number of people working at home: 28 (17.0% of all workers)
Travel time to work (commute)
- Less than 5 minutes: 14
- 5 to 9 minutes: 14
- 10 to 14 minutes: 9
- 15 to 19 minutes: 14
- 20 to 24 minutes: 11
- 25 to 29 minutes: 18
- 30 to 34 minutes: 28
- 35 to 39 minutes: 8
- 40 to 44 minutes: 7
- 45 to 59 minutes: 16
- 60 to 89 minutes: 6
- 90 or more minutes: 0
Means of transportation to work:
- Drove a car alone: 117 (77.0%)
- Carpooled: 17 (11.2%)
- Walked: 11 (7.2%)
- Worked at home: 7 (4.6%)


- Year of entry for the foreign-born population in West Haven, Vermont
- 01995 to March 2000
- 01990 to 1994
- 01985 to 1989
- 01980 to 1984
- 31975 to 1979
- 21970 to 1974
- 41965 to 1969
- 3Before 1965

First ancestries reported:
- Irish: 57 (17.0%)
- English: 52 (15.5%)
- French: 46 (13.7%)
- German: 33 (9.9%)
- United States: 31 (9.3%)
- Italian: 30 (9.0%)
- Welsh: 18 (5.4%)
- Other: 17 (5.1%)
- French Canadian: 13 (3.9%)
- Dutch: 10 (3.0%)
- Scotch-Irish: 10 (3.0%)
- Danish: 7 (2.1%)
- Polish: 4 (1.2%)
- Scottish: 3 (0.9%)
- Lithuanian: 2 (0.6%)
- Russian: 2 (0.6%)
Most common places of birth for foreign-born residents (%):
| West Haven: | 58.3% (7) |
| Vermont: | 1.4% (318) |
| West Haven: | 25.0% (3) |
| Vermont: | 34.0% (7,912) |
| West Haven: | 16.7% (2) |
| Vermont: | 1.2% (268) |
Place of birth for U.S.-born residents:
- This state: 155
- Other state: 104
- Northeast: 79
- Midwest: 3
- South: 6
- West: 16
70% of West Haven residents lived in the same house 5 years ago.
Out of people who lived in different houses, 66% lived in this county.
Out of people who lived in different counties, 0% lived in Vermont.
Education attainment for males 25 years and older:
- No schooling: 0
- Nursery to 4th grade: 0
- 5th and 6th grade: 0
- 7th and 8th grade: 9
- 9th grade: 0
- 10th grade: 8
- 11th grade: 0
- 12th grade, no diploma: 5
- High school graduate (or equivalency): 35
- Less than 1 year of college: 11
- Some college more than 1 year, no degree: 13
- Associate degree: 9
- Bachelor's degree: 5
- Master's degree: 4
- Professional school degree: 0
- Doctorate degree: 0

Education attainment for females 25 years and older:
- No schooling: 0
- Nursery to 4th grade: 0
- 5th and 6th grade: 0
- 7th and 8th grade: 6
- 9th grade: 0
- 10th grade: 7
- 11th grade: 0
- 12th grade, no diploma: 0
- High school graduate (or equivalency): 42
- Less than 1 year of college: 6
- Some college more than 1 year, no degree: 5
- Associate degree: 8
- Bachelor's degree: 21
- Master's degree: 7
- Professional school degree: 3
- Doctorate degree: 0


Housing units in structures:
- One, detached: 89
- 3 or 4: 6
- 10 to 19: 2
- Mobile homes: 22
Median worth of mobile homes: $113,910
Housing units lacking complete kitchen facilities: 4.2%

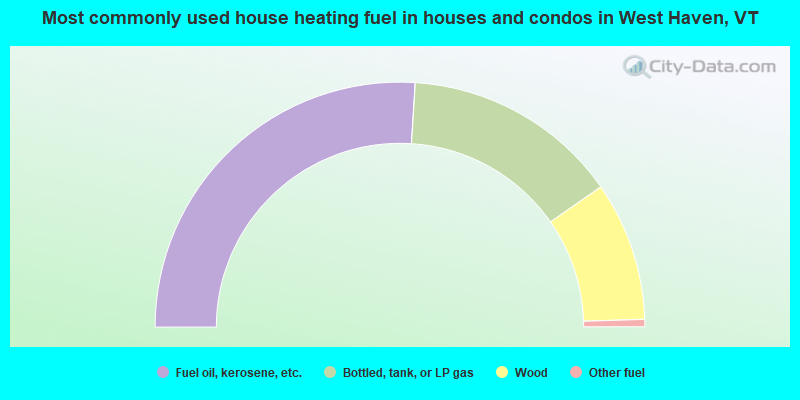
- 52.0%Fuel oil, kerosene, etc.
- 28.6%Bottled, tank, or LP gas
- 18.4%Wood
- 1.0%Other fuel
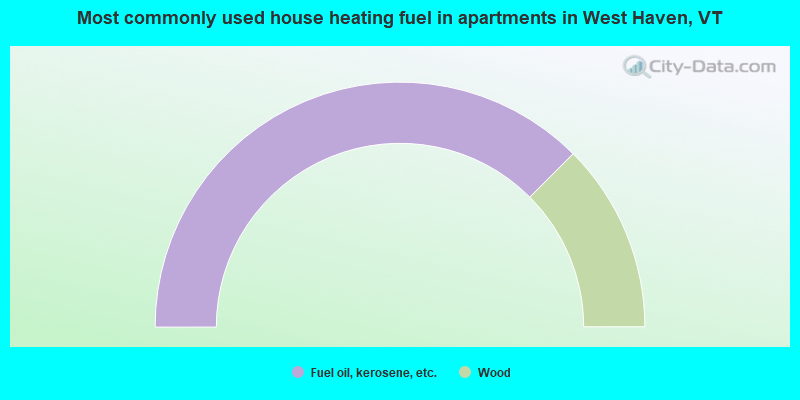
- 75.0%Fuel oil, kerosene, etc.
- 25.0%Wood
Private vs. public school enrollment:
| Here: | 0.0% |
| Vermont: | 7.2% |
| Here: | 0.0% |
| Vermont: | 10.4% |


