West Norriton, PA (Pennsylvania) Houses and Residents
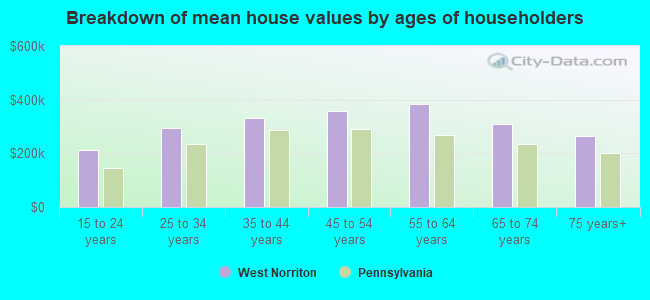
| West Norriton: | $335,628 |
| Pennsylvania: | $245,500 |
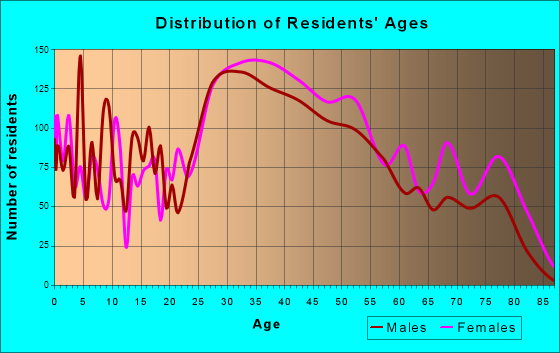
Total population: 15,390 (Urban population: 14,901, Rural population: 0)
Houses: 6,889 (6,614 occupied: 4,765 owner occupied, 1,849 renter occupied)
| % of renters here: | 28% |
| State: | 31% |
Housing density: 1,176 houses/condos per square mile
Median price asked for vacant for-sale houses and condos in 2022 in this county: $277,563.
Median contract rent in 2022: $1,514 (lower quartile is $1,126, upper quartile is $1,795)
Median rent asked for vacant for-rent units in 2022: $1,621
Median gross rent in West Norriton, PA in 2022: $1,720
Housing units in West Norriton with a mortgage: 3,186 (239 second mortgage, 443 home equity loan, 17 both second mortgage and home equity loan)
Houses without a mortgage: 1,102
Compare current foreclosures near West Norriton, PA:
| Photo | Address | Area | Beds / Baths | Price | Details |
|---|---|---|---|---|---|

|
#1
Ashbourne Rd
Elkins Park, PA 19027
|
3,104 sq. feet
|
3 baths 6 beds |
$154,500
|
show details |

|
#2
Manchester Rd
Elkins Park, PA 19027
|
3,444 sq. feet
|
2 baths 3 beds |
$559,900
|
show details |

|
#3
Yeadon Ave
Lansdowne, PA 19050
|
1,388 sq. feet
|
1 baths 3 beds |
$273,000
|
show details |

|
#4
Christian St
Philadelphia, PA 19146
|
1,612 sq. feet
|
2 baths 5 beds |
$449,900
|
show details |

|
#5
W Oakdale Street
Philadelphia, PA 19132
|
1,152 sq. feet
|
2 baths 3 beds |
$108,900
|
show details |

|
#6
N 5th St
Philadelphia, PA 19126
|
1,420 sq. feet
|
2 baths 3 beds |
$313,900
|
show details |

|
#7
N Parkview Dr
Norristown, PA 19403
|
2,602 sq. feet
|
2 baths 4 beds |
$240,000
|
show details |

|
#8
Snyder Rd
Green Lane, PA 18054
|
1,950 sq. feet
|
1 baths 3 beds |
$449,900
|
show details |

|
#9
W Olney Ave
Philadelphia, PA 19120
|
1,782 sq. feet
|
2 baths 4 beds |
$112,500
|
show details |

|
#10
N 59th St
Philadelphia, PA 19151
|
1,244 sq. feet
|
1 baths 3 beds |
$241,500
|
show details |
| Photo | Address | Area | Beds / Baths | Price | Details |
|---|---|---|---|---|---|

|
#11
Kershaw St
Philadelphia, PA 19131
|
1,284 sq. feet
|
1 baths 3 beds |
$139,900
|
show details |

|
#12
Valley Dr
West Chester, PA 19382
|
945 sq. feet
|
1 baths 2 beds |
$26,649
|
show details |

|
#13
Gwynedd Ct
Exton, PA 19341
|
1,760 sq. feet
|
2 baths 3 beds |
$296,451
|
show details |

|
#14
Richmond Rd
Paoli, PA 19301
|
1,706 sq. feet
|
2 baths 2 beds |
$179,198
|
show details |

|
#15
Woodside Ave
Berwyn, PA 19312
|
2,080 sq. feet
|
2 baths 5 beds |
$525,082
|
show details |

|
#16
Glen Ave
West Chester, PA 19382
|
1,240 sq. feet
|
1 baths 3 beds |
$218,966
|
show details |

|
#17
E Miner St
West Chester, PA 19382
|
2,018 sq. feet
|
2 baths 5 beds |
$201,786
|
show details |

|
#18
Bowman Ave
West Chester, PA 19380
|
1,031 sq. feet
|
1 baths 3 beds |
$159,163
|
show details |

|
#19
E Rittenhouse St
Philadelphia, PA 19138
|
1,614 sq. feet
|
1 baths 3 beds |
$114,894
|
show details |

|
#20
Hoffecker Rd
Phoenixville, PA 19460
|
1,260 sq. feet
|
2 baths 3 beds |
$217,558
|
show details |
| Photo | Address | Area | Beds / Baths | Price | Details |
|---|---|---|---|---|---|

|
#21
2nd Ave
Phoenixville, PA 19460
|
1,120 sq. feet
|
1 baths 3 beds |
$39,472
|
show details |

|
#22
Gulph Rd
Wayne, PA 19087
|
3,262 sq. feet
|
2 baths 4 beds |
$651,481
|
show details |

|
#23
Mulberry St
Chester Springs, PA 19425
|
6,298 sq. feet
|
5 baths 5 beds |
$619,328
|
show details |

|
#24
Cornelius St
Philadelphia, PA 19138
|
1,166 sq. feet
|
1 baths 3 beds |
$118,648
|
show details |

|
#25
New Market Ct
Wayne, PA 19087
|
1,080 sq. feet
|
1 baths 2 beds |
$98,656
|
show details |

|
#26
W Oakdale St
Philadelphia, PA 19132
|
1,134 sq. feet
|
1 baths 3 beds |
$1,322,645
|
show details |

|
#27
Westtown Cir
West Chester, PA 19382
|
1,437 sq. feet
|
1 baths 1 beds |
$116,753
|
show details |

|
#28
W Central Ave
Paoli, PA 19301
|
1,939 sq. feet
|
2 baths 4 beds |
$438,947
|
show details |

|
#29
67th Ave
Philadelphia, PA 19138
|
1,146 sq. feet
|
1 baths 3 beds |
$8,900
|
show details |

|
#30
Pennlane
West Chester, PA 19382
|
1,476 sq. feet
|
1 baths 3 beds |
$470,297
|
show details |
| Photo | Address | Area | Beds / Baths | Price | Details |
|---|---|---|---|---|---|

|
#31
Oxford Rd
West Chester, PA 19380
|
2,116 sq. feet
|
2 baths 4 beds |
$173,254
|
show details |

|
#32
Marie Rd
West Chester, PA 19380
|
3,184 sq. feet
|
3 baths 5 beds |
$561,314
|
show details |

|
#33
Presidential Blvd Unit 915b
Bala Cynwyd, PA 19004
|
579 sq. feet
|
1 baths 1 beds |
$104,531
|
show details |

|
#34
South St
Phoenixville, PA 19460
|
1,568 sq. feet
|
1 baths 3 beds |
$178,971
|
show details |

|
#35
Bridge St
Spring City, PA 19475
|
1,686 sq. feet
|
3 baths 3 beds |
$252,371
|
show details |

|
#36
Coventry Ln
West Chester, PA 19382
|
1,580 sq. feet
|
2 baths 3 beds |
$205,686
|
show details |

|
#37
Keenan St
Elkins Park, PA 19027
|
1,234 sq. feet
|
2 baths 2 beds |
$217,220
|
show details |

|
#38
Manley Rd
West Chester, PA 19380
|
1,295 sq. feet
|
1 baths 2 beds |
$238,547
|
show details |

|
#39
Shady Brook Ln
Malvern, PA 19355
|
3,974 sq. feet
|
3 baths 4 beds |
$185,445
|
show details |

|
#40
Ridge Rd
Spring City, PA 19475
|
1,456 sq. feet
|
2 baths 3 beds |
$235,715
|
show details |
| Photo | Address | Area | Beds / Baths | Price | Details |
|---|---|---|---|---|---|

|
#41
Lewisville Ct
Phoenixville, PA 19460
|
1,605 sq. feet
|
2 baths 2 beds |
$51,546
|
show details |

|
#42
Hopkinson Ct # 160
Wayne, PA 19087
|
1,656 sq. feet
|
2 baths 2 beds |
$214,896
|
show details |

|
#43
Grove Rd
West Chester, PA 19380
|
875 sq. feet
|
1 baths 3 beds |
$19,782
|
show details |

|
#44
Valley Dr
West Chester, PA 19382
|
945 sq. feet
|
1 baths 2 beds |
$103,336
|
show details |

|
#45
Josephs Way
Malvern, PA 19355
|
1,853 sq. feet
|
2 baths 3 beds |
$128,821
|
show details |

|
#46
N Newkirk St
Philadelphia, PA 19132
|
960 sq. feet
|
1 baths 3 beds |
$1,128,765
|
show details |

|
#47
N Bambrey St
Philadelphia, PA 19121
|
964 sq. feet
|
1 baths 3 beds |
$107,333
|
show details |

|
#48
L Fleur
Devon, PA 19333
|
1,412 sq. feet
|
1 baths 2 beds |
$50,690
|
show details |

|
#49
E Strasburg Rd
West Chester, PA 19380
|
4,204 sq. feet
|
3 baths 3 beds |
$668,955
|
show details |

|
Check over 1 million property listings on Foreclosure.com!
|
browse all offers | |||

 | West Norriton condos (1 reply) |
| Bungalo-Style Homes in Philadelphia (9 replies) |
| Affordable "small" towns with beautiful houses and downtowns? (58 replies) |
| The Future of Norristown (105 replies) |
| Best Philadelphia Suburb (38 replies) |
| Need help on where to live in Philly Suburbs (11 replies) |
Household type by relationship:
Households: 778,868- In family households: 657,689 (153,043 male householders, 55,916 female householders)
168,592 spouses, 232,658 children (220,132 natural, 5,731 adopted, 6,795 stepchildren), 10,517 grandchildren, 5,677 brothers or sisters, 7,198 parents, foster children, 6,750 other relatives, 12,236 non-relatives
- In nonfamily households: 121,179 (42,162 male householders (32,252 living alone)), 56,629 female householders (48,629 living alone)), 22,388 nonrelatives
- In group quarters: 21,006 (13,115 institutionalized population)
143,178 married couples with children.
26,552 single-parent households (5,856 men, 20,696 women).
91.9% of residents of West Norriton speak English at home.
2.0% of residents speak Spanish at home (76% speak English very well, 8% speak English well, 7% speak English not well, 8% don't speak English at all).
4.7% of residents speak other Indo-European language at home (69% speak English very well, 14% speak English well, 16% speak English not well, 1% don't speak English at all).
1.4% of residents speak Asian or Pacific Island language at home (68% speak English very well, 24% speak English well, 9% speak English not well).
Foreign born population: 1,415 (8.2%)
(66.2% of them are naturalized citizens)
| Here: | 6.4 |
| State: | 6.8 |
| Here: | 4.0 |
| State: | 4.3 |
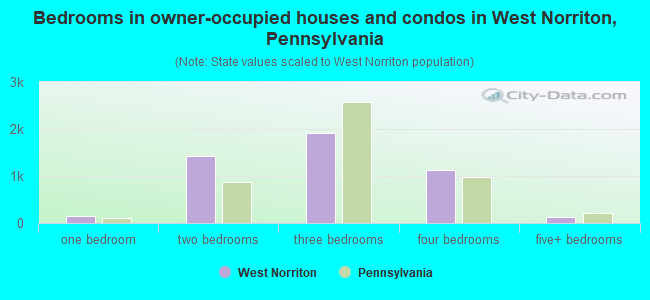
- Bedrooms in owner-occupied houses and condos in West Norriton, Pennsylvania
- 9no bedroom
- 1491 bedroom
- 1,4342 bedrooms
- 1,9233 bedrooms
- 1,1184 bedrooms
- 1325+ bedrooms
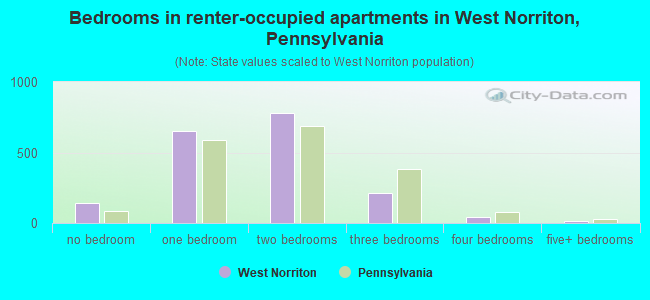
- Bedrooms in renter-occupied apartments in West Norriton, Pennsylvania
- 143no bedroom
- 6561 bedroom
- 7772 bedrooms
- 2153 bedrooms
- 444 bedrooms
- 145+ bedrooms
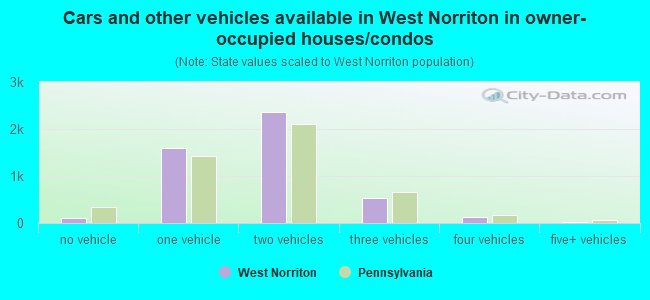
- Cars and other vehicles available in West Norriton in owner-occupied houses/condos
- 109no vehicle
- 1,6041 vehicle
- 2,3712 vehicles
- 5253 vehicles
- 1314 vehicles
- 255+ vehicles
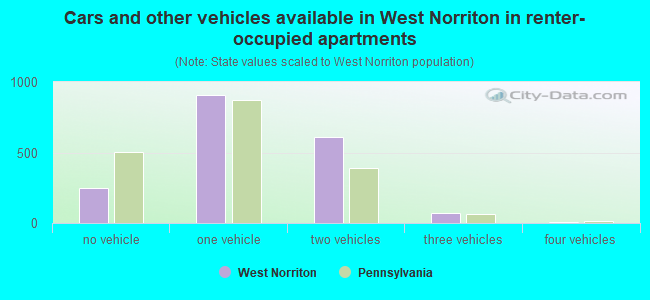
- Cars and other vehicles available in West Norriton in renter-occupied apartments
- 250no vehicle
- 9101 vehicle
- 6092 vehicles
- 703 vehicles
- 104 vehicles
- 05+ vehicles
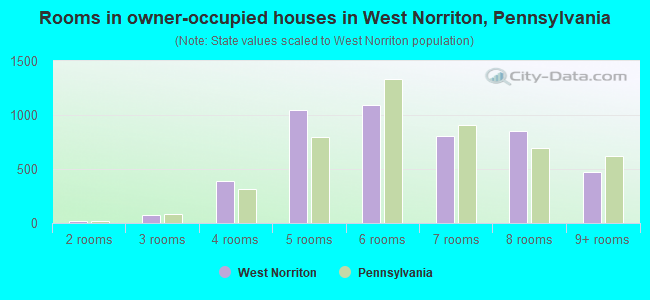
- Rooms in owner-occupied houses in West Norriton, Pennsylvania
- 91 room
- 222 rooms
- 753 rooms
- 3894 rooms
- 1,0495 rooms
- 1,0946 rooms
- 8027 rooms
- 8548 rooms
- 4719+ rooms
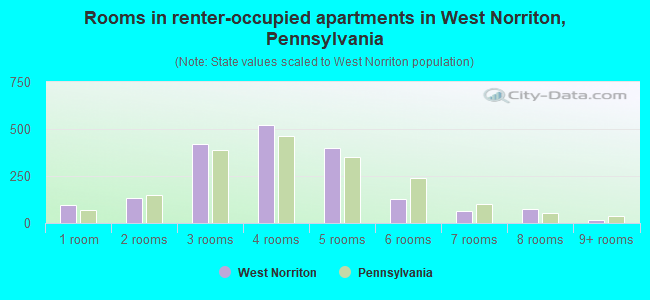
- Rooms in renter-occupied apartments in West Norriton, Pennsylvania
- 961 room
- 1342 rooms
- 4183 rooms
- 5224 rooms
- 4005 rooms
- 1286 rooms
- 657 rooms
- 728 rooms
- 149+ rooms
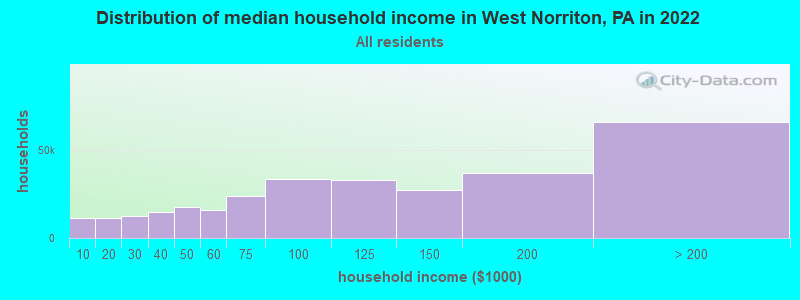
West Norriton, PA household income distribution

- 11,465Less than $10,000
- 11,442$10,000 to $19,999
- 12,579$20,000 to $29,999
- 14,950$30,000 to $39,999
- 17,402$40,000 to $49,999
- 15,632$50,000 to $59,999
- 24,000$60,000 to $74,999
- 33,388$75,000 to $99,999
- 33,117$100,000 to $124,999
- 26,941$125,000 to $149,999
- 36,869$150,000 to $199,999
- 65,785$200,000 or more
Percentage of workers working in this county: 83.4%
Number of people working at home: 2,337 (23.4% of all workers)
Travel time to work (commute)
- Less than 5 minutes: 95
- 5 to 9 minutes: 681
- 10 to 14 minutes: 1,072
- 15 to 19 minutes: 1,325
- 20 to 24 minutes: 1,518
- 25 to 29 minutes: 555
- 30 to 34 minutes: 1,010
- 35 to 39 minutes: 200
- 40 to 44 minutes: 330
- 45 to 59 minutes: 786
- 60 to 89 minutes: 428
- 90 or more minutes: 170
Means of transportation to work:
- Drove a car alone: 7,112 (84.8%)
- Carpooled: 661 (7.9%)
- Bus or trolley bus: 96 (1.1%)
- Subway or elevated: 7 (0.1%)
- Railroad: 149 (1.8%)
- Walked: 99 (1.2%)
- Other means: 46 (0.5%)
- Worked at home: 214 (2.6%)
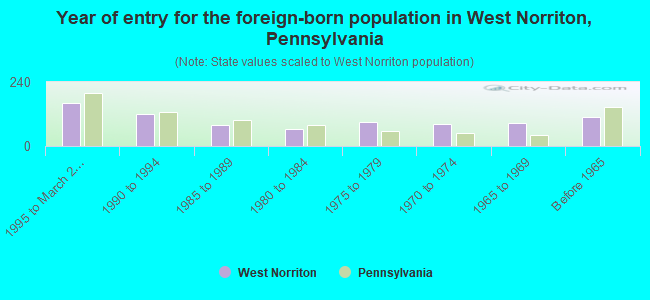
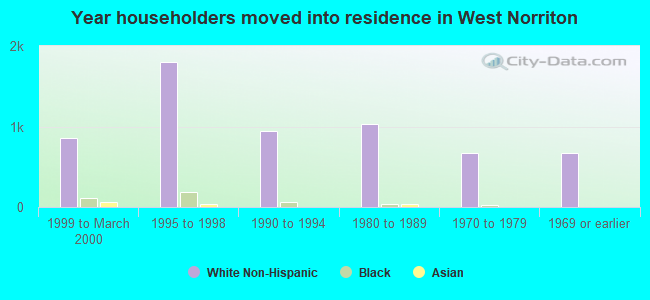
- Year of entry for the foreign-born population in West Norriton, Pennsylvania
- 1631995 to March 2000
- 1201990 to 1994
- 771985 to 1989
- 631980 to 1984
- 901975 to 1979
- 841970 to 1974
- 851965 to 1969
- 108Before 1965
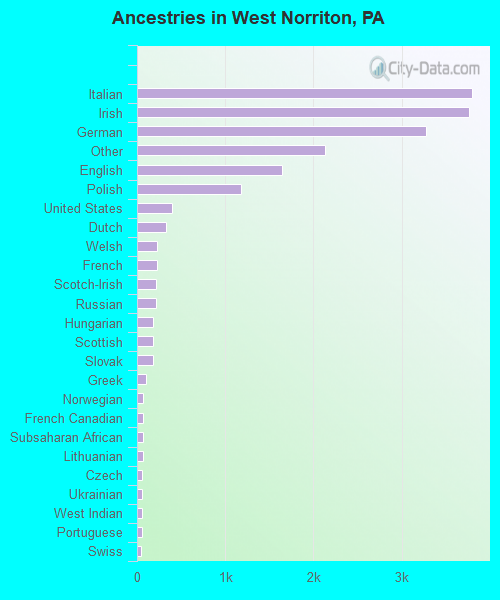
First ancestries reported:
- Italian: 3,802 (20.3%)
- Irish: 3,765 (20.1%)
- German: 3,279 (17.5%)
- Other: 2,132 (11.4%)
- English: 1,647 (8.8%)
- Polish: 1,184 (6.3%)
- United States: 402 (2.1%)
- Dutch: 328 (1.8%)
- Welsh: 228 (1.2%)
- French: 223 (1.2%)
- Scotch-Irish: 218 (1.2%)
- Russian: 213 (1.1%)
- Hungarian: 185 (1.0%)
- Scottish: 184 (1.0%)
- Slovak: 179 (1.0%)
- Greek: 104 (0.6%)
- Norwegian: 73 (0.4%)
- French Canadian: 71 (0.4%)
- Subsaharan African: 70 (0.4%)
- Lithuanian: 63 (0.3%)
- Czech: 61 (0.3%)
- Ukrainian: 61 (0.3%)
- West Indian: 61 (0.3%)
- Portuguese: 53 (0.3%)
- Swiss: 49 (0.3%)
- Swedish: 47 (0.3%)
- Danish: 28 (0.1%)
- Arab: 27 (0.1%)
Most common places of birth for foreign-born residents (%):
| West Norriton: | 13.0% (103) |
| Pennsylvania: | 7.4% (37,541) |
| West Norriton: | 12.5% (99) |
| Pennsylvania: | 6.0% (30,559) |
| West Norriton: | 11.1% (88) |
| Pennsylvania: | 4.6% (23,171) |
| West Norriton: | 8.9% (70) |
| Pennsylvania: | 2.2% (11,411) |
| West Norriton: | 4.8% (38) |
| Pennsylvania: | 0.4% (2,237) |
| West Norriton: | 4.3% (34) |
| Pennsylvania: | 0.9% (4,480) |
| West Norriton: | 3.9% (31) |
| Pennsylvania: | 5.1% (25,685) |
| West Norriton: | 3.5% (28) |
| Pennsylvania: | 2.3% (11,916) |
| West Norriton: | 3.0% (24) |
| Pennsylvania: | 5.3% (26,703) |
| West Norriton: | 2.7% (21) |
| Pennsylvania: | 0.3% (1,406) |
| West Norriton: | 2.5% (20) |
| Pennsylvania: | 1.4% (7,362) |
| West Norriton: | 2.5% (20) |
| Pennsylvania: | 4.6% (23,478) |
| West Norriton: | 2.4% (19) |
| Pennsylvania: | 3.0% (15,200) |
| West Norriton: | 2.3% (18) |
| Pennsylvania: | 2.7% (13,885) |
| West Norriton: | 2.0% (16) |
| Pennsylvania: | 1.2% (5,852) |
| West Norriton: | 1.9% (15) |
| Pennsylvania: | 0.8% (3,914) |
| West Norriton: | 1.9% (15) |
| Pennsylvania: | 2.4% (12,390) |
| West Norriton: | 1.8% (14) |
| Pennsylvania: | 0.7% (3,762) |
| West Norriton: | 1.6% (13) |
| Pennsylvania: | 1.3% (6,687) |
Place of birth for U.S.-born residents:
- This state: 11,839
- Other state: 2,154
- Northeast: 979
- Midwest: 397
- South: 684
- West: 94
57% of West Norriton residents lived in the same house 5 years ago.
Out of people who lived in different houses, 63% lived in this county.
Out of people who lived in different counties, 75% lived in Pennsylvania.
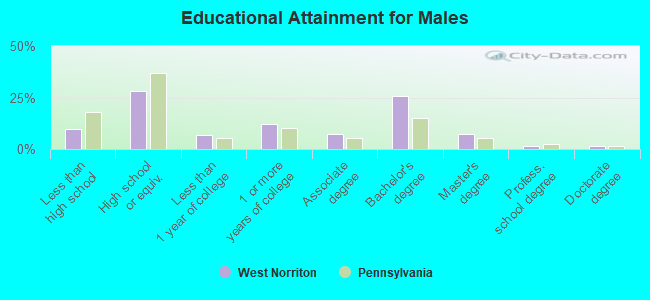
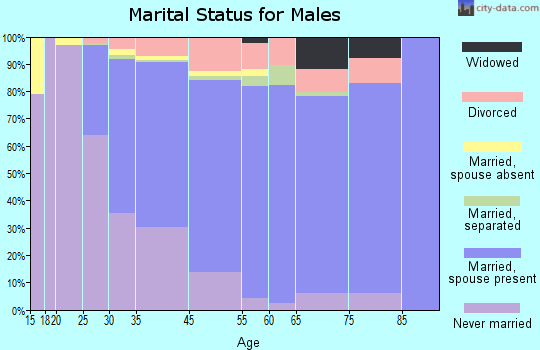
Education attainment for males 25 years and older:
- No schooling: 7
- Nursery to 4th grade: 15
- 5th and 6th grade: 6
- 7th and 8th grade: 34
- 9th grade: 99
- 10th grade: 93
- 11th grade: 58
- 12th grade, no diploma: 175
- High school graduate (or equivalency): 1,451
- Less than 1 year of college: 353
- Some college more than 1 year, no degree: 629
- Associate degree: 366
- Bachelor's degree: 1,331
- Master's degree: 381
- Professional school degree: 80
- Doctorate degree: 65
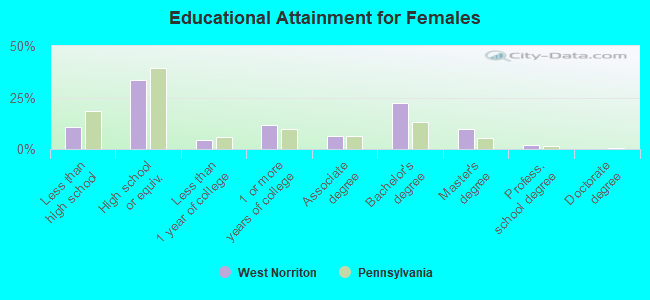
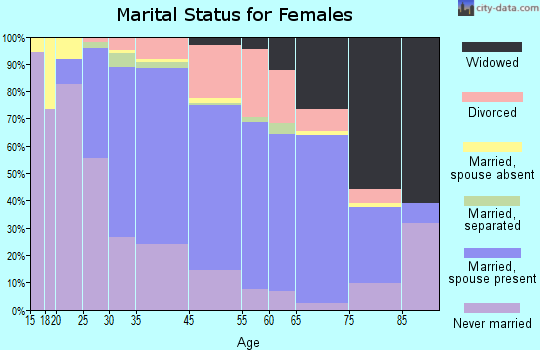
Education attainment for females 25 years and older:
- No schooling: 27
- Nursery to 4th grade: 18
- 5th and 6th grade: 7
- 7th and 8th grade: 83
- 9th grade: 90
- 10th grade: 165
- 11th grade: 132
- 12th grade, no diploma: 118
- High school graduate (or equivalency): 2,007
- Less than 1 year of college: 256
- Some college more than 1 year, no degree: 689
- Associate degree: 379
- Bachelor's degree: 1,331
- Master's degree: 584
- Professional school degree: 123
- Doctorate degree: 0
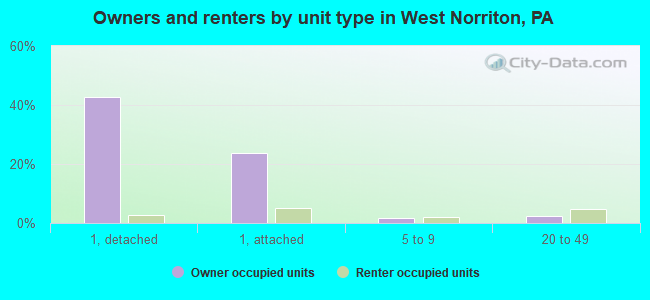
Housing units in structures:
- One, detached: 3,071
- One, attached: 1,960
- Two: 116
- 3 or 4: 346
- 5 to 9: 263
- 10 to 19: 188
- 20 to 49: 563
- 50 or more: 367
- Mobile homes: 6
- Boats, RVs, vans, etc.: 9
Median worth of mobile homes: $329,367
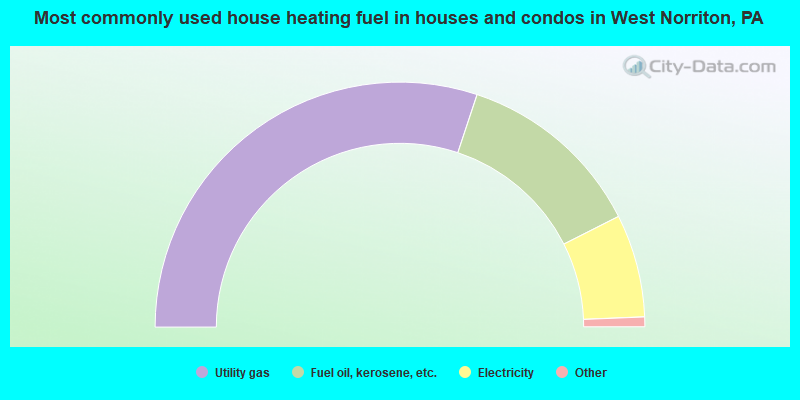
- 60.2%Utility gas
- 24.9%Fuel oil, kerosene, etc.
- 13.6%Electricity
- 0.9%Bottled, tank, or LP gas
- 0.1%Coal or coke
- 0.1%Wood
- 0.1%Other fuel
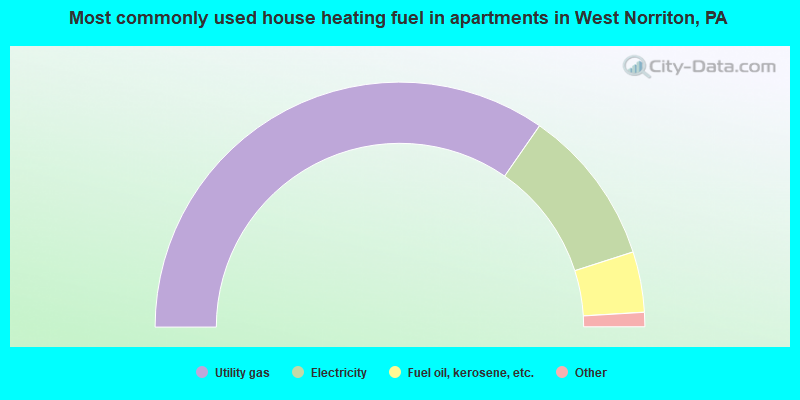
- 69.3%Utility gas
- 20.8%Electricity
- 8.0%Fuel oil, kerosene, etc.
- 1.5%Bottled, tank, or LP gas
- 0.4%Other fuel
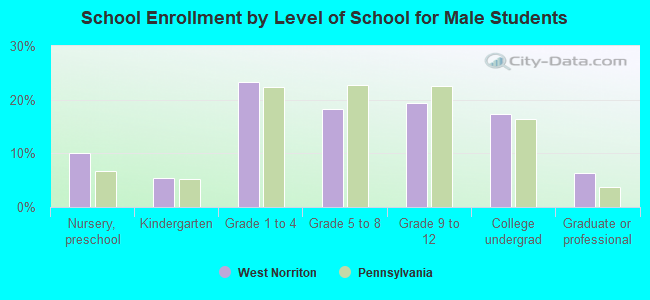
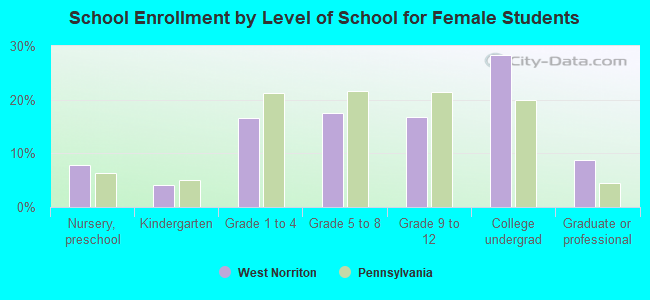
Private vs. public school enrollment:
| Here: | 41.5% |
| Pennsylvania: | 16.0% |
| Here: | 27.2% |
| Pennsylvania: | 13.1% |
| Here: | 48.0% |
| Pennsylvania: | 37.3% |