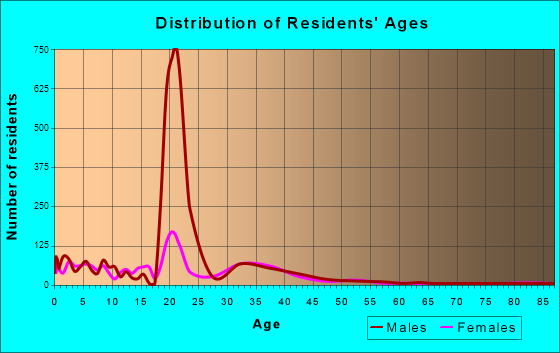
West Point, NY (New York) Houses and Residents
Estimated median house or condo value in 2022: over $-733,372,804 (it was over $1,000,000 in 2000 )
West Point : New York :
Lower value quartile - upper value quartile: $0 - $0Total population: 6,763 (All urban)
Houses: 1,248 (1,082 occupied: 0 owner occupied, 1,099 renter occupied )
% of renters here:
100%State:
46%
Housing density: 51 houses/condos per square mile
Median price asked for vacant for-sale houses and condos in 2022 in this county: $283,793.
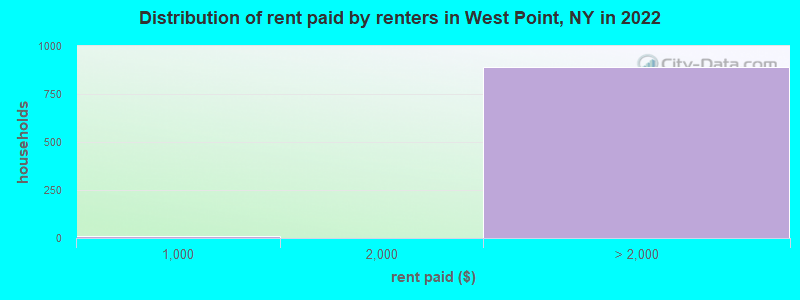
Median contract rent in 2022: over $2,000 (lower quartile is over $2,000, upper quartile is over $2,000)
Median gross rent in West Point, NY in 2022: over $2,000
Housing units in West Point with a mortgage: 0 (0 second mortgage, 0 home equity loan, 0 both second mortgage and home equity loan )Houses without a mortgage: 0
Data:
Median house or condo value ($)
Median house or condo value ($ change since 2000)
Median house or condo value ($) - White
Median house or condo value ($) - Black or African American
Median house or condo value ($) - Asian
Median house or condo value ($) - Hispanic or Latino
Median house or condo value ($) - American Indian and Alaska Native
Median house or condo value ($) - Multirace
Median house or condo value ($) - Other Race
Median price asked for mobile homes ($)
Household density (households per square mile)
Mean house or condo value by units in structure - 1, detached ($)
Mean house or condo value by units in structure - 1, attached ($)
Mean house or condo value by units in structure - 2 ($)
Mean house or condo value by units in structure by units in structure - 3 or 4 ($)
Mean house or condo value by units in structure - 5 or more ($)
Mean house or condo value by units in structure - Boat, RV, van, etc. ($)
Mean house or condo value by units in structure - Mobile home ($)
Median contract rent ($)
Median contract rent - Lower quartile ($)
Median contract rent - Upper quartile ($)
Median gross rent ($)
Urban houses (%)
Rural houses (%)
Houses occupied (%)
Houses occupied (% change since 2000)
Houses owner occupied (%)
Houses owner occupied (% change since 2000)
Houses renter occupied (%)
Houses renter occupied (% change since 2000)
Vacant housing units - For rent (%)
Vacant housing units - For rent (% change since 2000)
Vacant housing units - For sale only (%)
Vacant housing units - For sale only (% change since 2000)
Vacant housing units - Rented or sold, not occupied (%)
Vacant housing units - Rented or sold, not occupied (% change since 2000)
Vacant housing units - For seasonal, recreational, or occasional use (%)
Vacant housing units - For seasonal, recreational, or occasional use (% change since 2000)
Vacant housing units - For migrant workers (%)
Vacant housing units - For migrant workers (% change since 2000)
Vacant housing units - Other vacant (%)
Vacant housing units - Other vacant (% change since 2000)
Median monthly housing costs ($)
Median household income for houses/condos with a mortgage ($)
Median household income for houses/condos without a mortgage ($)
Median household income ($)
Median household income ($) - White
Median household income ($) - Black or African American
Median household income ($) - Asian
Median household income ($) - Hispanic or Latino
Median household income ($) - American Indian and Alaska Native
Median household income ($) - Multirace
Median household income ($) - Other Race
Mortgage status - with mortgage (%)
Mortgage status - with second mortgage (%)
Mortgage status - with home equity loan (%)
Mortgage status - with both second mortgage and home equity loan (%)
Mortgage status - without a mortgage (%)
Median year house/condo built
Median year apartment built
Household type by relationship - Male householder living alone (%)
Household type by relationship - Male householder not living alone (%)
Household type by relationship - Female householder living alone (%)
Household type by relationship - Female householder not living alone (%)
Household type by relationship - Opposite-Sex spouse (%)
Household type by relationship - Same-Sex spouse (%)
Household type by relationship - Opposite-Sex unmarried partner (%)
Household type by relationship - Same-Sex unmarried partner (%)
Household type by relationship - In group quarters (%)
Size of family households - 2-person household (%)
Size of family households - 3-person household (%)
Size of family households - 4-person household (%)
Size of family households - 5-person household (%)
Size of family households - 6-person household (%)
Size of family households - 7-or-more-person household (%)
Size of nonfamily households - 1-person household (%)
Size of nonfamily households - 2-person household (%)
Size of nonfamily households - 3-person household (%)
Size of nonfamily households - 4-person household (%)
Size of nonfamily households - 5-person household (%)
Size of nonfamily households - 6-person household (%)
Size of nonfamily households - 7-or-moreperson household (%)
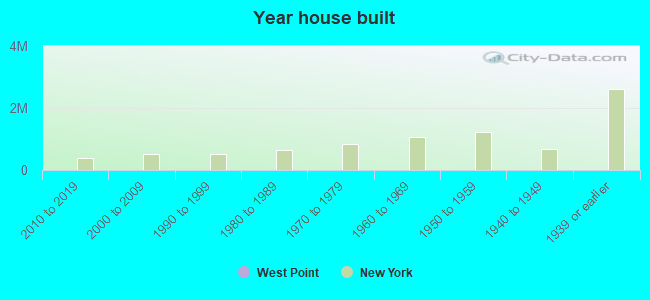
Year house built - Built 2010 or later (%)
Year house built - Built 2000 to 2009 (%)
Year house built - Built 1990 to 1999 (%)
Year house built - Built 1980 to 1989 (%)
Year house built - Built 1970 to 1979 (%)
Year house built - Built 1960 to 1969 (%)
Year house built - Built 1950 to 1959 (%)
Year house built - Built 1940 to 1949 (%)
Year house built - Built 1939 or earlier (%)
Median number of rooms in houses and condos
Median number of rooms in apartments
Median number of bedrooms in owner occupied houses
Mean number of bedrooms in owner occupied houses
Median number of bedrooms in renter occupied houses
Mean number of bedrooms in renter occupied houses
Median number of vehichles in owner occupied houses
Mean number of vehichles in owner occupied houses
Median number of vehichles in renter occupied houses
Mean number of vehichles in renter occupied houses
Rooms in owner-occupied houses - 1 room (%)
Rooms in owner-occupied houses - 2 rooms (%)
Rooms in owner-occupied houses - 3 rooms (%)
Rooms in owner-occupied houses - 4 rooms (%)
Rooms in owner-occupied houses - 5 rooms (%)
Rooms in owner-occupied houses - 6 rooms (%)
Rooms in owner-occupied houses - 7 rooms (%)
Rooms in owner-occupied houses - 8 rooms (%)
Rooms in owner-occupied houses - 9+ rooms (%)
Rooms in renter-occupied houses - 1 room (%)
Rooms in renter-occupied houses - 2 rooms (%)
Rooms in renter-occupied houses - 3 rooms (%)
Rooms in renter-occupied houses - 4 rooms (%)
Rooms in renter-occupied houses - 5 rooms (%)
Rooms in renter-occupied houses - 6 rooms (%)
Rooms in renter-occupied houses - 7 rooms (%)
Rooms in renter-occupied houses - 8 rooms (%)
Rooms in renter-occupied houses - 9+ rooms (%)
Bedrooms in owner-occupied houses - no bedrooms (%)
Bedrooms in owner-occupied houses - 1 bedroom (%)
Bedrooms in owner-occupied houses - 2 bedrooms (%)
Bedrooms in owner-occupied houses - 3 bedrooms (%)
Bedrooms in owner-occupied houses - 4 bedrooms (%)
Bedrooms in owner-occupied houses - 5+ bedrooms (%)
Bedrooms in renter-occupied houses - no bedrooms (%)
Bedrooms in renter-occupied houses - 1 bedroom (%)
Bedrooms in renter-occupied houses - 2 bedrooms (%)
Bedrooms in renter-occupied houses - 3 bedrooms (%)
Bedrooms in renter-occupied houses - 4 bedrooms (%)
Bedrooms in renter-occupied houses - 5+ bedrooms (%)
Vehicles available in owner-occupied houses - no vehicle available (%)
Vehicles available in owner-occupied houses - 1 vehicle available(%)
Vehicles available in owner-occupied houses - 2 Vehicles available (%)
Vehicles available in owner-occupied houses - 3 Vehicles available (%)
Vehicles available in owner-occupied houses - 4 Vehicles available (%)
Vehicles available in owner-occupied houses - 5+ Vehicles available (%)
Vehicles available in renter-occupied houses - no vehicle available (%)
Vehicles available in renter-occupied houses - 1 vehicle available (%)
Vehicles available in renter-occupied houses - 2 Vehicles available (%)
Vehicles available in renter-occupied houses - 3 Vehicles available (%)
Vehicles available in renter-occupied houses - 4 Vehicles available (%)
Vehicles available in renter-occupied houses - 5+ Vehicles available (%)
Housing units in structures - 1, detached (%)
Housing units in structures - 1, attached (%)
Housing units in structures - 2 (%)
Housing units in structures - 3 or 4 (%)
Housing units in structures - 5 to 9 (%)
Housing units in structures - 10 to 19 (%)
Housing units in structures - 20 to 49 (%)
Housing units in structures - 50 or more (%)
Housing units in structures - Mobile home (%)
Housing units in structures - Boat, RV, van, etc. (%)
Housing units in structures - Owners - 1, detached (%)
Housing units in structures - Owners - 1, attached (%)
Housing units in structures - Owners - 2 (%)
Housing units in structures - Owners - 3 or 4 (%)
Housing units in structures - Owners - 5 to 9 (%)
Housing units in structures - Owners - 10 to 19 (%)
Housing units in structures - Owners - 20 to 49 (%)
Housing units in structures - Owners - 50 or more (%)
Housing units in structures - Owners - Mobile home (%)
Housing units in structures - Owners - Boat, RV, van, etc. (%)
Housing units in structures - Renters - 1, detached (%)
Housing units in structures - Renters - 1, attached (%)
Housing units in structures - Renters - 2 (%)
Housing units in structures - Renters - 3 or 4 (%)
Housing units in structures - Renters - 5 to 9 (%)
Housing units in structures - Renters - 10 to 19 (%)
Housing units in structures - Renters - 20 to 49 (%)
Housing units in structures - Renters - 50 or more (%)
Housing units in structures - Renters - Mobile home (%)
Housing units in structures - Renters - Boat, RV, van, etc. (%)
House/condo owner moved in on average (years ago)
Renter moved in on average (years ago)
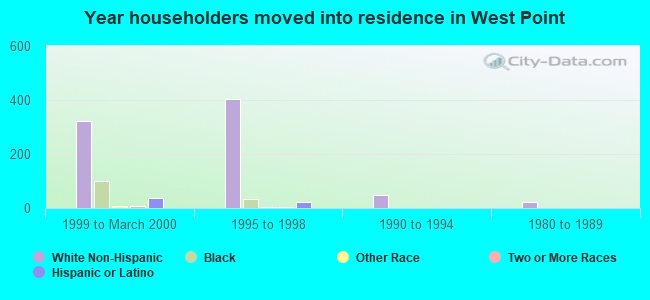
Year householder moved into unit - Moved in 1999 to March 2000 (%)
Year householder moved into unit - Moved in 1999 to March 2000 (%) - White
Year householder moved into unit - Moved in 1999 to March 2000 (%) - Black or African American
Year householder moved into unit - Moved in 1999 to March 2000 (%) - Asian
Year householder moved into unit - Moved in 1999 to March 2000 (%) - Hispanic or Latino
Year householder moved into unit - Moved in 1999 to March 2000 (%) - American Indian and Alaska Native
Year householder moved into unit - Moved in 1999 to March 2000 (%) - Multirace
Year householder moved into unit - Moved in 1999 to March 2000 (%) - Other Race
Year householder moved into unit - Moved in 1995 to 1998 (%)
Year householder moved into unit - Moved in 1995 to 1998 (%) - White
Year householder moved into unit - Moved in 1995 to 1998 (%) - Black or African American
Year householder moved into unit - Moved in 1995 to 1998 (%) - Asian
Year householder moved into unit - Moved in 1995 to 1998 (%) - Hispanic or Latino
Year householder moved into unit - Moved in 1995 to 1998 (%) - American Indian and Alaska Native
Year householder moved into unit - Moved in 1995 to 1998 (%) - Multirace
Year householder moved into unit - Moved in 1995 to 1998 (%) - Other Race
Year householder moved into unit - Moved in 1990 to 1994 (%)
Year householder moved into unit - Moved in 1990 to 1994 (%) - White
Year householder moved into unit - Moved in 1990 to 1994 (%) - Black or African American
Year householder moved into unit - Moved in 1990 to 1994 (%) - Asian
Year householder moved into unit - Moved in 1990 to 1994 (%) - Hispanic or Latino
Year householder moved into unit - Moved in 1990 to 1994 (%) - American Indian and Alaska Native
Year householder moved into unit - Moved in 1990 to 1994 (%) - Multirace
Year householder moved into unit - Moved in 1990 to 1994 (%) - Other Race
Year householder moved into unit - Moved in 1980 to 1989 (%)
Year householder moved into unit - Moved in 1980 to 1989 (%) - White
Year householder moved into unit - Moved in 1980 to 1989 (%) - Black or African American
Year householder moved into unit - Moved in 1980 to 1989 (%) - Asian
Year householder moved into unit - Moved in 1980 to 1989 (%) - Hispanic or Latino
Year householder moved into unit - Moved in 1980 to 1989 (%) - American Indian and Alaska Native
Year householder moved into unit - Moved in 1980 to 1989 (%) - Multirace
Year householder moved into unit - Moved in 1980 to 1989 (%) - Other Race
Year householder moved into unit - Moved in 1970 to 1979 (%)
Year householder moved into unit - Moved in 1970 to 1979 (%) - White
Year householder moved into unit - Moved in 1970 to 1979 (%) - Black or African American
Year householder moved into unit - Moved in 1970 to 1979 (%) - Asian
Year householder moved into unit - Moved in 1970 to 1979 (%) - Hispanic or Latino
Year householder moved into unit - Moved in 1970 to 1979 (%) - American Indian and Alaska Native
Year householder moved into unit - Moved in 1970 to 1979 (%) - Multirace
Year householder moved into unit - Moved in 1970 to 1979 (%) - Other Race
Year householder moved into unit - Moved in 1969 or earlier (%)
Year householder moved into unit - Moved in 1969 or earlier (%) - White
Year householder moved into unit - Moved in 1969 or earlier (%) - Black or African American
Year householder moved into unit - Moved in 1969 or earlier (%) - Asian
Year householder moved into unit - Moved in 1969 or earlier (%) - Hispanic or Latino
Year householder moved into unit - Moved in 1969 or earlier (%) - American Indian and Alaska Native
Year householder moved into unit - Moved in 1969 or earlier (%) - Multirace
Year householder moved into unit - Moved in 1969 or earlier (%) - Other Race
Housing units lacking complete plumbing facilities (%)
Housing units lacking complete kitchen facilities (%)
House heating fuel used in houses and condos - Utility gas (%)
House heating fuel used in houses and condos - Bottled, tank, or LP gas (%)
House heating fuel used in houses and condos - Electricity (%)
House heating fuel used in houses and condos - Fuel oil, kerosene, etc. (%)
House heating fuel used in houses and condos - Coal or coke (%)
House heating fuel used in houses and condos - Wood (%)
House heating fuel used in houses and condos - Solar energy (%)
House heating fuel used in houses and condos - Other fuel (%)
House heating fuel used in houses and condos - No fuel used (%)
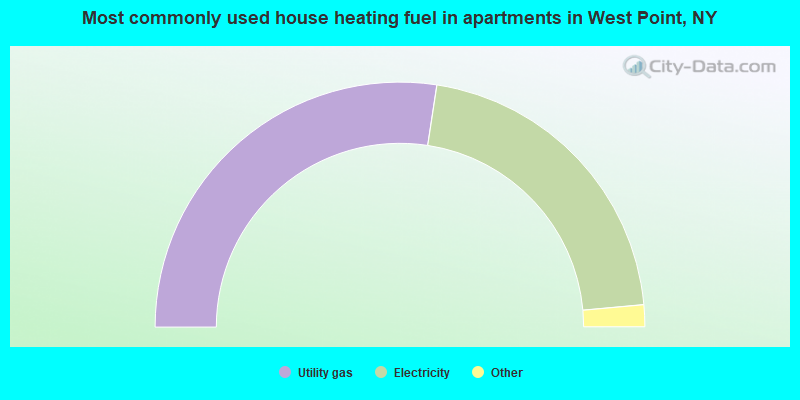
House heating fuel used in apartments - Utility gas (%)
House heating fuel used in apartments - Bottled, tank, or LP gas (%)
House heating fuel used in apartments - Electricity (%)
House heating fuel used in apartments - Fuel oil, kerosene, etc. (%)
House heating fuel used in apartments - Coal or coke (%)
House heating fuel used in apartments - Wood (%)
House heating fuel used in apartments - Solar energy (%)
House heating fuel used in apartments - Other fuel (%)
House heating fuel used in apartments - No fuel used (%)
Median year apartment built: 1982Household type by relationship:
Households: 6,460
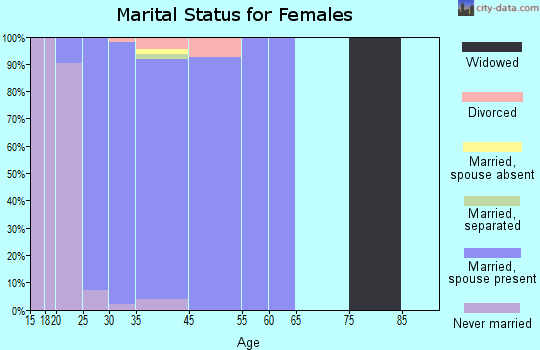
Male householders: 778 (29 living alone ), Female householders: 297 (16 living alone )788 spouses (788 opposite-sex spouses ), 10 unmarried partners , (10 opposite-sex unmarried partners ), 1,910 children (1,836 natural , 55 adopted , 18 stepchildren ), 0 grandchildren , 0 brothers or sisters , 24 parents , 7 foster children , 47 other relatives , 154 non-relatives In group quarters: 2,443
Size of family households: 159 2-persons , 200 3-persons , 302 4-persons , 177 5-persons , 53 6-persons , 78 7-or-more-persons .
Size of nonfamily households: 45 1-person , 19 2-persons , 54 4-persons .
1,462 married couples with children. single-parent households (14 men , 111 women ).
79.2% of residents of West Point speak English at home. of residents speak Spanish at home (95% speak English very well , 1% speak English well , 4% don't speak English at all ).of residents speak other Indo-European language at home (81% speak English very well , 15% speak English well , 4% speak English not well ).of residents speak Asian or Pacific Island language at home (81% speak English very well , 19% speak English well ).of residents speak other language at home (83% speak English very well , 17% speak English not well ).
Foreign born population: 413 (6.4%)of them are naturalized citizens )
Median number of rooms in houses and condos: Here:
-666666666.0State:
6.3
Median number of rooms in apartments
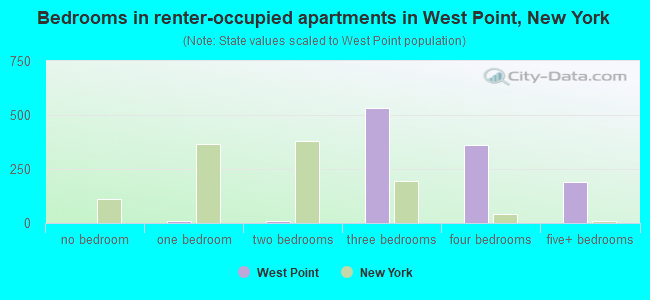
Bedrooms in renter-occupied apartments in West Point, New York
0 no bedroom 9 1 bedroom 8 2 bedrooms 534 3 bedrooms 359 4 bedrooms 189 5+ bedrooms
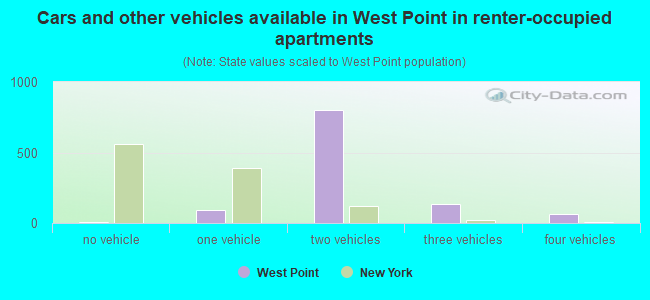
Cars and other vehicles available in West Point in renter-occupied apartments
6 no vehicle 95 1 vehicle 799 2 vehicles 135 3 vehicles 63 4 vehicles 0 5+ vehicles
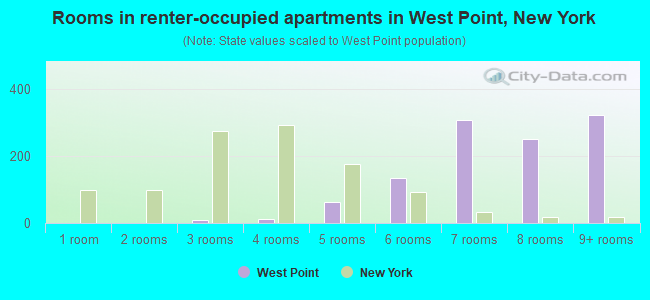
Rooms in renter-occupied apartments in West Point, New York
0 1 room 0 2 rooms 9 3 rooms 12 4 rooms 62 5 rooms 134 6 rooms 307 7 rooms 251 8 rooms 323 9+ rooms
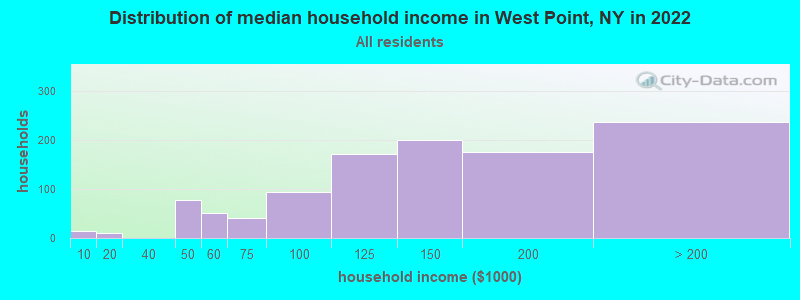
West Point, NY household income distribution 14 Less than $10,00011 $10,000 to $19,99978 $40,000 to $49,99951 $50,000 to $59,99940 $60,000 to $74,99993 $75,000 to $99,999171 $100,000 to $124,999199 $125,000 to $149,999175 $150,000 to $199,999236 $200,000 or more
Rent paid by renters in 2022 in West Point, NY 9 $900 to $99972 $2,000 to $2,499174 $2,500 to $2,999278 $3,000 to $3,499296 $3,500 or more69 No cash rent
Percentage of workers working in this county: 97.5%Number of people working at home: 992 (29.4% of all workers )
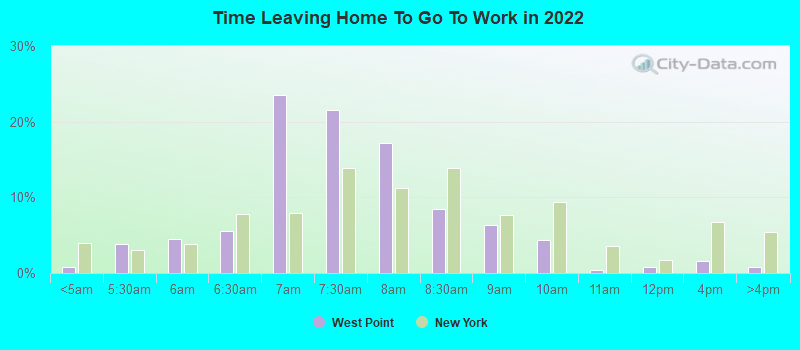
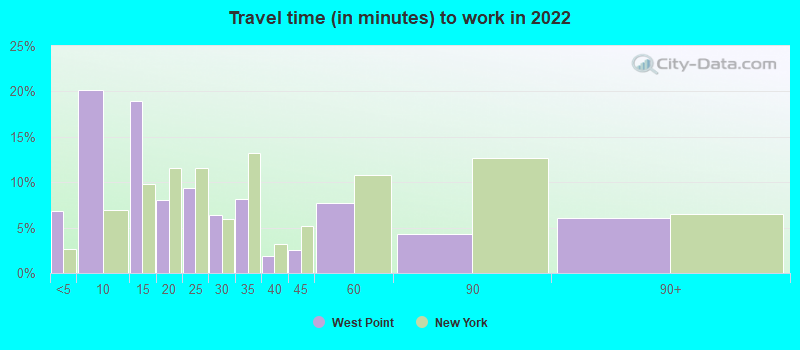
Travel time to work (commute)
Less than 5 minutes: 4065 to 9 minutes: 1,27110 to 14 minutes: 60015 to 19 minutes: 21820 to 24 minutes: 2925 to 29 minutes: 5030 to 34 minutes: 2335 to 39 minutes: 540 to 44 minutes: 745 to 59 minutes: 1660 to 89 minutes: 090 or more minutes: 37
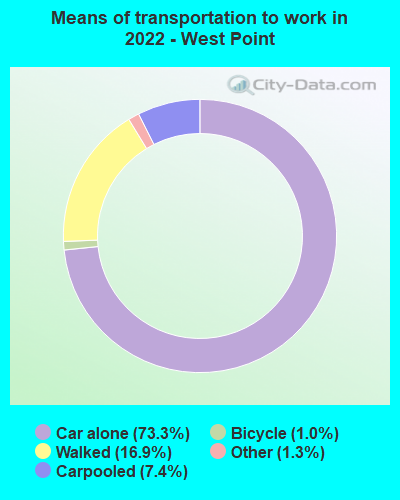
Means of transportation to work:
Drove a car alone: 5,223 (62.1%)Carpooled: 661 (7.9%)Taxi: 114 (1.4%)Bicycle: 83 (1.0%)Walked: 1,348 (16.0%)Worked at home: 992 (11.8%)
Unemployment by race in 2022
Unemployment rate for White non-Hispanic residents 1.2% FemalesUnemployment rate for other race residents 58.1% FemalesUnemployment rate for Hispanic or Latino residents 85.4% Females
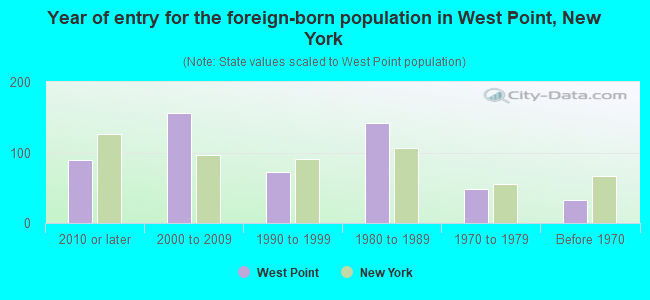
Year of entry for the foreign-born population in West Point, New York
89 2010 or later 156 2000 to 2009 73 1990 to 1999 142 1980 to 1989 48 1970 to 1979 33 Before 1970
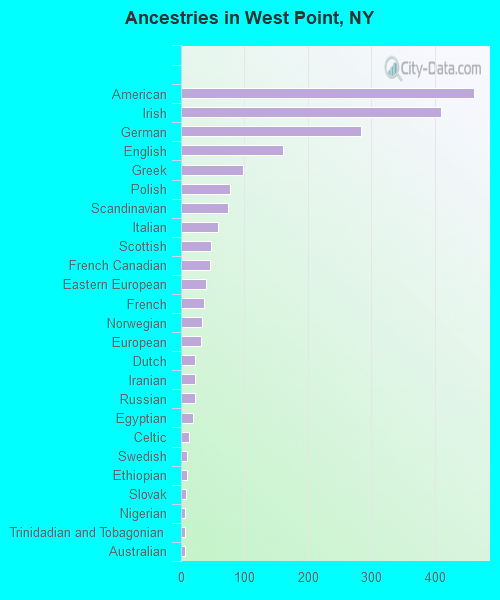
First ancestries reported:
American: 462 (14.8%)
Irish: 410 (13.1%)
German: 284 (9.1%)
English: 161 (5.1%)
Greek: 97 (3.1%)
Polish: 77 (2.5%)
Scandinavian: 74 (2.4%)
Italian: 58 (1.9%)
Scottish: 47 (1.5%)
French Canadian: 45 (1.4%)
Eastern European: 40 (1.3%)
French: 36 (1.2%)
Norwegian: 33 (1.1%)
European: 31 (1.0%)
Dutch: 22 (0.7%)
Iranian: 22 (0.7%)
Russian: 22 (0.7%)
Egyptian: 19 (0.6%)
Celtic: 12 (0.4%)
Swedish: 10 (0.3%)
Ethiopian: 9 (0.3%)
Slovak: 8 (0.3%)
Nigerian: 7 (0.2%)
Trinidadian and Tobagonian: 7 (0.2%)
Australian: 6 (0.2%)
African: 5 (0.2%)
Lithuanian: 4 (0.1%)
British: 3 (0.10%)
Haitian: 3 (0.10%) Most common places of birth for foreign-born residents (%): Oceania, n.e.c. West Point:
19.8% (74)New York:
0.0% (769)
Nicaragua West Point:
14.7% (55)New York:
0.2% (9,597)
Cameroon West Point:
13.4% (50)New York:
0.0% (1,642)
Dominican Republic West Point:
11.0% (41)New York:
11.1% (501,040)
Philippines West Point:
9.9% (37)New York:
2.0% (91,070)
Other Eastern Europe West Point:
5.3% (20)New York:
0.7% (30,173)
Panama West Point:
4.8% (18)New York:
0.4% (18,218)
Canada West Point:
4.5% (17)New York:
1.3% (59,107)
Korea West Point:
4.0% (15)New York:
1.8% (82,786)
Japan West Point:
3.5% (13)New York:
0.6% (28,472)
Poland West Point:
2.9% (11)New York:
1.4% (65,102)
Ukraine West Point:
2.7% (10)New York:
1.7% (78,421)
Cuba West Point:
2.7% (10)New York:
0.5% (23,242)
Singapore West Point:
1.9% (7)New York:
0.1% (3,853)
Ireland West Point:
1.6% (6)New York:
0.6% (26,772)
Place of birth for U.S.-born residents:
This state: 773Other state: 4,430Northeast: 655Midwest: 1,075South: 1,642West: 1,036 74.0% of West Point residents lived in the same house 1 years ago.
Out of people who lived in different houses, 6.5% lived in this county.
Out of people who lived in different counties, 27.2% lived in New York.
West Point:
74.0%State average:
89.6%
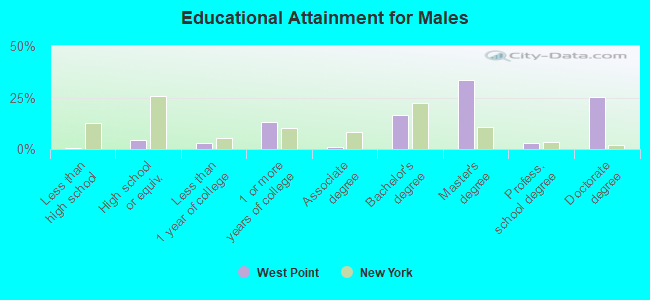
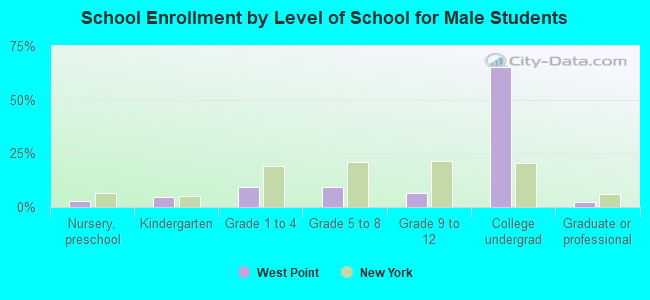
Education attainment for males 25 years and older:
No schooling: 0Nursery to 4th grade: 05th and 6th grade: 07th and 8th grade: 09th grade: 010th grade: 011th grade: 012th grade, no diploma: 6High school graduate (or equivalency): 41Less than 1 year of college: 29Some college more than 1 year, no degree: 122Associate degree: 9Bachelor's degree: 156Master's degree: 312Professional school degree: 27Doctorate degree: 236
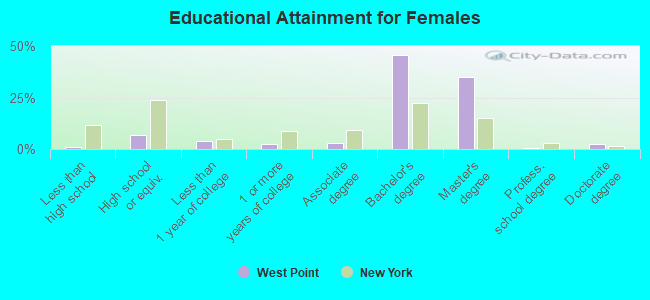
Education attainment for females 25 years and older:
No schooling: 0Nursery to 4th grade: 75th and 6th grade: 07th and 8th grade: 29th grade: 010th grade: 011th grade: 012th grade, no diploma: 0High school graduate (or equivalency): 62Less than 1 year of college: 36Some college more than 1 year, no degree: 22Associate degree: 27Bachelor's degree: 428Master's degree: 327Professional school degree: 5Doctorate degree: 24
Housing units in structures:
One, detached: 400One, attached: 671Two: 423 or 4: 905 to 9: 3020 to 49: 950 or more: 4Housing units lacking complete kitchen facilities in 2022: 0.3%
54.9% Utility gas 42.3% Electricity 1.5% Fuel oil, kerosene, etc. 0.7% Bottled, tank, or LP gas 0.6% No fuel used
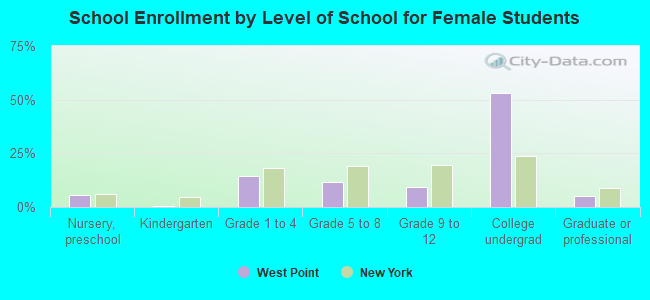
Private vs. public school enrollment:
Students in private schools in grades 1 to 8 (elementary and middle school): 192 Students in private schools in grades 9 to 12 (high school): 47 Students in private undergraduate colleges: 165