West Springfield, VA (Virginia) Houses and Residents
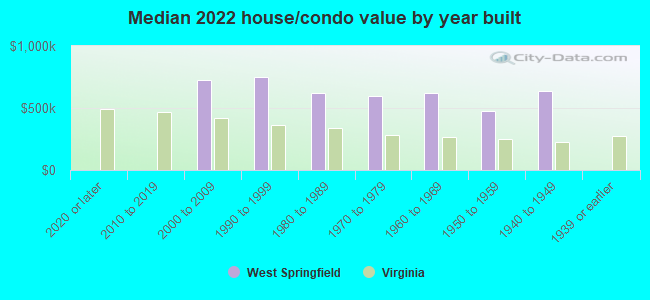
| West Springfield: | $617,554 |
| Virginia: | $365,700 |
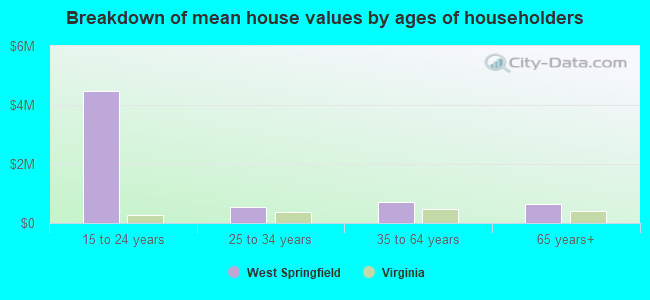
Mean price in 2022:
Detached houses: $821,108
Here: $821,108 State: $472,865 Townhouses or other attached units: $512,544
Here: $512,544 State: $457,437 In 3-to-4-unit structures: $264,964
Here: $264,964 State: $252,346 In 5-or-more-unit structures: $307,494
Here: $307,494 State: $382,551
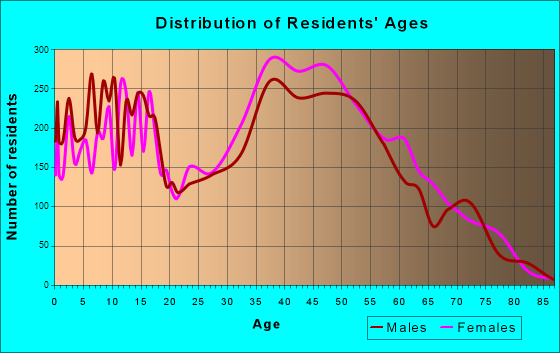
Total population: 22,460 (All urban)
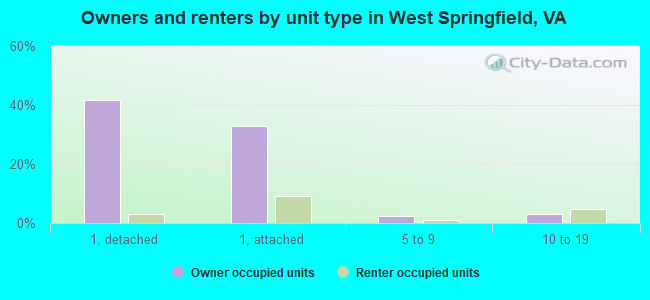
Houses: 8,085 (7,827 occupied: 6,352 owner occupied, 1,518 renter occupied)
| % of renters here: | 19% |
| State: | 33% |
Housing density: 1,185 houses/condos per square mile
Median price asked for vacant for-sale houses and condos in 2022: $511,545.
Median contract rent in 2022: over $2,000 (lower quartile is $1,793, upper quartile is over $2,000)
Median rent asked for vacant for-rent units in 2022: $2,475
Median gross rent in West Springfield, VA in 2022: over $2,000
Housing units in West Springfield with a mortgage: 4,475 (402 second mortgage, 6 home equity loan, 359 both second mortgage and home equity loan)
Houses without a mortgage: 75
Median household income for houses/condos with a mortgage: $179,478
Median household income for apartments without a mortgage: $139,684
Median monthly housing costs: $2,295
Compare current foreclosures near West Springfield, VA:
| Photo | Address | Area | Beds / Baths | Price | Details |
|---|---|---|---|---|---|

|
#1
17th St NW Apt 504
Washington, DC 20009
|
800 sq. feet
|
1 baths 1 beds |
$405,000
|
show details |

|
#2
Monroe St NW
Washington, DC 20010
|
- sq. feet
|
2 baths 2 beds |
$665,000
|
show details |

|
#3
Henson Ln
Temple Hills, MD 20748
|
1,566 sq. feet
|
2 baths 3 beds |
$300,000
|
show details |

|
#4
Cathedral Ave NW Apt 108
Washington, DC 20016
|
765 sq. feet
|
1 baths 1 beds |
$269,900
|
show details |

|
#5
9th St NW
Washington, DC 20011
|
1,604 sq. feet
|
2 baths 3 beds |
$598,000
|
show details |

|
#6
Wilson Bridge Dr Unit #6770 A-2
Oxon Hill, MD 20745
|
- sq. feet
|
1 baths 1 beds |
$99,750
|
show details |

|
#7
T St SE Apt 3
Washington, DC 20020
|
- sq. feet
|
2 baths 4 beds |
$339,900
|
show details |

|
#8
Delaware Ave SW Apt N720
Washington, DC 20024
|
- sq. feet
|
1 baths 1 beds |
$149,900
|
show details |

|
#9
Holbrook Ter NE
Washington, DC 20002
|
3,164 sq. feet
|
4 baths 8 beds |
show details | |

|
#10
Earlham Ct
Woodbridge, VA 22193
|
1,260 sq. feet
|
2 baths 3 beds |
show details |
| Photo | Address | Area | Beds / Baths | Price | Details |
|---|---|---|---|---|---|

|
#11
Lee Landing Dr
Falls Church, VA 22043
|
900 sq. feet
|
1 baths 2 beds |
show details | |

|
#12
Lyceum Ln
Manassas, VA 20112
|
4,911 sq. feet
|
3 baths 4 beds |
show details | |

|
#13
Moore Dr
Manassas, VA 20111
|
1,872 sq. feet
|
1 baths 3 beds |
show details | |

|
#14
Willoughby Ct
Chantilly, VA 20151
|
950 sq. feet
|
2 baths 4 beds |
show details | |

|
#15
Glade Bank Dr
Manassas, VA 20111
|
1,942 sq. feet
|
3 baths 4 beds |
show details | |

|
#16
Duck Pond Ter
Manassas, VA 20111
|
1,546 sq. feet
|
3 baths 3 beds |
show details | |

|
#17
Tamberly Lane
Manassas, VA 20111
|
- sq. feet
|
2 baths 4 beds |
show details | |

|
#18
Teal Way
Woodbridge, VA 22191
|
2,450 sq. feet
|
4 baths 4 beds |
show details | |

|
#19
New Braddock Rd
Centreville, VA 20121
|
1,372 sq. feet
|
2 baths 3 beds |
show details | |

|
#20
Dubois Ct
Woodbridge, VA 22193
|
1,356 sq. feet
|
2 baths 4 beds |
show details |
| Photo | Address | Area | Beds / Baths | Price | Details |
|---|---|---|---|---|---|

|
#21
Potomac Highlands Cir
Triangle, VA 22172
|
- sq. feet
|
2 baths 3 beds |
show details | |

|
#22
Portsmouth Rd
Manassas, VA 20109
|
1,785 sq. feet
|
3 baths 3 beds |
show details | |

|
#23
Oakside Ln
Indian Head, MD 20640
|
1,102 sq. feet
|
1 baths 3 beds |
show details | |

|
#24
Doulton Ct
Fairfax, VA 22032
|
2,551 sq. feet
|
4 baths 5 beds |
show details | |

|
#25
Springbrook Ct
Woodbridge, VA 22193
|
1,428 sq. feet
|
2 baths 3 beds |
show details | |

|
#26
Damascus Dr
Manassas, VA 20109
|
1,299 sq. feet
|
2 baths 4 beds |
show details | |

|
#27
Bowen Rd SE Apt 403
Washington, DC 20020
|
930 sq. feet
|
1 baths 2 beds |
show details | |

|
#28
Castle Harbor Way
Centreville, VA 20120
|
1,518 sq. feet
|
2 baths 3 beds |
show details | |

|
#29
Halley Pl SE Apt 204
Washington, DC 20032
|
934 sq. feet
|
1 baths 3 beds |
show details | |

|
#30
Antiopi St
Annandale, VA 22003
|
2,505 sq. feet
|
2 baths 4 beds |
show details |
| Photo | Address | Area | Beds / Baths | Price | Details |
|---|---|---|---|---|---|

|
#31
Knollwood Dr
Manassas, VA 20111
|
3,172 sq. feet
|
3 baths 4 beds |
show details | |

|
#32
Southern Ave SE
Washington, DC 20019
|
1,024 sq. feet
|
1 baths 3 beds |
show details | |

|
#33
Stonepath Cir
Centreville, VA 20120
|
1,452 sq. feet
|
4 baths 4 beds |
show details | |

|
#34
Pine Ln
Alexandria, VA 22312
|
2,356 sq. feet
|
3 baths 3 beds |
show details | |

|
#35
Fort Trl
Accokeek, MD 20607
|
1,915 sq. feet
|
2 baths 3 beds |
show details | |

|
#36
Pollen St
Lorton, VA 22079
|
1,052 sq. feet
|
2 baths 3 beds |
show details | |

|
#37
Rockton Ct
Centreville, VA 20121
|
1,440 sq. feet
|
2 baths 3 beds |
show details | |

|
#38
Graysons Mill Ln
Lorton, VA 22079
|
2,961 sq. feet
|
2 baths 4 beds |
show details | |

|
#39
New York Ave NW Apt 402
Washington, DC 20001
|
842 sq. feet
|
1 baths 2 beds |
show details | |

|
#40
Jefferson St NW
Washington, DC 20011
|
1,280 sq. feet
|
5 baths 6 beds |
show details |
| Photo | Address | Area | Beds / Baths | Price | Details |
|---|---|---|---|---|---|

|
#41
William And Mary Dr
Alexandria, VA 22308
|
1,071 sq. feet
|
2 baths 3 beds |
show details | |

|
#42
Windbreak Dr
Alexandria, VA 22306
|
1,360 sq. feet
|
3 baths 3 beds |
show details | |

|
#43
Plainfield St
Falls Church, VA 22043
|
1,102 sq. feet
|
3 baths 4 beds |
show details | |

|
#44
Vernon St
Manassas, VA 20109
|
1,280 sq. feet
|
2 baths 3 beds |
show details | |

|
#45
Morse St NE
Washington, DC 20002
|
1,836 sq. feet
|
2 baths 3 beds |
show details | |

|
#46
Kincheloe Rd
Clifton, VA 20124
|
4,492 sq. feet
|
4 baths 5 beds |
show details | |

|
#47
Tremayne Pl Apt 309
Mc Lean, VA 22102
|
1,180 sq. feet
|
2 baths 2 beds |
show details | |

|
#48
Carolyn Forest Dr
Woodbridge, VA 22192
|
1,593 sq. feet
|
2 baths 2 beds |
show details | |

|
#49
Lakewood Dr
Woodbridge, VA 22192
|
2,038 sq. feet
|
2 baths 4 beds |
show details | |

|
Check over 1 million property listings on Foreclosure.com!
|
browse all offers | |||


 | Future of NOVA housing market (80 replies) |
| Advice for (rental) house hunting trip? (10 replies) |
| Real estate question...to fix home before sale, or forget it? (21 replies) |
| New to NoVA: Rent in West Springfield, Commute to L'Enfant? (13 replies) |
| Does it annoy you that homeowners are renting their basements (94 replies) |
| Help us find a house! (22 replies) |
Median year apartment built: 1978
Household type by relationship:
Households: 23,228- Male householders: 4,272 (574 living alone), Female householders: 3,455 (956 living alone)
4,689 spouses (4,682 opposite-sex spouses), 253 unmarried partners, (197 opposite-sex unmarried partners), 8,088 children (7,410 natural, 84 adopted, 593 stepchildren), 163 grandchildren, 532 brothers or sisters, 463 parents, 0 foster children, 543 other relatives, 753 non-relatives
- In group quarters: 12
Size of family households: 2,258 2-persons, 1,241 3-persons, 1,448 4-persons, 626 5-persons, 323 6-persons, 19 7-or-more-persons.
Size of nonfamily households: 1,578 1-person, 239 2-persons, 55 3-persons, 45 4-persons.
4,230 married couples with children.
876 single-parent households (160 men, 716 women).
63.4% of residents of West Springfield speak English at home.
13.7% of residents speak Spanish at home (68% speak English very well, 15% speak English well, 13% speak English not well, 3% don't speak English at all).
8.8% of residents speak other Indo-European language at home (73% speak English very well, 19% speak English well, 5% speak English not well, 2% don't speak English at all).
8.4% of residents speak Asian or Pacific Island language at home (46% speak English very well, 32% speak English well, 20% speak English not well, 3% don't speak English at all).
5.2% of residents speak other language at home (75% speak English very well, 22% speak English well, 2% speak English not well).
Foreign born population: 5,933 (25.5%)
(66.6% of them are naturalized citizens)
| Here: | 7.5 |
| State: | 7.0 |
| Here: | 5.6 |
| State: | 4.3 |
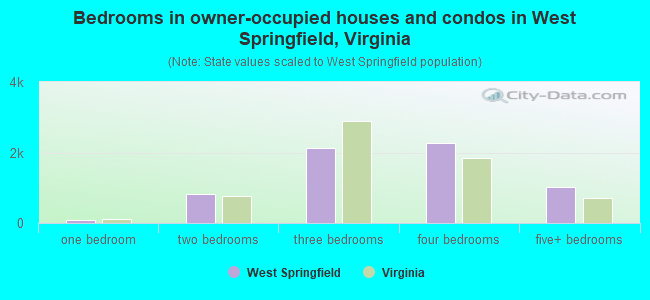
- Bedrooms in owner-occupied houses and condos in West Springfield, Virginia
- 22no bedroom
- 751 bedroom
- 8272 bedrooms
- 2,1353 bedrooms
- 2,2664 bedrooms
- 1,0275+ bedrooms
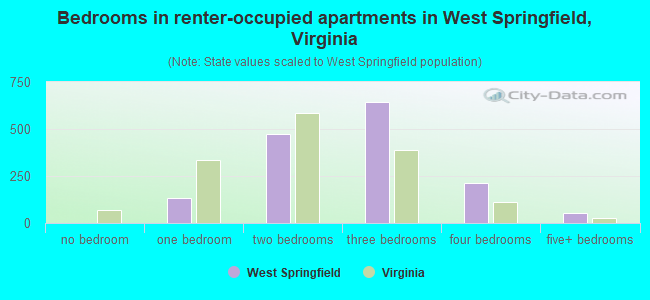
- Bedrooms in renter-occupied apartments in West Springfield, Virginia
- 0no bedroom
- 1341 bedroom
- 4762 bedrooms
- 6423 bedrooms
- 2134 bedrooms
- 555+ bedrooms
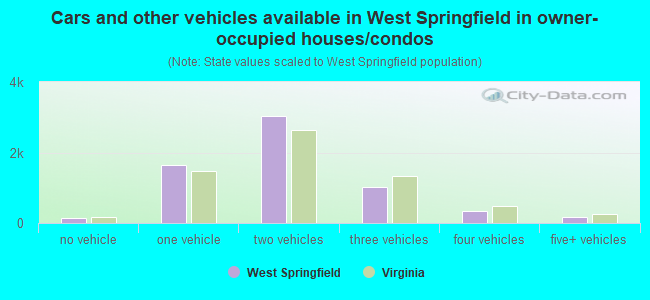
- Cars and other vehicles available in West Springfield in owner-occupied houses/condos
- 137no vehicle
- 1,6391 vehicle
- 3,0352 vehicles
- 1,0253 vehicles
- 3514 vehicles
- 1665+ vehicles
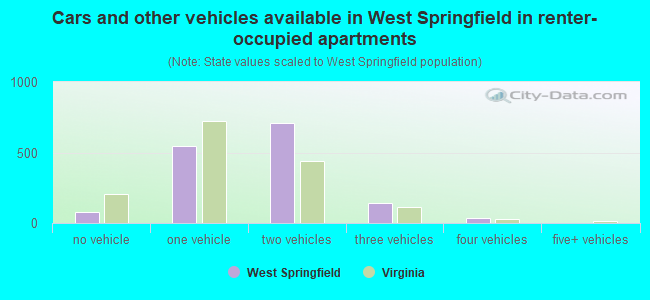
- Cars and other vehicles available in West Springfield in renter-occupied apartments
- 80no vehicle
- 5491 vehicle
- 7112 vehicles
- 1443 vehicles
- 354 vehicles
- 05+ vehicles
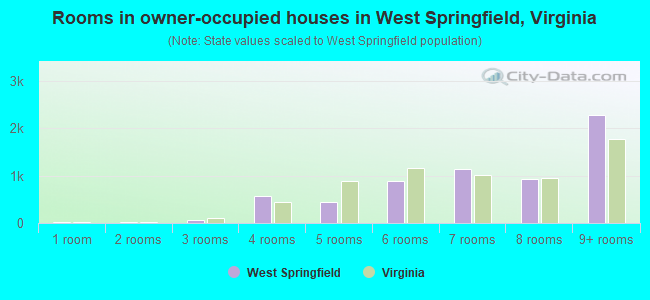
- Rooms in owner-occupied houses in West Springfield, Virginia
- 221 room
- 162 rooms
- 703 rooms
- 5614 rooms
- 4495 rooms
- 8936 rooms
- 1,1297 rooms
- 9338 rooms
- 2,2799+ rooms
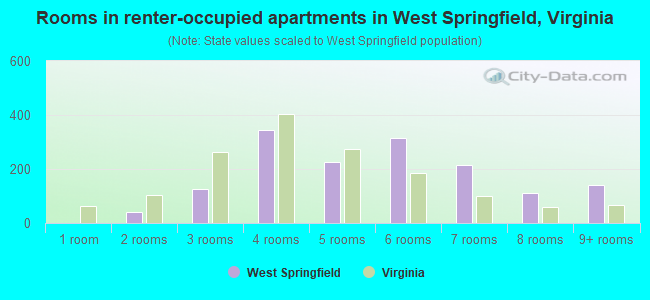
- Rooms in renter-occupied apartments in West Springfield, Virginia
- 01 room
- 422 rooms
- 1253 rooms
- 3454 rooms
- 2255 rooms
- 3166 rooms
- 2167 rooms
- 1108 rooms
- 1419+ rooms
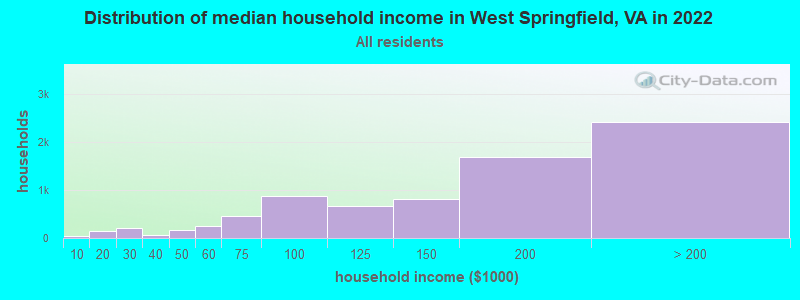
West Springfield, VA household income distribution

- 51Less than $10,000
- 155$10,000 to $19,999
- 206$20,000 to $29,999
- 71$30,000 to $39,999
- 167$40,000 to $49,999
- 250$50,000 to $59,999
- 463$60,000 to $74,999
- 879$75,000 to $99,999
- 656$100,000 to $124,999
- 818$125,000 to $149,999
- 1,688$150,000 to $199,999
- 2,414$200,000 or more
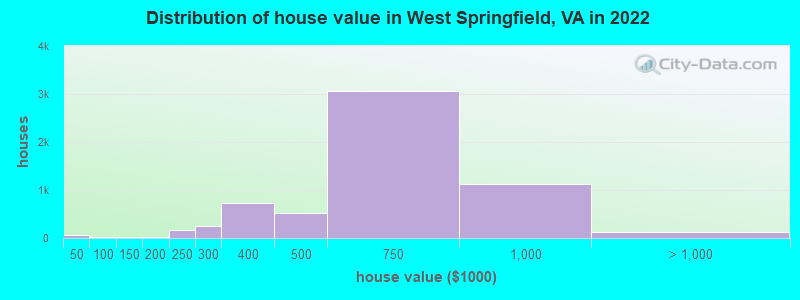
Home value of owner - occupied houses in 2022 in West Springfield, VA
-
- 57Less than $10,000
- 0$40,000 to $49,999
- 1$50,000 to $59,999
- 8$70,000 to $79,999
- 19$125,000 to $149,999
- 13$150,000 to $174,999
- 7$175,000 to $199,999
- 174$200,000 to $249,999
- 253$250,000 to $299,999
- 727$300,000 to $399,999
- 511$400,000 to $499,999
- 3,060$500,000 to $749,999
- 1,123$750,000 to $999,999
- 104$1,000,000 to $1,499,999
- 12$1,500,000 to $1,999,999
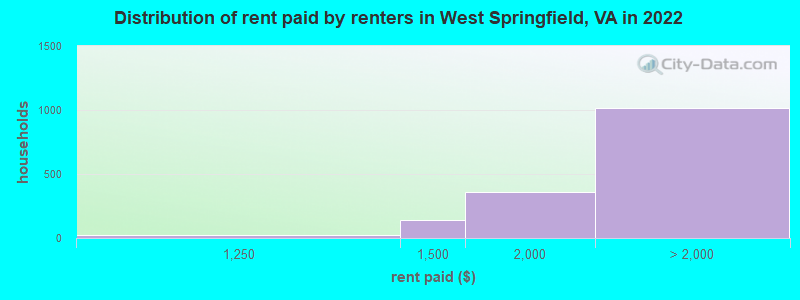
Rent paid by renters in 2022 in West Springfield, VA
-
- 22$1,000 to $1,249
- 136$1,250 to $1,499
- 359$1,500 to $1,999
- 389$2,000 to $2,499
- 416$2,500 to $2,999
- 122$3,000 to $3,499
- 21$3,500 or more
- 69No cash rent
Percentage of workers working in this county: 64.7%
Number of people working at home: 2,665 (21.5% of all workers)
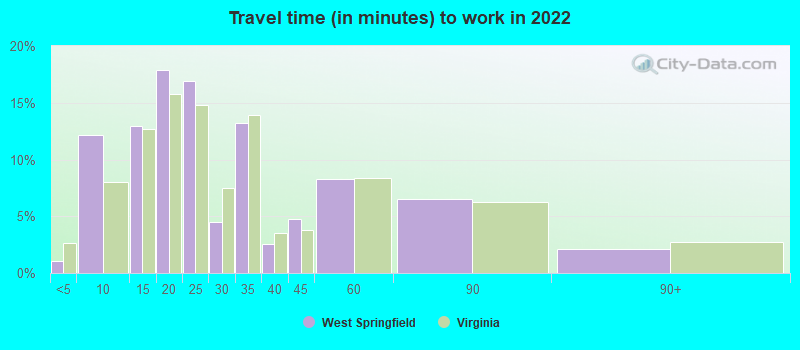
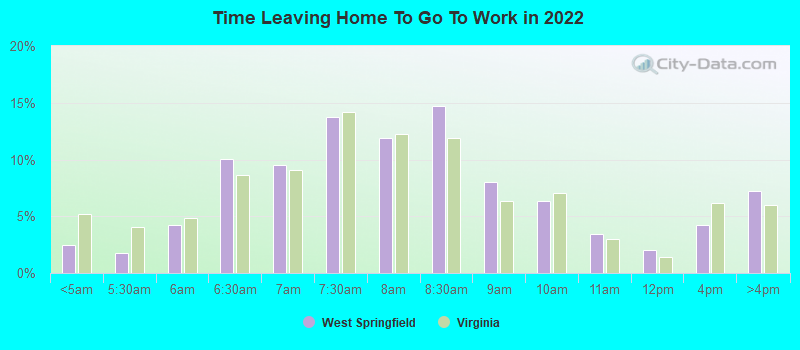
Travel time to work (commute)
- Less than 5 minutes: 32
- 5 to 9 minutes: 359
- 10 to 14 minutes: 756
- 15 to 19 minutes: 947
- 20 to 24 minutes: 1,309
- 25 to 29 minutes: 897
- 30 to 34 minutes: 1,874
- 35 to 39 minutes: 613
- 40 to 44 minutes: 788
- 45 to 59 minutes: 822
- 60 to 89 minutes: 756
- 90 or more minutes: 153
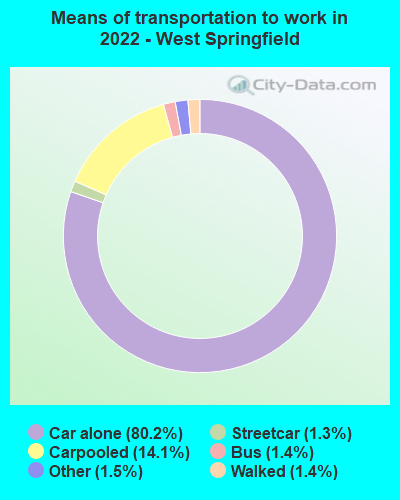
Means of transportation to work:
- Drove a car alone: 2,648 (47.0%)
- Carpooled: 479 (8.5%)
- Bus: 30 (0.5%)
- Subway or elevated rail: 35 (0.6%)
- Taxi: 69 (1.2%)
- Bicycle: 1 (0.0%)
- Walked: 53 (0.9%)
- Worked at home: 2,665 (47.3%)
- Unemployment by race in 2022
- Unemployment rate for White non-Hispanic residents
- 1.6%Males
- 1.0%Females
- Unemployment rate for Black residents
- 2.2%Males
- 6.9%Females
- Unemployment rate for Asian residents
- 2.3%Males
- 2.3%Females
- Unemployment rate for other race residents
- 6.1%Males
- Unemployment rate for two or more race residents
- 1.6%Males
- 1.7%Females
- Unemployment rate for Hispanic or Latino residents
- 2.8%Males
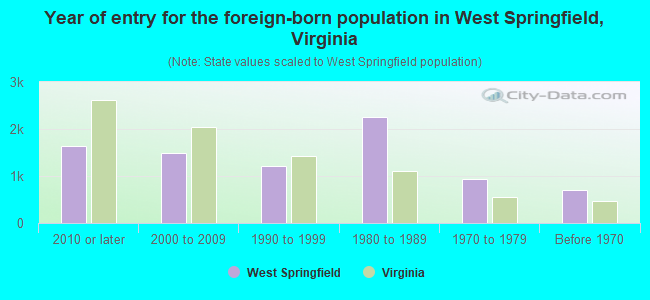
- Year of entry for the foreign-born population in West Springfield, Virginia
- 1,6312010 or later
- 1,4832000 to 2009
- 1,2091990 to 1999
- 2,2481980 to 1989
- 9341970 to 1979
- 694Before 1970
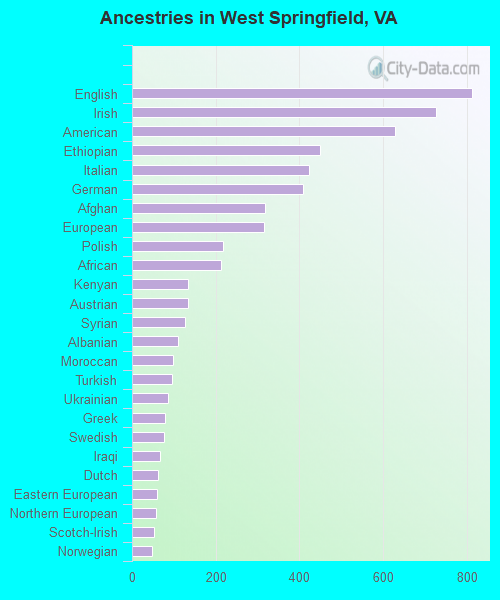
First ancestries reported:
- English: 813 (6.3%)
- Irish: 728 (5.6%)
- American: 630 (4.8%)
- Ethiopian: 449 (3.5%)
- Italian: 423 (3.3%)
- German: 408 (3.1%)
- Afghan: 317 (2.4%)
- European: 316 (2.4%)
- Polish: 217 (1.7%)
- African: 214 (1.6%)
- Kenyan: 135 (1.0%)
- Austrian: 133 (1.0%)
- Syrian: 126 (1.0%)
- Albanian: 110 (0.8%)
- Moroccan: 99 (0.8%)
- Turkish: 95 (0.7%)
- Ukrainian: 86 (0.7%)
- Greek: 78 (0.6%)
- Swedish: 77 (0.6%)
- Iraqi: 67 (0.5%)
- Dutch: 63 (0.5%)
- Eastern European: 59 (0.5%)
- Northern European: 57 (0.4%)
- Scotch-Irish: 53 (0.4%)
- Norwegian: 47 (0.4%)
- Scottish: 47 (0.4%)
- French: 42 (0.3%)
- Jamaican: 41 (0.3%)
- Armenian: 40 (0.3%)
- Scandinavian: 38 (0.3%)
- Somali: 38 (0.3%)
- Egyptian: 38 (0.3%)
- Hungarian: 27 (0.2%)
- Portuguese: 25 (0.2%)
- British: 24 (0.2%)
- Lebanese: 20 (0.2%)
- Russian: 19 (0.1%)
- Swiss: 18 (0.1%)
- Romanian: 16 (0.1%)
- Trinidadian and Tobagonian: 13 (0.1%)
- Finnish: 11 (0.08%)
- Czechoslovakian: 11 (0.08%)
- Palestinian: 11 (0.08%)
- Lithuanian: 9 (0.07%)
- Macedonian: 9 (0.07%)
- Danish: 9 (0.07%)
- Canadian: 8 (0.06%)
- Czech: 7 (0.05%)
- Bulgarian: 7 (0.05%)
- Slovak: 7 (0.05%)
- Pennsylvania German: 6 (0.05%)
- Assyrian: 6 (0.05%)
- Haitian: 5 (0.04%)
- Arab: 3 (0.02%)
- Slovene: 2 (0.02%)
- Ghanaian: 2 (0.02%)
- Welsh: 2 (0.02%)
Most common places of birth for foreign-born residents (%):
| West Springfield: | 9.9% (586) |
| Virginia: | 4.9% (52,857) |
| West Springfield: | 8.1% (482) |
| Virginia: | 4.2% (45,750) |
| West Springfield: | 7.5% (445) |
| Virginia: | 2.4% (26,366) |
| West Springfield: | 6.2% (368) |
| Virginia: | 2.9% (32,082) |
| West Springfield: | 5.2% (309) |
| Virginia: | 9.9% (107,534) |
| West Springfield: | 5.0% (297) |
| Virginia: | 4.8% (52,629) |
| West Springfield: | 4.3% (258) |
| Virginia: | 1.8% (19,426) |
| West Springfield: | 4.2% (250) |
| Virginia: | 2.3% (24,582) |
| West Springfield: | 3.4% (203) |
| Virginia: | 9.0% (97,830) |
| West Springfield: | 3.4% (199) |
| Virginia: | 1.3% (14,435) |
| West Springfield: | 2.8% (167) |
| Virginia: | 2.4% (25,722) |
| West Springfield: | 2.1% (122) |
| Virginia: | 0.5% (4,997) |
| West Springfield: | 1.8% (108) |
| Virginia: | 0.8% (8,186) |
| West Springfield: | 1.7% (99) |
| Virginia: | 1.1% (12,049) |
| West Springfield: | 1.5% (89) |
| Virginia: | 0.5% (5,899) |
Place of birth for U.S.-born residents:
- This state: 6,379
- Other state: 10,150
- Northeast: 2,915
- Midwest: 1,978
- South: 3,697
- West: 1,525
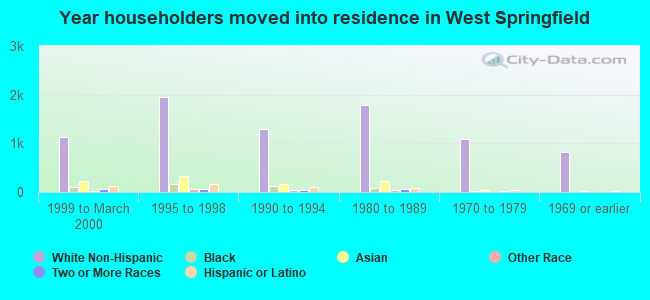
85.4% of West Springfield residents lived in the same house 1 years ago.
Out of people who lived in different houses, 33.8% lived in this county.
Out of people who lived in different counties, 39.8% lived in Virginia.
| West Springfield: | 85.4% |
| State average: | 86.6% |
Education attainment for males 25 years and older:
- No schooling: 84
- Nursery to 4th grade: 10
- 5th and 6th grade: 33
- 7th and 8th grade: 30
- 9th grade: 33
- 10th grade: 1
- 11th grade: 9
- 12th grade, no diploma: 69
- High school graduate (or equivalency): 1,090
- Less than 1 year of college: 188
- Some college more than 1 year, no degree: 534
- Associate degree: 633
- Bachelor's degree: 2,243
- Master's degree: 1,835
- Professional school degree: 502
- Doctorate degree: 330

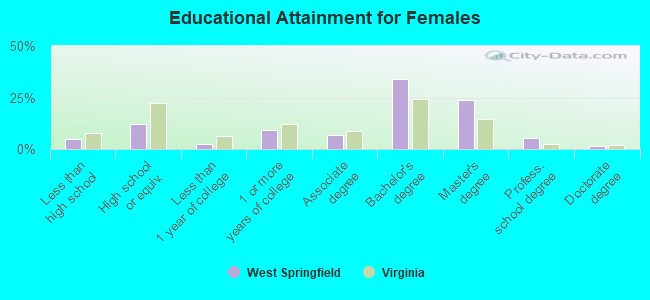
Education attainment for females 25 years and older:
- No schooling: 130
- Nursery to 4th grade: 22
- 5th and 6th grade: 0
- 7th and 8th grade: 8
- 9th grade: 75
- 10th grade: 1
- 11th grade: 22
- 12th grade, no diploma: 128
- High school graduate (or equivalency): 984
- Less than 1 year of college: 186
- Some college more than 1 year, no degree: 721
- Associate degree: 555
- Bachelor's degree: 2,709
- Master's degree: 1,910
- Professional school degree: 443
- Doctorate degree: 129
Housing units in structures:
- One, detached: 3,581
- One, attached: 3,083
- Two: 38
- 3 or 4: 81
- 5 to 9: 242
- 10 to 19: 799
- 20 to 49: 227
- 50 or more: 22
- Mobile homes: 9
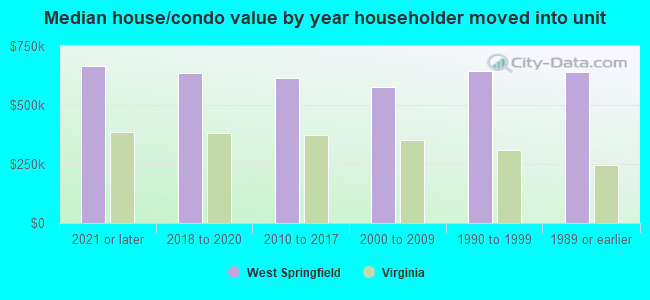
House/condo owner moved in on average 14 years ago
Renter moved in on average 4 years ago
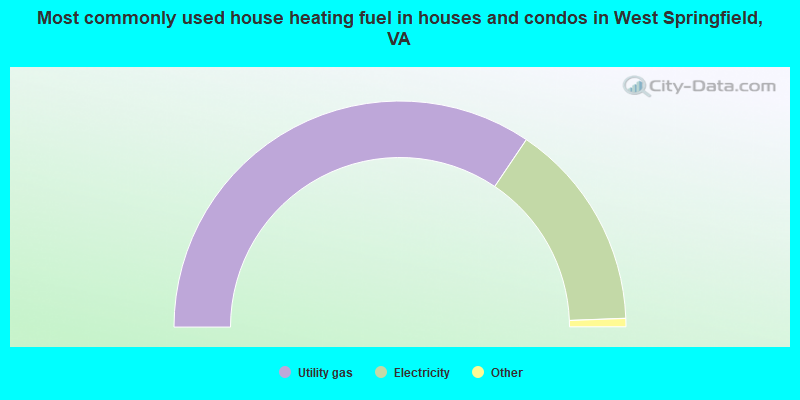
- 68.9%Utility gas
- 29.9%Electricity
- 0.6%Fuel oil, kerosene, etc.
- 0.4%Bottled, tank, or LP gas
- 0.2%Solar energy
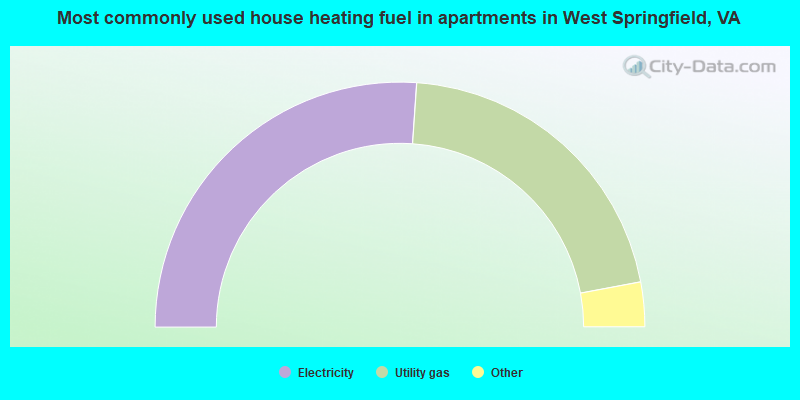
- 52.2%Electricity
- 41.9%Utility gas
- 3.6%No fuel used
- 1.2%Solar energy
- 1.1%Bottled, tank, or LP gas
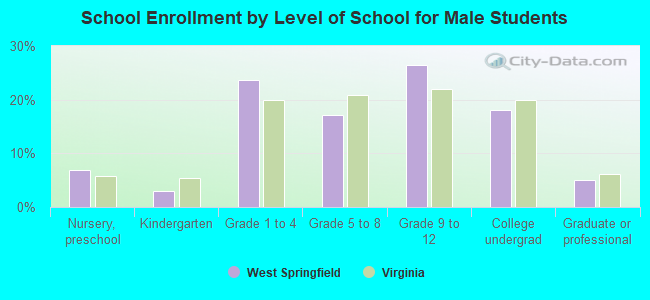
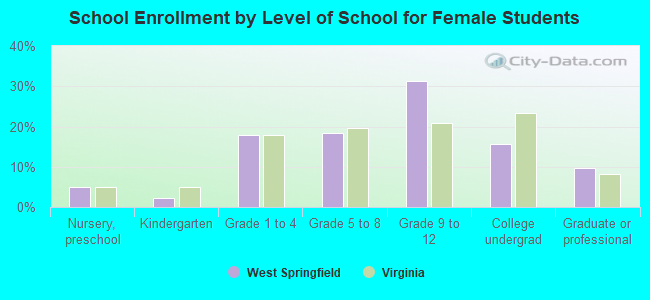
Private vs. public school enrollment:
| Here: | 8.8% |
| Virginia: | 13.2% |
| Here: | 1.1% |
| Virginia: | 10.2% |
| Here: | 12.3% |
| Virginia: | 18.7% |