West Tisbury, MA (Massachusetts) Houses and Residents
| West Tisbury: | $1,281,859 |
| Massachusetts: | $534,700 |
Total population: 2,740 (Urban population: 0, Rural population: 2,467 (35 farm, 2,432 nonfarm))
Houses: 1,849 (1,034 occupied: 771 owner occupied, 263 renter occupied)
| % of renters here: | 25% |
| State: | 38% |
Housing density: 74 houses/condos per square mile
Median price asked for vacant for-sale houses and condos in 2022 in this county: $1,398,746.
Median contract rent in 2022: $1,439 (lower quartile is $842, upper quartile is $1,740)
Median rent asked for vacant for-rent units in 2022: $1,553
Median gross rent in West Tisbury, MA in 2022: $1,728
Housing units in West Tisbury with a mortgage: 446 (40 second mortgage, 28 home equity loan, 0 both second mortgage and home equity loan)
Houses without a mortgage: 169
Compare current foreclosures near West Tisbury, MA:
| Photo | Address | Area | Beds / Baths | Price | Details |
|---|---|---|---|---|---|

|
#1
W Falmouth Hwy
Falmouth, MA 02540
|
1,224 sq. feet
|
2 baths 4 beds |
$665,000
|
show details |

|
#2
Bailey Park Rd
Vineyard Haven, MA 02568
|
1,267 sq. feet
|
2 baths 3 beds |
show details | |

|
#3
Sailfish Dr
East Falmouth, MA 02536
|
1,539 sq. feet
|
2 baths 4 beds |
show details | |

|
#4
Wheelhouse Cir
East Falmouth, MA 02536
|
2,012 sq. feet
|
1 baths 3 beds |
show details | |

|
#5
Geggatt Rd
East Falmouth, MA 02536
|
2,418 sq. feet
|
4 baths 4 beds |
show details | |

|
#6
Bailey Dr
East Falmouth, MA 02536
|
1,328 sq. feet
|
2 baths 3 beds |
show details | |

|
#7
Edgewater Dr E
East Falmouth, MA 02536
|
4,295 sq. feet
|
5 baths 3 beds |
show details | |

|
#8
Crofton Ln
East Falmouth, MA 02536
|
1,642 sq. feet
|
2 baths 4 beds |
show details | |

|
#9
Sophie Ln
East Falmouth, MA 02536
|
1,344 sq. feet
|
2 baths 4 beds |
show details | |

|
#10
Braxton Rd
East Falmouth, MA 02536
|
1,184 sq. feet
|
1 baths 3 beds |
show details |
| Photo | Address | Area | Beds / Baths | Price | Details |
|---|---|---|---|---|---|

|
#11
Davisville Rd
East Falmouth, MA 02536
|
962 sq. feet
|
1 baths 3 beds |
show details | |

|
#12
Edgewater Dr
East Falmouth, MA 02536
|
884 sq. feet
|
1 baths 3 beds |
show details | |

|
#13
Nobska Rd
Woods Hole, MA 02543
|
1,384 sq. feet
|
2 baths 3 beds |
show details | |

|
#14
Fordham Cir
East Falmouth, MA 02536
|
1,784 sq. feet
|
1 baths 3 beds |
show details | |

|
#15
Sandwich Rd # 6
East Falmouth, MA 02536
|
- sq. feet
|
- baths - beds |
show details | |

|
#16
Fawndale Rd
Vineyard Haven, MA 02568
|
- sq. feet
|
- baths - beds |
show details | |

|
#17
Edgewater Dr E
East Falmouth, MA 02536
|
- sq. feet
|
- baths - beds |
show details | |

|
#18
Teaticket Hwy
East Falmouth, MA 02536
|
- sq. feet
|
- baths - beds |
show details | |

|
#19
Countrywood Ln
East Falmouth, MA 02536
|
- sq. feet
|
- baths - beds |
show details | |

|
#20
Old Meeting House Rd
East Falmouth, MA 02536
|
- sq. feet
|
- baths - beds |
show details |
| Photo | Address | Area | Beds / Baths | Price | Details |
|---|---|---|---|---|---|

|
#21
Chase Rd
Edgartown, MA 02539
|
- sq. feet
|
- baths - beds |
show details | |

|
#22
Degrass Rd
Mashpee, MA 02649
|
- sq. feet
|
- baths - beds |
show details | |

|
#23
Highwood Ln
East Falmouth, MA 02536
|
- sq. feet
|
- baths - beds |
show details | |

|
#24
Old Mystic Cir
North Falmouth, MA 02556
|
- sq. feet
|
- baths - beds |
show details | |

|
#25
Wayland Ave
Oak Bluffs, MA 02557
|
- sq. feet
|
- baths - beds |
show details | |

|
Check over 1 million property listings on Foreclosure.com!
|
browse all offers | |||

 | How Much Massachusetts Households Make Per Year: Census Data (37 replies) |
| The Best Town Commons in Massachusetts (72 replies) |
| Moving to Martha's Vineyard all year long (30 replies) |
| beach vacation in New England? (51 replies) |
| Cape Cod, Nantucket or Martha's Vineyard??? (45 replies) |
| Martha's Vineyard vs. Nantucket (4 replies) |

Household type by relationship:
Households: 16,392- In family households: 12,344 (2,346 male householders, 1,875 female householders)
3,251 spouses, 3,822 children (3,629 natural, 110 adopted, 83 stepchildren), 147 grandchildren, 104 brothers or sisters, 120 parents, foster children, 127 other relatives, 496 non-relatives
- In nonfamily households: 4,048 (1,454 male householders (1,085 living alone)), 1,693 female householders (1,379 living alone)), 901 nonrelatives
- In group quarters: 143 (87 institutionalized population)
2,365 married couples with children.
828 single-parent households (206 men, 622 women).
97.5% of residents of West Tisbury speak English at home.
1.7% of residents speak Spanish at home (100% speak English very well).
0.8% of residents speak other Indo-European language at home (100% speak English very well).
Foreign born population: 139 (5.0%)
(34.5% of them are naturalized citizens)
| Here: | 6.9 |
| State: | 6.5 |
| Here: | 4.8 |
| State: | 4.0 |

- Bedrooms in owner-occupied houses and condos in West Tisbury, Massachusetts
- 3no bedroom
- 301 bedroom
- 1542 bedrooms
- 3513 bedrooms
- 1644 bedrooms
- 695+ bedrooms

- Bedrooms in renter-occupied apartments in West Tisbury, Massachusetts
- 19no bedroom
- 571 bedroom
- 1082 bedrooms
- 483 bedrooms
- 274 bedrooms
- 45+ bedrooms

- Cars and other vehicles available in West Tisbury in owner-occupied houses/condos
- 3no vehicle
- 2491 vehicle
- 3352 vehicles
- 1253 vehicles
- 214 vehicles
- 385+ vehicles

- Cars and other vehicles available in West Tisbury in renter-occupied apartments
- 5no vehicle
- 1161 vehicle
- 1072 vehicles
- 293 vehicles
- 64 vehicles
- 05+ vehicles

- Rooms in owner-occupied houses in West Tisbury, Massachusetts
- 01 room
- 122 rooms
- 483 rooms
- 474 rooms
- 1845 rooms
- 1886 rooms
- 1157 rooms
- 938 rooms
- 849+ rooms

- Rooms in renter-occupied apartments in West Tisbury, Massachusetts
- 191 room
- 282 rooms
- 383 rooms
- 744 rooms
- 495 rooms
- 256 rooms
- 267 rooms
- 08 rooms
- 49+ rooms


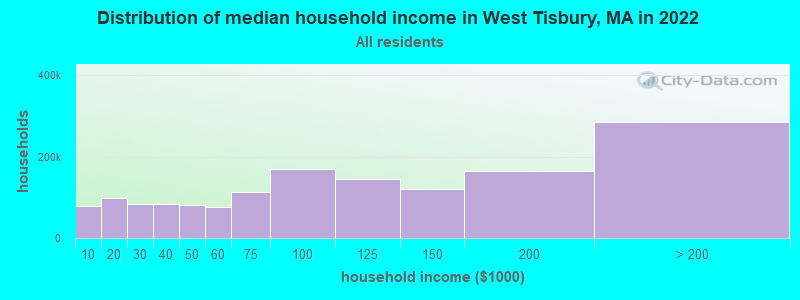
West Tisbury, MA household income distribution

- 4,944Less than $10,000
- 6,443$10,000 to $19,999
- 8,949$20,000 to $29,999
- 10,849$30,000 to $39,999
- 9,254$40,000 to $49,999
- 11,136$50,000 to $59,999
- 14,860$60,000 to $74,999
- 23,781$75,000 to $99,999
- 22,369$100,000 to $124,999
- 16,478$125,000 to $149,999
- 28,434$150,000 to $199,999
- 45,157$200,000 or more
Percentage of workers working in this county: 100.8%
Number of people working at home: 282 (18.4% of all workers)
Travel time to work (commute)
- Less than 5 minutes: 62
- 5 to 9 minutes: 192
- 10 to 14 minutes: 267
- 15 to 19 minutes: 320
- 20 to 24 minutes: 162
- 25 to 29 minutes: 4
- 30 to 34 minutes: 71
- 35 to 39 minutes: 0
- 40 to 44 minutes: 16
- 45 to 59 minutes: 5
- 60 to 89 minutes: 14
- 90 or more minutes: 37
Means of transportation to work:
- Drove a car alone: 977 (71.9%)
- Carpooled: 79 (5.8%)
- Ferryboat: 10 (0.7%)
- Bicycle: 10 (0.7%)
- Walked: 38 (2.8%)
- Other means: 36 (2.6%)
- Worked at home: 209 (15.4%)


- Year of entry for the foreign-born population in West Tisbury, Massachusetts
- 161995 to March 2000
- 91990 to 1994
- 211985 to 1989
- 01980 to 1984
- 01975 to 1979
- 121970 to 1974
- 91965 to 1969
- 23Before 1965

First ancestries reported:
- English: 659 (20.9%)
- Irish: 480 (15.2%)
- Other: 359 (11.4%)
- German: 291 (9.2%)
- United States: 279 (8.8%)
- Italian: 189 (6.0%)
- French: 170 (5.4%)
- Scottish: 159 (5.0%)
- Portuguese: 136 (4.3%)
- Polish: 89 (2.8%)
- Scotch-Irish: 59 (1.9%)
- Russian: 57 (1.8%)
- Swedish: 57 (1.8%)
- Dutch: 29 (0.9%)
- French Canadian: 27 (0.9%)
- Lithuanian: 19 (0.6%)
- Danish: 17 (0.5%)
- Greek: 17 (0.5%)
- Welsh: 17 (0.5%)
- Norwegian: 14 (0.4%)
- Ukrainian: 14 (0.4%)
- Hungarian: 12 (0.4%)
- Slovak: 5 (0.2%)
Most common places of birth for foreign-born residents (%):
| West Tisbury: | 26.7% (24) |
| Massachusetts: | 3.3% (25,403) |
| West Tisbury: | 12.2% (11) |
| Massachusetts: | 0.1% (417) |
| West Tisbury: | 11.1% (10) |
| Massachusetts: | 5.2% (40,247) |
| West Tisbury: | 8.9% (8) |
| Massachusetts: | 0.2% (1,617) |
| West Tisbury: | 6.7% (6) |
| Massachusetts: | 1.7% (12,975) |
| West Tisbury: | 5.6% (5) |
| Massachusetts: | 2.3% (17,987) |
| West Tisbury: | 5.6% (5) |
| Massachusetts: | 8.6% (66,627) |
| West Tisbury: | 5.6% (5) |
| Massachusetts: | 0.3% (1,943) |
| West Tisbury: | 4.4% (4) |
| Massachusetts: | 0.3% (2,135) |
| West Tisbury: | 4.4% (4) |
| Massachusetts: | 0.2% (1,303) |
| West Tisbury: | 4.4% (4) |
| Massachusetts: | 0.5% (3,868) |
| West Tisbury: | 4.4% (4) |
| Massachusetts: | 0.4% (3,066) |
Place of birth for U.S.-born residents:
- This state: 1,365
- Other state: 993
- Northeast: 709
- Midwest: 124
- South: 81
- West: 79
65% of West Tisbury residents lived in the same house 5 years ago.
Out of people who lived in different houses, 63% lived in this county.
Out of people who lived in different counties, 40% lived in Massachusetts.
Education attainment for males 25 years and older:
- No schooling: 0
- Nursery to 4th grade: 4
- 5th and 6th grade: 0
- 7th and 8th grade: 0
- 9th grade: 0
- 10th grade: 14
- 11th grade: 15
- 12th grade, no diploma: 12
- High school graduate (or equivalency): 160
- Less than 1 year of college: 9
- Some college more than 1 year, no degree: 146
- Associate degree: 69
- Bachelor's degree: 251
- Master's degree: 102
- Professional school degree: 24
- Doctorate degree: 24

Education attainment for females 25 years and older:
- No schooling: 0
- Nursery to 4th grade: 0
- 5th and 6th grade: 0
- 7th and 8th grade: 0
- 9th grade: 0
- 10th grade: 5
- 11th grade: 1
- 12th grade, no diploma: 9
- High school graduate (or equivalency): 132
- Less than 1 year of college: 21
- Some college more than 1 year, no degree: 153
- Associate degree: 63
- Bachelor's degree: 368
- Master's degree: 108
- Professional school degree: 26
- Doctorate degree: 12


Housing units in structures:
- One, detached: 1,774
- One, attached: 22
- Two: 31
- 3 or 4: 17
- Boats, RVs, vans, etc.: 5
Housing units lacking complete kitchen facilities: 0.8%

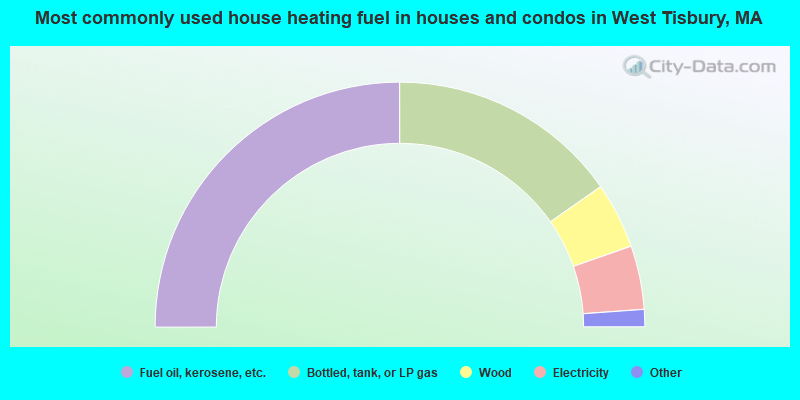
- 49.9%Fuel oil, kerosene, etc.
- 30.6%Bottled, tank, or LP gas
- 8.7%Wood
- 8.4%Electricity
- 1.3%Solar energy
- 0.5%Utility gas
- 0.5%Coal or coke
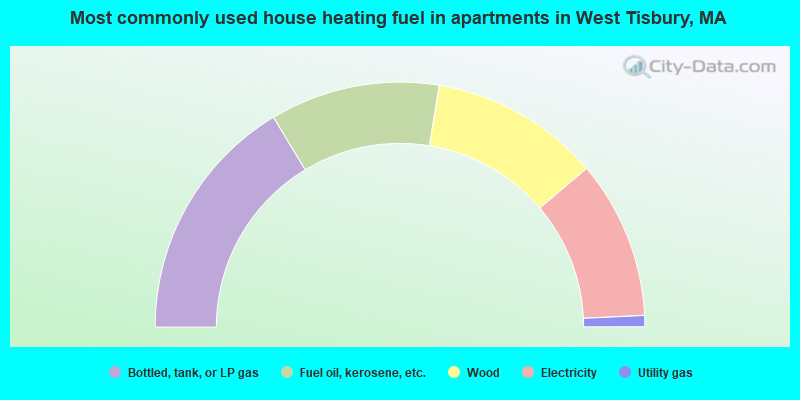
- 32.7%Bottled, tank, or LP gas
- 22.4%Fuel oil, kerosene, etc.
- 22.4%Wood
- 20.9%Electricity
- 1.5%Utility gas
Private vs. public school enrollment:
| Here: | 0.0% |
| Massachusetts: | 10.8% |
| Here: | 7.2% |
| Massachusetts: | 12.2% |
| Here: | 57.7% |
| Massachusetts: | 48.2% |


