West Whittier-Los Nietos, CA (California) Houses and Residents
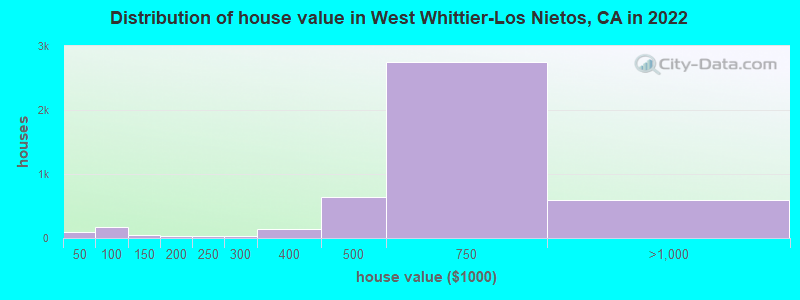
Estimated median house or condo value in 2022: $642,213 (it was $164,800 in 2000 )
West Whittier-Los Nietos:
$642,213California:
$715,900
Lower value quartile - upper value quartile: $510,253 - $753,426Mean price in 2022: Detached houses: $672,315 Here:
$672,315State:
$988,808
Townhouses or other attached units: $729,481 Here:
$729,481State:
$838,546
In 2-unit structures: $1,919,853 Here:
$1,919,853State:
$1,138,100
In 5-or-more-unit structures: $461,258 Here:
$461,258State:
$730,996
Mobile homes: $175,384 Here:
$175,384State:
$184,506
Total population: 25,540 (Urban population: 25,149, Rural population: 0)
Houses: 7,068 (6,858 occupied: 5,175 owner occupied, 1,709 renter occupied )
% of renters here:
25%State:
44%
Housing density: 2,812 houses/condos per square mile
Median price asked for vacant for-sale houses and condos in 2022: $616,869.
Median contract rent in 2022: $1,600 (lower quartile is $1,250, upper quartile is over $2,000)
Median rent asked for vacant for-rent units in 2022: $1,742
Median gross rent in West Whittier-Los Nietos, CA in 2022: $1,816
Housing units in West Whittier-Los Nietos with a mortgage: 3,346 (313 second mortgage, 7 home equity loan, 275 both second mortgage and home equity loan )Houses without a mortgage: 16
Median household income for houses/condos with a mortgage: $110,092
Median household income for apartments without a mortgage: $82,754
Median monthly housing costs: $1,771
Data:
Median house or condo value ($)
Median house or condo value ($ change since 2000)
Median house or condo value ($) - White
Median house or condo value ($) - Black or African American
Median house or condo value ($) - Asian
Median house or condo value ($) - Hispanic or Latino
Median house or condo value ($) - American Indian and Alaska Native
Median house or condo value ($) - Multirace
Median house or condo value ($) - Other Race
Median price asked for mobile homes ($)
Household density (households per square mile)
Mean house or condo value by units in structure - 1, detached ($)
Mean house or condo value by units in structure - 1, attached ($)
Mean house or condo value by units in structure - 2 ($)
Mean house or condo value by units in structure by units in structure - 3 or 4 ($)
Mean house or condo value by units in structure - 5 or more ($)
Mean house or condo value by units in structure - Boat, RV, van, etc. ($)
Mean house or condo value by units in structure - Mobile home ($)
Median contract rent ($)
Median contract rent - Lower quartile ($)
Median contract rent - Upper quartile ($)
Median gross rent ($)
Urban houses (%)
Rural houses (%)
Houses occupied (%)
Houses occupied (% change since 2000)
Houses owner occupied (%)
Houses owner occupied (% change since 2000)
Houses renter occupied (%)
Houses renter occupied (% change since 2000)
Vacant housing units - For rent (%)
Vacant housing units - For rent (% change since 2000)
Vacant housing units - For sale only (%)
Vacant housing units - For sale only (% change since 2000)
Vacant housing units - Rented or sold, not occupied (%)
Vacant housing units - Rented or sold, not occupied (% change since 2000)
Vacant housing units - For seasonal, recreational, or occasional use (%)
Vacant housing units - For seasonal, recreational, or occasional use (% change since 2000)
Vacant housing units - For migrant workers (%)
Vacant housing units - For migrant workers (% change since 2000)
Vacant housing units - Other vacant (%)
Vacant housing units - Other vacant (% change since 2000)
Median monthly housing costs ($)
Median household income for houses/condos with a mortgage ($)
Median household income for houses/condos without a mortgage ($)
Median household income ($)
Median household income ($) - White
Median household income ($) - Black or African American
Median household income ($) - Asian
Median household income ($) - Hispanic or Latino
Median household income ($) - American Indian and Alaska Native
Median household income ($) - Multirace
Median household income ($) - Other Race
Mortgage status - with mortgage (%)
Mortgage status - with second mortgage (%)
Mortgage status - with home equity loan (%)
Mortgage status - with both second mortgage and home equity loan (%)
Mortgage status - without a mortgage (%)
Median year house/condo built
Median year apartment built
Household type by relationship - Male householder living alone (%)
Household type by relationship - Male householder not living alone (%)
Household type by relationship - Female householder living alone (%)
Household type by relationship - Female householder not living alone (%)
Household type by relationship - Opposite-Sex spouse (%)
Household type by relationship - Same-Sex spouse (%)
Household type by relationship - Opposite-Sex unmarried partner (%)
Household type by relationship - Same-Sex unmarried partner (%)
Household type by relationship - In group quarters (%)
Size of family households - 2-person household (%)
Size of family households - 3-person household (%)
Size of family households - 4-person household (%)
Size of family households - 5-person household (%)
Size of family households - 6-person household (%)
Size of family households - 7-or-more-person household (%)
Size of nonfamily households - 1-person household (%)
Size of nonfamily households - 2-person household (%)
Size of nonfamily households - 3-person household (%)
Size of nonfamily households - 4-person household (%)
Size of nonfamily households - 5-person household (%)
Size of nonfamily households - 6-person household (%)
Size of nonfamily households - 7-or-moreperson household (%)
Year house built - Built 2010 or later (%)
Year house built - Built 2000 to 2009 (%)
Year house built - Built 1990 to 1999 (%)
Year house built - Built 1980 to 1989 (%)
Year house built - Built 1970 to 1979 (%)
Year house built - Built 1960 to 1969 (%)
Year house built - Built 1950 to 1959 (%)
Year house built - Built 1940 to 1949 (%)
Year house built - Built 1939 or earlier (%)
Median number of rooms in houses and condos
Median number of rooms in apartments
Median number of bedrooms in owner occupied houses
Mean number of bedrooms in owner occupied houses
Median number of bedrooms in renter occupied houses
Mean number of bedrooms in renter occupied houses
Median number of vehichles in owner occupied houses
Mean number of vehichles in owner occupied houses
Median number of vehichles in renter occupied houses
Mean number of vehichles in renter occupied houses
Rooms in owner-occupied houses - 1 room (%)
Rooms in owner-occupied houses - 2 rooms (%)
Rooms in owner-occupied houses - 3 rooms (%)
Rooms in owner-occupied houses - 4 rooms (%)
Rooms in owner-occupied houses - 5 rooms (%)
Rooms in owner-occupied houses - 6 rooms (%)
Rooms in owner-occupied houses - 7 rooms (%)
Rooms in owner-occupied houses - 8 rooms (%)
Rooms in owner-occupied houses - 9+ rooms (%)
Rooms in renter-occupied houses - 1 room (%)
Rooms in renter-occupied houses - 2 rooms (%)
Rooms in renter-occupied houses - 3 rooms (%)
Rooms in renter-occupied houses - 4 rooms (%)
Rooms in renter-occupied houses - 5 rooms (%)
Rooms in renter-occupied houses - 6 rooms (%)
Rooms in renter-occupied houses - 7 rooms (%)
Rooms in renter-occupied houses - 8 rooms (%)
Rooms in renter-occupied houses - 9+ rooms (%)
Bedrooms in owner-occupied houses - no bedrooms (%)
Bedrooms in owner-occupied houses - 1 bedroom (%)
Bedrooms in owner-occupied houses - 2 bedrooms (%)
Bedrooms in owner-occupied houses - 3 bedrooms (%)
Bedrooms in owner-occupied houses - 4 bedrooms (%)
Bedrooms in owner-occupied houses - 5+ bedrooms (%)
Bedrooms in renter-occupied houses - no bedrooms (%)
Bedrooms in renter-occupied houses - 1 bedroom (%)
Bedrooms in renter-occupied houses - 2 bedrooms (%)
Bedrooms in renter-occupied houses - 3 bedrooms (%)
Bedrooms in renter-occupied houses - 4 bedrooms (%)
Bedrooms in renter-occupied houses - 5+ bedrooms (%)
Vehicles available in owner-occupied houses - no vehicle available (%)
Vehicles available in owner-occupied houses - 1 vehicle available(%)
Vehicles available in owner-occupied houses - 2 Vehicles available (%)
Vehicles available in owner-occupied houses - 3 Vehicles available (%)
Vehicles available in owner-occupied houses - 4 Vehicles available (%)
Vehicles available in owner-occupied houses - 5+ Vehicles available (%)
Vehicles available in renter-occupied houses - no vehicle available (%)
Vehicles available in renter-occupied houses - 1 vehicle available (%)
Vehicles available in renter-occupied houses - 2 Vehicles available (%)
Vehicles available in renter-occupied houses - 3 Vehicles available (%)
Vehicles available in renter-occupied houses - 4 Vehicles available (%)
Vehicles available in renter-occupied houses - 5+ Vehicles available (%)
Housing units in structures - 1, detached (%)
Housing units in structures - 1, attached (%)
Housing units in structures - 2 (%)
Housing units in structures - 3 or 4 (%)
Housing units in structures - 5 to 9 (%)
Housing units in structures - 10 to 19 (%)
Housing units in structures - 20 to 49 (%)
Housing units in structures - 50 or more (%)
Housing units in structures - Mobile home (%)
Housing units in structures - Boat, RV, van, etc. (%)
Housing units in structures - Owners - 1, detached (%)
Housing units in structures - Owners - 1, attached (%)
Housing units in structures - Owners - 2 (%)
Housing units in structures - Owners - 3 or 4 (%)
Housing units in structures - Owners - 5 to 9 (%)
Housing units in structures - Owners - 10 to 19 (%)
Housing units in structures - Owners - 20 to 49 (%)
Housing units in structures - Owners - 50 or more (%)
Housing units in structures - Owners - Mobile home (%)
Housing units in structures - Owners - Boat, RV, van, etc. (%)
Housing units in structures - Renters - 1, detached (%)
Housing units in structures - Renters - 1, attached (%)
Housing units in structures - Renters - 2 (%)
Housing units in structures - Renters - 3 or 4 (%)
Housing units in structures - Renters - 5 to 9 (%)
Housing units in structures - Renters - 10 to 19 (%)
Housing units in structures - Renters - 20 to 49 (%)
Housing units in structures - Renters - 50 or more (%)
Housing units in structures - Renters - Mobile home (%)
Housing units in structures - Renters - Boat, RV, van, etc. (%)
House/condo owner moved in on average (years ago)
Renter moved in on average (years ago)
Year householder moved into unit - Moved in 1999 to March 2000 (%)
Year householder moved into unit - Moved in 1999 to March 2000 (%) - White
Year householder moved into unit - Moved in 1999 to March 2000 (%) - Black or African American
Year householder moved into unit - Moved in 1999 to March 2000 (%) - Asian
Year householder moved into unit - Moved in 1999 to March 2000 (%) - Hispanic or Latino
Year householder moved into unit - Moved in 1999 to March 2000 (%) - American Indian and Alaska Native
Year householder moved into unit - Moved in 1999 to March 2000 (%) - Multirace
Year householder moved into unit - Moved in 1999 to March 2000 (%) - Other Race
Year householder moved into unit - Moved in 1995 to 1998 (%)
Year householder moved into unit - Moved in 1995 to 1998 (%) - White
Year householder moved into unit - Moved in 1995 to 1998 (%) - Black or African American
Year householder moved into unit - Moved in 1995 to 1998 (%) - Asian
Year householder moved into unit - Moved in 1995 to 1998 (%) - Hispanic or Latino
Year householder moved into unit - Moved in 1995 to 1998 (%) - American Indian and Alaska Native
Year householder moved into unit - Moved in 1995 to 1998 (%) - Multirace
Year householder moved into unit - Moved in 1995 to 1998 (%) - Other Race
Year householder moved into unit - Moved in 1990 to 1994 (%)
Year householder moved into unit - Moved in 1990 to 1994 (%) - White
Year householder moved into unit - Moved in 1990 to 1994 (%) - Black or African American
Year householder moved into unit - Moved in 1990 to 1994 (%) - Asian
Year householder moved into unit - Moved in 1990 to 1994 (%) - Hispanic or Latino
Year householder moved into unit - Moved in 1990 to 1994 (%) - American Indian and Alaska Native
Year householder moved into unit - Moved in 1990 to 1994 (%) - Multirace
Year householder moved into unit - Moved in 1990 to 1994 (%) - Other Race
Year householder moved into unit - Moved in 1980 to 1989 (%)
Year householder moved into unit - Moved in 1980 to 1989 (%) - White
Year householder moved into unit - Moved in 1980 to 1989 (%) - Black or African American
Year householder moved into unit - Moved in 1980 to 1989 (%) - Asian
Year householder moved into unit - Moved in 1980 to 1989 (%) - Hispanic or Latino
Year householder moved into unit - Moved in 1980 to 1989 (%) - American Indian and Alaska Native
Year householder moved into unit - Moved in 1980 to 1989 (%) - Multirace
Year householder moved into unit - Moved in 1980 to 1989 (%) - Other Race
Year householder moved into unit - Moved in 1970 to 1979 (%)
Year householder moved into unit - Moved in 1970 to 1979 (%) - White
Year householder moved into unit - Moved in 1970 to 1979 (%) - Black or African American
Year householder moved into unit - Moved in 1970 to 1979 (%) - Asian
Year householder moved into unit - Moved in 1970 to 1979 (%) - Hispanic or Latino
Year householder moved into unit - Moved in 1970 to 1979 (%) - American Indian and Alaska Native
Year householder moved into unit - Moved in 1970 to 1979 (%) - Multirace
Year householder moved into unit - Moved in 1970 to 1979 (%) - Other Race
Year householder moved into unit - Moved in 1969 or earlier (%)
Year householder moved into unit - Moved in 1969 or earlier (%) - White
Year householder moved into unit - Moved in 1969 or earlier (%) - Black or African American
Year householder moved into unit - Moved in 1969 or earlier (%) - Asian
Year householder moved into unit - Moved in 1969 or earlier (%) - Hispanic or Latino
Year householder moved into unit - Moved in 1969 or earlier (%) - American Indian and Alaska Native
Year householder moved into unit - Moved in 1969 or earlier (%) - Multirace
Year householder moved into unit - Moved in 1969 or earlier (%) - Other Race
Housing units lacking complete plumbing facilities (%)
Housing units lacking complete kitchen facilities (%)
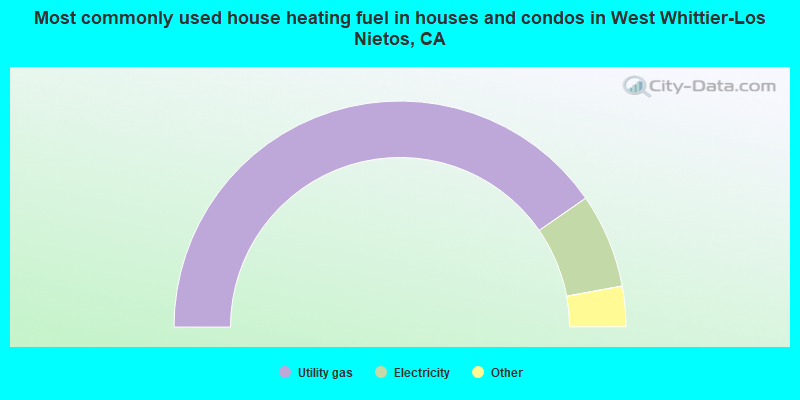
House heating fuel used in houses and condos - Utility gas (%)
House heating fuel used in houses and condos - Bottled, tank, or LP gas (%)
House heating fuel used in houses and condos - Electricity (%)
House heating fuel used in houses and condos - Fuel oil, kerosene, etc. (%)
House heating fuel used in houses and condos - Coal or coke (%)
House heating fuel used in houses and condos - Wood (%)
House heating fuel used in houses and condos - Solar energy (%)
House heating fuel used in houses and condos - Other fuel (%)
House heating fuel used in houses and condos - No fuel used (%)
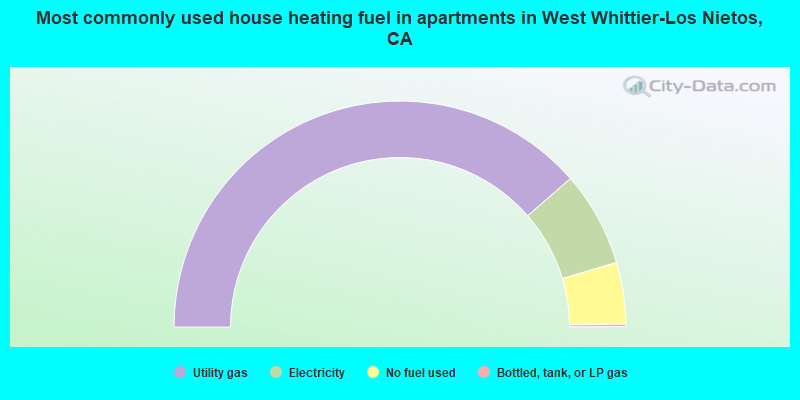
House heating fuel used in apartments - Utility gas (%)
House heating fuel used in apartments - Bottled, tank, or LP gas (%)
House heating fuel used in apartments - Electricity (%)
House heating fuel used in apartments - Fuel oil, kerosene, etc. (%)
House heating fuel used in apartments - Coal or coke (%)
House heating fuel used in apartments - Wood (%)
House heating fuel used in apartments - Solar energy (%)
House heating fuel used in apartments - Other fuel (%)
House heating fuel used in apartments - No fuel used (%)
Median year house/condo built: 1954Median year apartment built: 1955Household type by relationship:
Households: 24,890
Male householders: 3,267 (397 living alone ), Female householders: 3,364 (578 living alone )3,878 spouses (3,822 opposite-sex spouses ), 402 unmarried partners , (402 opposite-sex unmarried partners ), 8,927 children (8,430 natural , 35 adopted , 461 stepchildren ), 1,301 grandchildren , 476 brothers or sisters , 1,106 parents , 69 foster children , 1,164 other relatives , 792 non-relatives In group quarters: 139
Size of family households: 1,540 2-persons , 1,064 3-persons , 1,110 4-persons , 948 5-persons , 374 6-persons , 566 7-or-more-persons .
Size of nonfamily households: 1,046 1-person , 118 2-persons , 6 3-persons , 6 4-persons , 14 5-persons .
2,944 married couples with children. single-parent households (282 men , 834 women ).
35.5% of residents of West Whittier-Los Nietos speak English at home. of residents speak Spanish at home (72% speak English very well , 10% speak English well , 11% speak English not well , 6% don't speak English at all ).of residents speak other Indo-European language at home (100% speak English very well ).of residents speak Asian or Pacific Island language at home (73% speak English very well , 19% speak English well , 7% speak English not well ).of residents speak other language at home (62% speak English well , 38% speak English not well ).
Foreign born population: 6,220 (25.0%)of them are naturalized citizens )
Median number of rooms in houses and condos:
Median number of rooms in apartments
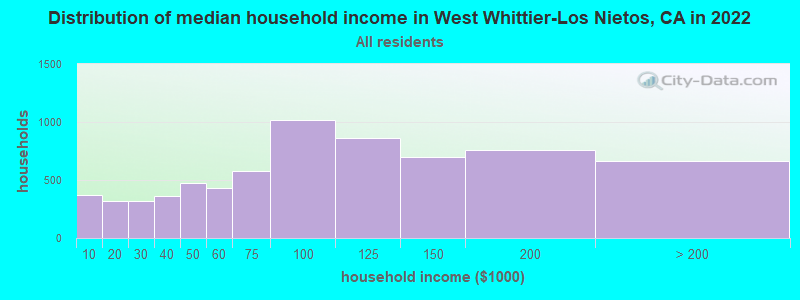
West Whittier-Los Nietos, CA household income distribution 373 Less than $10,000322 $10,000 to $19,999320 $20,000 to $29,999362 $30,000 to $39,999474 $40,000 to $49,999430 $50,000 to $59,999581 $60,000 to $74,9991,020 $75,000 to $99,999864 $100,000 to $124,999701 $125,000 to $149,999756 $150,000 to $199,999661 $200,000 or more
Home value of owner - occupied houses in 2022 in West Whittier-Los Nietos, CA 16 Less than $10,00048 $10,000 to $14,9996 $20,000 to $24,99910 $35,000 to $39,99910 $40,000 to $49,99927 $50,000 to $59,99924 $60,000 to $69,99929 $70,000 to $79,99957 $80,000 to $89,99926 $90,000 to $99,99929 $100,000 to $124,99911 $125,000 to $149,99927 $150,000 to $174,99928 $200,000 to $249,99928 $250,000 to $299,999147 $300,000 to $399,999641 $400,000 to $499,9992,752 $500,000 to $749,999558 $750,000 to $999,99928 $1,000,000 to $1,499,999Rent paid by renters in 2022 in West Whittier-Los Nietos, CA 9 $250 to $2994 $300 to $34911 $350 to $3993 $550 to $59921 $650 to $69943 $700 to $74915 $750 to $79947 $800 to $89954 $900 to $999181 $1,000 to $1,249313 $1,250 to $1,499396 $1,500 to $1,999365 $2,000 to $2,49934 $2,500 to $2,99967 $3,000 to $3,499135 No cash rent
Percentage of workers working in this county: 86.9%Number of people working at home: 1,418 (12.6% of all workers )
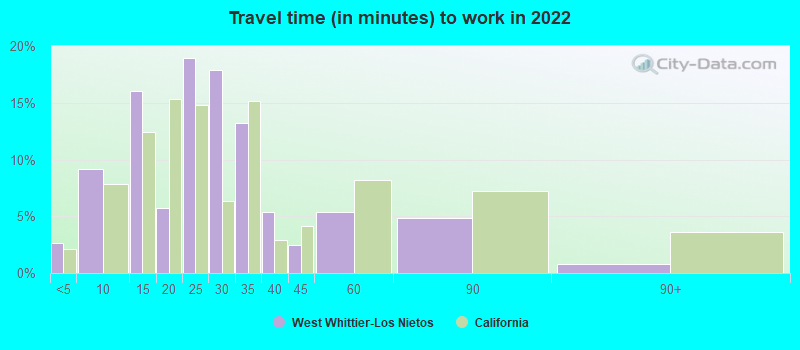
Travel time to work (commute)
Less than 5 minutes: 1335 to 9 minutes: 77110 to 14 minutes: 94615 to 19 minutes: 1,04320 to 24 minutes: 1,19525 to 29 minutes: 63030 to 34 minutes: 2,06835 to 39 minutes: 70540 to 44 minutes: 27745 to 59 minutes: 89860 to 89 minutes: 70490 or more minutes: 394
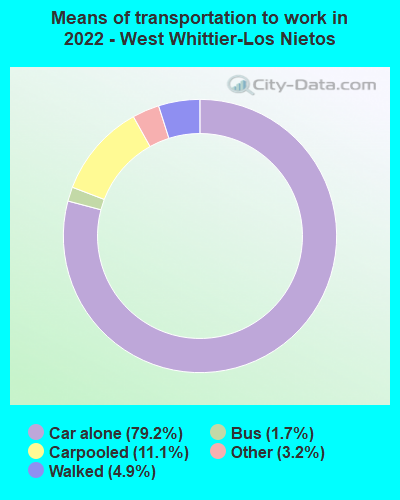
Means of transportation to work:
Drove a car alone: 1,275 (45.6%)Carpooled: 197 (7.0%)Bus : 25 (0.9%)Taxi: 56 (2.0%)Walked: 84 (3.0%)Worked at home: 1,418 (50.7%)
Unemployment by race in 2022
Unemployment rate for White non-Hispanic residents 7.9% Males1.8% FemalesUnemployment rate for Black residents 20.9% FemalesUnemployment rate for American Indian and Alaska Native residents 25.2% FemalesUnemployment rate for Asian residents 8.4% MalesUnemployment rate for other race residents 2.8% Males1.8% FemalesUnemployment rate for two or more race residents 5.8% Males3.7% FemalesUnemployment rate for Hispanic or Latino residents 3.6% Males2.7% Females
Year of entry for the foreign-born population in West Whittier-Los Nietos, California
416 2010 or later 893 2000 to 2009 857 1990 to 1999 1,997 1980 to 1989 2,241 1970 to 1979 1,392 Before 1970
First ancestries reported:
American: 650 (3.5%)
German: 143 (0.8%)
English: 126 (0.7%)
Italian: 74 (0.4%)
Irish: 47 (0.3%)
European: 30 (0.2%)
Russian: 30 (0.2%)
Lebanese: 24 (0.1%)
Dutch: 24 (0.1%)
Polish: 19 (0.1%)
Armenian: 18 (0.10%)
Belgian: 12 (0.07%)
Scandinavian: 12 (0.07%)
French: 10 (0.05%)
Scotch-Irish: 7 (0.04%)
Swedish: 6 (0.03%)
Moroccan: 5 (0.03%)
African: 5 (0.03%) Most common places of birth for foreign-born residents (%): Mexico West Whittier-Los Nietos:
75.6% (4,705)California:
37.2% (3,881,193)
El Salvador West Whittier-Los Nietos:
5.1% (319)California:
4.2% (440,287)
Guatemala West Whittier-Los Nietos:
5.0% (309)California:
2.8% (290,436)
Philippines West Whittier-Los Nietos:
2.9% (183)California:
7.8% (818,297)
India West Whittier-Los Nietos:
2.3% (144)California:
5.2% (539,184)
Place of birth for U.S.-born residents:
This state: 17,595Other state: 1,016Northeast: 139Midwest: 339South: 349West: 179 96.2% of West Whittier-Los Nietos residents lived in the same house 1 years ago.
Out of people who lived in different houses, 43.9% lived in this county.
Out of people who lived in different counties, 48.9% lived in California.
West Whittier-Los Nietos:
96.2%State average:
88.9%
Education attainment for males 25 years and older:
No schooling: 517Nursery to 4th grade: 895th and 6th grade: 3477th and 8th grade: 1959th grade: 11410th grade: 19111th grade: 22512th grade, no diploma: 698High school graduate (or equivalency): 2,721Less than 1 year of college: 562Some college more than 1 year, no degree: 1,348Associate degree: 719Bachelor's degree: 919Master's degree: 203Professional school degree: 110Doctorate degree: 6
Education attainment for females 25 years and older:
No schooling: 659Nursery to 4th grade: 1285th and 6th grade: 3697th and 8th grade: 1429th grade: 12810th grade: 7111th grade: 28512th grade, no diploma: 302High school graduate (or equivalency): 2,313Less than 1 year of college: 554Some college more than 1 year, no degree: 1,189Associate degree: 826Bachelor's degree: 1,312Master's degree: 356Professional school degree: 70Doctorate degree: 45
Housing units in structures:
One, detached: 5,943One, attached: 187Two: 73 or 4: 425 to 9: 8310 to 19: 18520 to 49: 19850 or more: 65Mobile homes: 355Median worth of mobile homes: $115,762
Housing units lacking complete kitchen facilities in 2022: 0.5%House/condo owner moved in on average 20 years ago
Renter moved in on average 8 years ago
Private vs. public school enrollment:
Students in private schools in grades 1 to 8 (elementary and middle school): 183 Here:
8.8%California:
10.5%
Students in private schools in grades 9 to 12 (high school): 26 Students in private undergraduate colleges: 427 Here:
26.7%California:
15.9%