Westerly, RI (Rhode Island) Houses and Residents
Estimated median house or condo value in 2022: $426,806 (it was $144,600 in 2000 )
Westerly:
$426,806Rhode Island:
$383,900
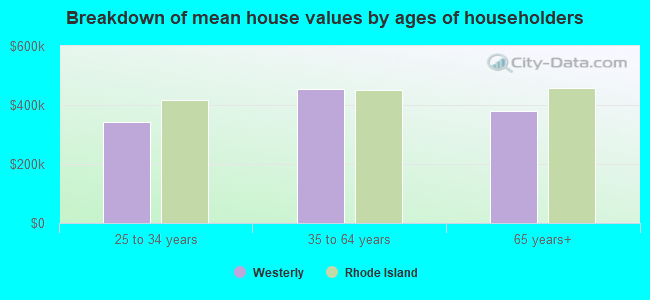
Lower value quartile - upper value quartile: $349,901 - $534,208Mean price in 2022: Detached houses: $483,837 Here:
$483,837State:
$445,354
Townhouses or other attached units: $411,341 Here:
$411,341State:
$371,092
In 2-unit structures: $296,660 Here:
$296,660State:
$317,098
In 3-to-4-unit structures: $408,460 Here:
$408,460State:
$315,052
In 5-or-more-unit structures: $210,420 Here:
$210,420State:
$291,252
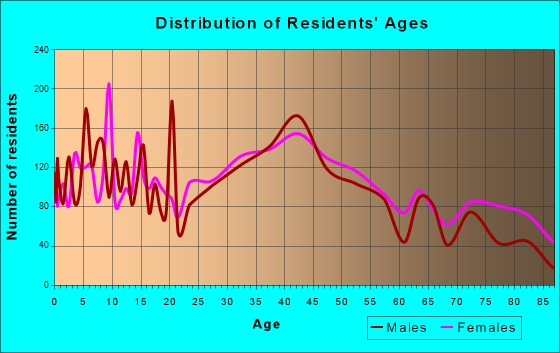
Total population: 17,936 (Urban population: 16,546 (all inside urban clusters), Rural population: 1,152 (20 farm, 1,132 nonfarm ))
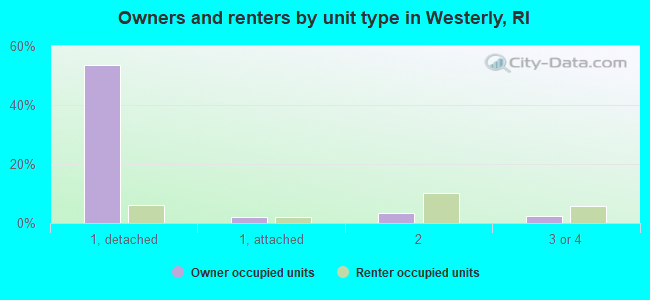
Houses: 9,414 (8,314 occupied: 5,971 owner occupied, 2,524 renter occupied )
% of renters here:
30%State:
37%
Housing density: 589 houses/condos per square mile
Median price asked for vacant for-sale houses and condos in 2022: $248,005.
Median contract rent in 2022: $1,128 (lower quartile is $847, upper quartile is $1,506)
Median rent asked for vacant for-rent units in 2022: $1,079
Median gross rent in Westerly, RI in 2022: $1,303
Housing units in Westerly with a mortgage: 3,791 (562 second mortgage, 0 home equity loan, 459 both second mortgage and home equity loan )Houses without a mortgage: 336
Median household income for houses/condos with a mortgage: $121,551
Median household income for apartments without a mortgage: $71,608
Median monthly housing costs: $1,362
Data:
Median house or condo value ($)
Median house or condo value ($ change since 2000)
Median house or condo value ($) - White
Median house or condo value ($) - Black or African American
Median house or condo value ($) - Asian
Median house or condo value ($) - Hispanic or Latino
Median house or condo value ($) - American Indian and Alaska Native
Median house or condo value ($) - Multirace
Median house or condo value ($) - Other Race
Median price asked for mobile homes ($)
Household density (households per square mile)
Mean house or condo value by units in structure - 1, detached ($)
Mean house or condo value by units in structure - 1, attached ($)
Mean house or condo value by units in structure - 2 ($)
Mean house or condo value by units in structure by units in structure - 3 or 4 ($)
Mean house or condo value by units in structure - 5 or more ($)
Mean house or condo value by units in structure - Boat, RV, van, etc. ($)
Mean house or condo value by units in structure - Mobile home ($)
Median contract rent ($)
Median contract rent - Lower quartile ($)
Median contract rent - Upper quartile ($)
Median gross rent ($)
Urban houses (%)
Rural houses (%)
Houses occupied (%)
Houses occupied (% change since 2000)
Houses owner occupied (%)
Houses owner occupied (% change since 2000)
Houses renter occupied (%)
Houses renter occupied (% change since 2000)
Vacant housing units - For rent (%)
Vacant housing units - For rent (% change since 2000)
Vacant housing units - For sale only (%)
Vacant housing units - For sale only (% change since 2000)
Vacant housing units - Rented or sold, not occupied (%)
Vacant housing units - Rented or sold, not occupied (% change since 2000)
Vacant housing units - For seasonal, recreational, or occasional use (%)
Vacant housing units - For seasonal, recreational, or occasional use (% change since 2000)
Vacant housing units - For migrant workers (%)
Vacant housing units - For migrant workers (% change since 2000)
Vacant housing units - Other vacant (%)
Vacant housing units - Other vacant (% change since 2000)
Median monthly housing costs ($)
Median household income for houses/condos with a mortgage ($)
Median household income for houses/condos without a mortgage ($)
Median household income ($)
Median household income ($) - White
Median household income ($) - Black or African American
Median household income ($) - Asian
Median household income ($) - Hispanic or Latino
Median household income ($) - American Indian and Alaska Native
Median household income ($) - Multirace
Median household income ($) - Other Race
Mortgage status - with mortgage (%)
Mortgage status - with second mortgage (%)
Mortgage status - with home equity loan (%)
Mortgage status - with both second mortgage and home equity loan (%)
Mortgage status - without a mortgage (%)
Median year house/condo built
Median year apartment built
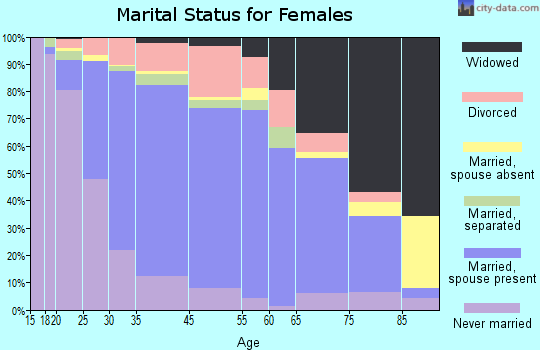
Household type by relationship - Male householder living alone (%)
Household type by relationship - Male householder not living alone (%)
Household type by relationship - Female householder living alone (%)
Household type by relationship - Female householder not living alone (%)
Household type by relationship - Opposite-Sex spouse (%)
Household type by relationship - Same-Sex spouse (%)
Household type by relationship - Opposite-Sex unmarried partner (%)
Household type by relationship - Same-Sex unmarried partner (%)
Household type by relationship - In group quarters (%)
Size of family households - 2-person household (%)
Size of family households - 3-person household (%)
Size of family households - 4-person household (%)
Size of family households - 5-person household (%)
Size of family households - 6-person household (%)
Size of family households - 7-or-more-person household (%)
Size of nonfamily households - 1-person household (%)
Size of nonfamily households - 2-person household (%)
Size of nonfamily households - 3-person household (%)
Size of nonfamily households - 4-person household (%)
Size of nonfamily households - 5-person household (%)
Size of nonfamily households - 6-person household (%)
Size of nonfamily households - 7-or-moreperson household (%)
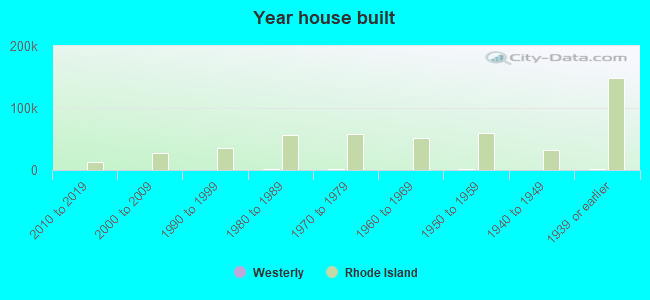
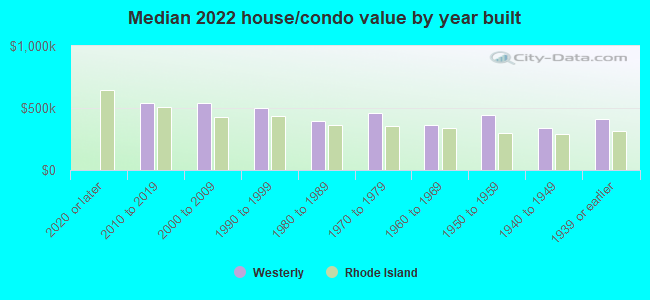
Year house built - Built 2010 or later (%)
Year house built - Built 2000 to 2009 (%)
Year house built - Built 1990 to 1999 (%)
Year house built - Built 1980 to 1989 (%)
Year house built - Built 1970 to 1979 (%)
Year house built - Built 1960 to 1969 (%)
Year house built - Built 1950 to 1959 (%)
Year house built - Built 1940 to 1949 (%)
Year house built - Built 1939 or earlier (%)
Median number of rooms in houses and condos
Median number of rooms in apartments
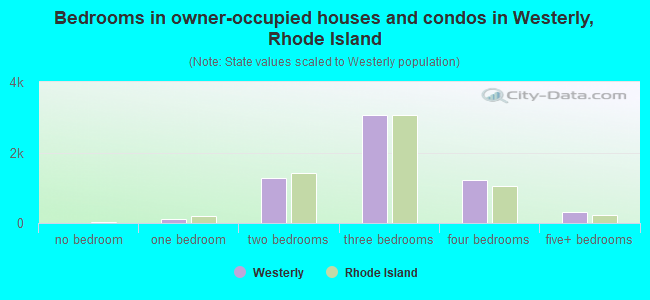
Median number of bedrooms in owner occupied houses
Mean number of bedrooms in owner occupied houses
Median number of bedrooms in renter occupied houses
Mean number of bedrooms in renter occupied houses
Median number of vehichles in owner occupied houses
Mean number of vehichles in owner occupied houses
Median number of vehichles in renter occupied houses
Mean number of vehichles in renter occupied houses
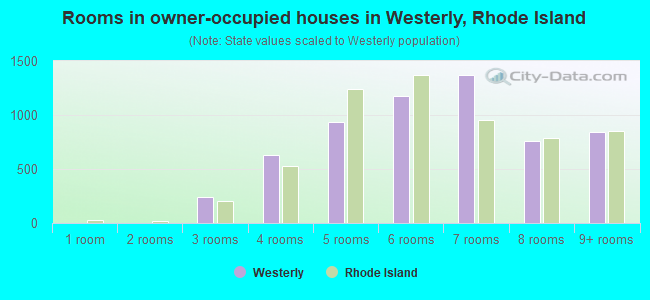
Rooms in owner-occupied houses - 1 room (%)
Rooms in owner-occupied houses - 2 rooms (%)
Rooms in owner-occupied houses - 3 rooms (%)
Rooms in owner-occupied houses - 4 rooms (%)
Rooms in owner-occupied houses - 5 rooms (%)
Rooms in owner-occupied houses - 6 rooms (%)
Rooms in owner-occupied houses - 7 rooms (%)
Rooms in owner-occupied houses - 8 rooms (%)
Rooms in owner-occupied houses - 9+ rooms (%)
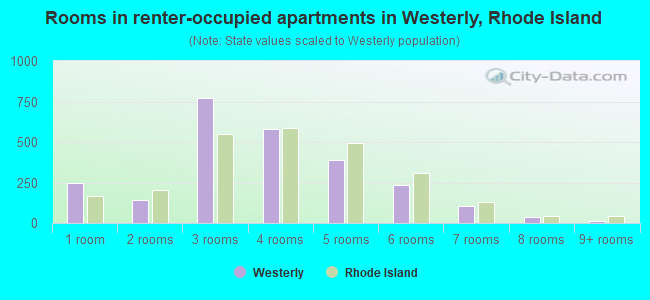
Rooms in renter-occupied houses - 1 room (%)
Rooms in renter-occupied houses - 2 rooms (%)
Rooms in renter-occupied houses - 3 rooms (%)
Rooms in renter-occupied houses - 4 rooms (%)
Rooms in renter-occupied houses - 5 rooms (%)
Rooms in renter-occupied houses - 6 rooms (%)
Rooms in renter-occupied houses - 7 rooms (%)
Rooms in renter-occupied houses - 8 rooms (%)
Rooms in renter-occupied houses - 9+ rooms (%)
Bedrooms in owner-occupied houses - no bedrooms (%)
Bedrooms in owner-occupied houses - 1 bedroom (%)
Bedrooms in owner-occupied houses - 2 bedrooms (%)
Bedrooms in owner-occupied houses - 3 bedrooms (%)
Bedrooms in owner-occupied houses - 4 bedrooms (%)
Bedrooms in owner-occupied houses - 5+ bedrooms (%)
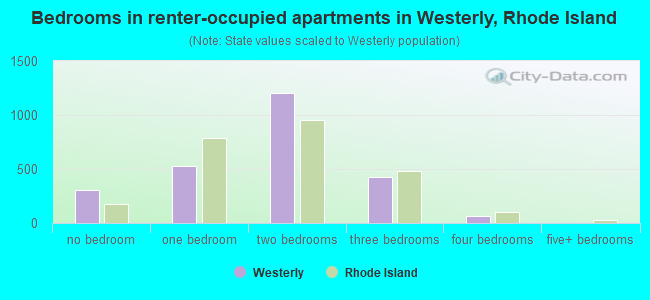
Bedrooms in renter-occupied houses - no bedrooms (%)
Bedrooms in renter-occupied houses - 1 bedroom (%)
Bedrooms in renter-occupied houses - 2 bedrooms (%)
Bedrooms in renter-occupied houses - 3 bedrooms (%)
Bedrooms in renter-occupied houses - 4 bedrooms (%)
Bedrooms in renter-occupied houses - 5+ bedrooms (%)
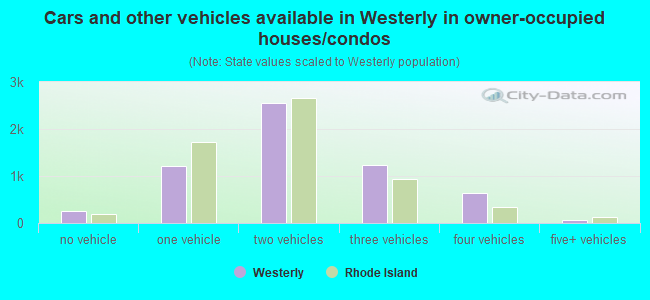
Vehicles available in owner-occupied houses - no vehicle available (%)
Vehicles available in owner-occupied houses - 1 vehicle available(%)
Vehicles available in owner-occupied houses - 2 Vehicles available (%)
Vehicles available in owner-occupied houses - 3 Vehicles available (%)
Vehicles available in owner-occupied houses - 4 Vehicles available (%)
Vehicles available in owner-occupied houses - 5+ Vehicles available (%)
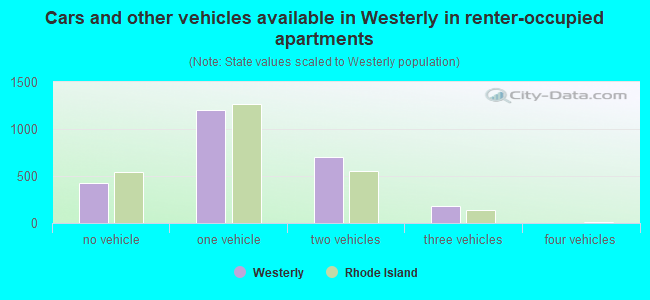
Vehicles available in renter-occupied houses - no vehicle available (%)
Vehicles available in renter-occupied houses - 1 vehicle available (%)
Vehicles available in renter-occupied houses - 2 Vehicles available (%)
Vehicles available in renter-occupied houses - 3 Vehicles available (%)
Vehicles available in renter-occupied houses - 4 Vehicles available (%)
Vehicles available in renter-occupied houses - 5+ Vehicles available (%)
Housing units in structures - 1, detached (%)
Housing units in structures - 1, attached (%)
Housing units in structures - 2 (%)
Housing units in structures - 3 or 4 (%)
Housing units in structures - 5 to 9 (%)
Housing units in structures - 10 to 19 (%)
Housing units in structures - 20 to 49 (%)
Housing units in structures - 50 or more (%)
Housing units in structures - Mobile home (%)
Housing units in structures - Boat, RV, van, etc. (%)
Housing units in structures - Owners - 1, detached (%)
Housing units in structures - Owners - 1, attached (%)
Housing units in structures - Owners - 2 (%)
Housing units in structures - Owners - 3 or 4 (%)
Housing units in structures - Owners - 5 to 9 (%)
Housing units in structures - Owners - 10 to 19 (%)
Housing units in structures - Owners - 20 to 49 (%)
Housing units in structures - Owners - 50 or more (%)
Housing units in structures - Owners - Mobile home (%)
Housing units in structures - Owners - Boat, RV, van, etc. (%)
Housing units in structures - Renters - 1, detached (%)
Housing units in structures - Renters - 1, attached (%)
Housing units in structures - Renters - 2 (%)
Housing units in structures - Renters - 3 or 4 (%)
Housing units in structures - Renters - 5 to 9 (%)
Housing units in structures - Renters - 10 to 19 (%)
Housing units in structures - Renters - 20 to 49 (%)
Housing units in structures - Renters - 50 or more (%)
Housing units in structures - Renters - Mobile home (%)
Housing units in structures - Renters - Boat, RV, van, etc. (%)
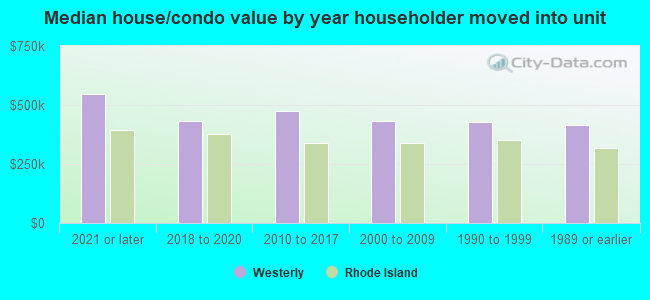
House/condo owner moved in on average (years ago)
Renter moved in on average (years ago)
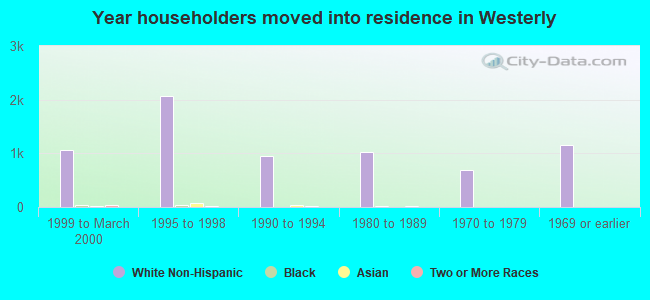
Year householder moved into unit - Moved in 1999 to March 2000 (%)
Year householder moved into unit - Moved in 1999 to March 2000 (%) - White
Year householder moved into unit - Moved in 1999 to March 2000 (%) - Black or African American
Year householder moved into unit - Moved in 1999 to March 2000 (%) - Asian
Year householder moved into unit - Moved in 1999 to March 2000 (%) - Hispanic or Latino
Year householder moved into unit - Moved in 1999 to March 2000 (%) - American Indian and Alaska Native
Year householder moved into unit - Moved in 1999 to March 2000 (%) - Multirace
Year householder moved into unit - Moved in 1999 to March 2000 (%) - Other Race
Year householder moved into unit - Moved in 1995 to 1998 (%)
Year householder moved into unit - Moved in 1995 to 1998 (%) - White
Year householder moved into unit - Moved in 1995 to 1998 (%) - Black or African American
Year householder moved into unit - Moved in 1995 to 1998 (%) - Asian
Year householder moved into unit - Moved in 1995 to 1998 (%) - Hispanic or Latino
Year householder moved into unit - Moved in 1995 to 1998 (%) - American Indian and Alaska Native
Year householder moved into unit - Moved in 1995 to 1998 (%) - Multirace
Year householder moved into unit - Moved in 1995 to 1998 (%) - Other Race
Year householder moved into unit - Moved in 1990 to 1994 (%)
Year householder moved into unit - Moved in 1990 to 1994 (%) - White
Year householder moved into unit - Moved in 1990 to 1994 (%) - Black or African American
Year householder moved into unit - Moved in 1990 to 1994 (%) - Asian
Year householder moved into unit - Moved in 1990 to 1994 (%) - Hispanic or Latino
Year householder moved into unit - Moved in 1990 to 1994 (%) - American Indian and Alaska Native
Year householder moved into unit - Moved in 1990 to 1994 (%) - Multirace
Year householder moved into unit - Moved in 1990 to 1994 (%) - Other Race
Year householder moved into unit - Moved in 1980 to 1989 (%)
Year householder moved into unit - Moved in 1980 to 1989 (%) - White
Year householder moved into unit - Moved in 1980 to 1989 (%) - Black or African American
Year householder moved into unit - Moved in 1980 to 1989 (%) - Asian
Year householder moved into unit - Moved in 1980 to 1989 (%) - Hispanic or Latino
Year householder moved into unit - Moved in 1980 to 1989 (%) - American Indian and Alaska Native
Year householder moved into unit - Moved in 1980 to 1989 (%) - Multirace
Year householder moved into unit - Moved in 1980 to 1989 (%) - Other Race
Year householder moved into unit - Moved in 1970 to 1979 (%)
Year householder moved into unit - Moved in 1970 to 1979 (%) - White
Year householder moved into unit - Moved in 1970 to 1979 (%) - Black or African American
Year householder moved into unit - Moved in 1970 to 1979 (%) - Asian
Year householder moved into unit - Moved in 1970 to 1979 (%) - Hispanic or Latino
Year householder moved into unit - Moved in 1970 to 1979 (%) - American Indian and Alaska Native
Year householder moved into unit - Moved in 1970 to 1979 (%) - Multirace
Year householder moved into unit - Moved in 1970 to 1979 (%) - Other Race
Year householder moved into unit - Moved in 1969 or earlier (%)
Year householder moved into unit - Moved in 1969 or earlier (%) - White
Year householder moved into unit - Moved in 1969 or earlier (%) - Black or African American
Year householder moved into unit - Moved in 1969 or earlier (%) - Asian
Year householder moved into unit - Moved in 1969 or earlier (%) - Hispanic or Latino
Year householder moved into unit - Moved in 1969 or earlier (%) - American Indian and Alaska Native
Year householder moved into unit - Moved in 1969 or earlier (%) - Multirace
Year householder moved into unit - Moved in 1969 or earlier (%) - Other Race
Housing units lacking complete plumbing facilities (%)
Housing units lacking complete kitchen facilities (%)
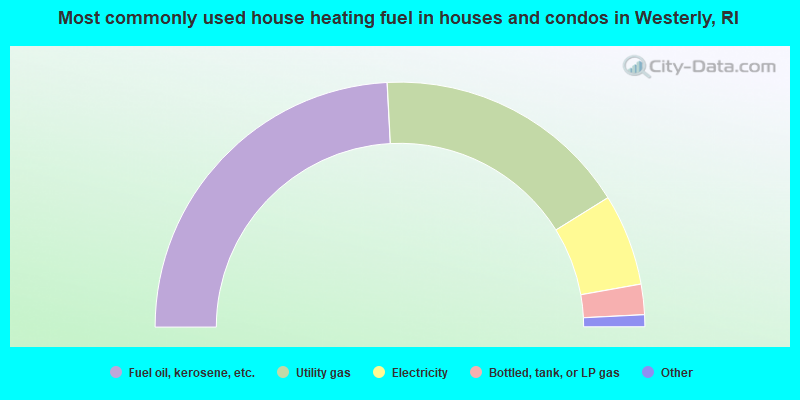
House heating fuel used in houses and condos - Utility gas (%)
House heating fuel used in houses and condos - Bottled, tank, or LP gas (%)
House heating fuel used in houses and condos - Electricity (%)
House heating fuel used in houses and condos - Fuel oil, kerosene, etc. (%)
House heating fuel used in houses and condos - Coal or coke (%)
House heating fuel used in houses and condos - Wood (%)
House heating fuel used in houses and condos - Solar energy (%)
House heating fuel used in houses and condos - Other fuel (%)
House heating fuel used in houses and condos - No fuel used (%)
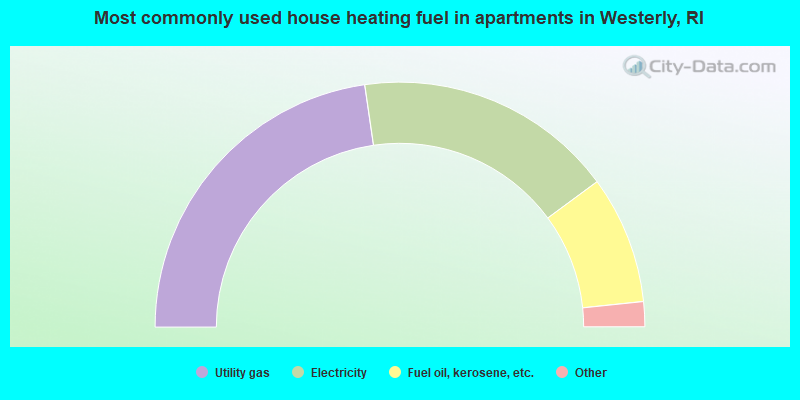
House heating fuel used in apartments - Utility gas (%)
House heating fuel used in apartments - Bottled, tank, or LP gas (%)
House heating fuel used in apartments - Electricity (%)
House heating fuel used in apartments - Fuel oil, kerosene, etc. (%)
House heating fuel used in apartments - Coal or coke (%)
House heating fuel used in apartments - Wood (%)
House heating fuel used in apartments - Solar energy (%)
House heating fuel used in apartments - Other fuel (%)
House heating fuel used in apartments - No fuel used (%)
Latest news about housing in Westerly, RI collected exclusively by city-data.com from local newspapers, TV, and radio stations
Median year house/condo built: 1976Median year apartment built: 1963Household type by relationship:
Households: 18,318
Male householders: 4,121 (1,111 living alone ), Female householders: 4,121 (1,351 living alone )3,822 spouses (3,775 opposite-sex spouses ), 547 unmarried partners , (547 opposite-sex unmarried partners ), 4,483 children (4,161 natural , 183 adopted , 138 stepchildren ), 168 grandchildren , 230 brothers or sisters , 215 parents , 5 foster children , 79 other relatives , 250 non-relatives In group quarters: 272
Size of family households: 2,957 2-persons , 992 3-persons , 771 4-persons , 287 5-persons , 9 6-persons , 25 7-or-more-persons .
Size of nonfamily households: 2,793 1-person , 757 2-persons , 57 3-persons .
1,801 married couples with children. single-parent households (84 men , 384 women ).
93.0% of residents of Westerly speak English at home. of residents speak Spanish at home (27% speak English very well , 41% speak English well , 8% speak English not well , 24% don't speak English at all ).of residents speak other Indo-European language at home (69% speak English very well , 21% speak English well , 10% speak English not well ).of residents speak Asian or Pacific Island language at home (35% speak English very well , 30% speak English well , 31% speak English not well , 4% don't speak English at all ).of residents speak other language at home (75% speak English very well , 25% speak English well ).
Foreign born population: 865 (4.7%)of them are naturalized citizens )
Median number of rooms in houses and condos:
Median number of rooms in apartments
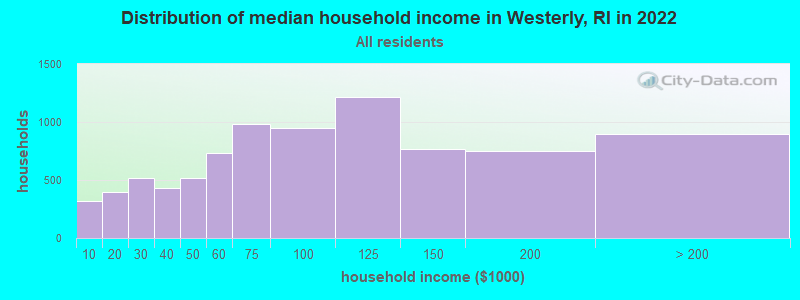
Westerly, RI household income distribution 319 Less than $10,000394 $10,000 to $19,999518 $20,000 to $29,999431 $30,000 to $39,999515 $40,000 to $49,999736 $50,000 to $59,999985 $60,000 to $74,999951 $75,000 to $99,9991,215 $100,000 to $124,999768 $125,000 to $149,999748 $150,000 to $199,999895 $200,000 or more
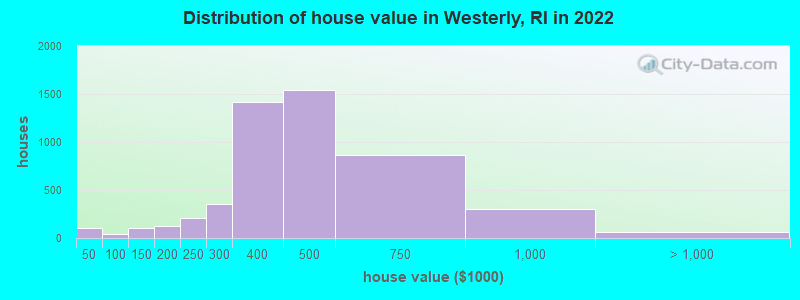
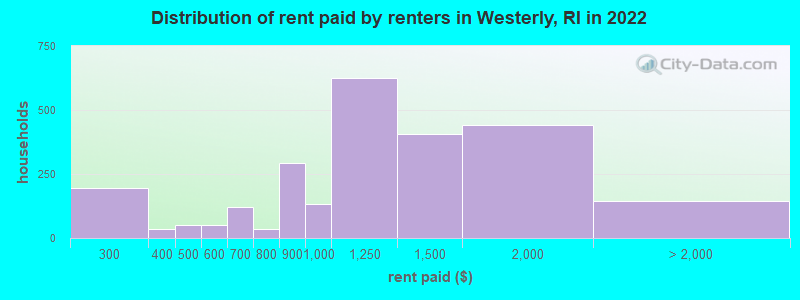
Home value of owner - occupied houses in 2022 in Westerly, RI 24 Less than $10,00045 $10,000 to $14,99910 $30,000 to $34,9994 $35,000 to $39,99920 $40,000 to $49,9998 $50,000 to $59,99911 $90,000 to $99,999104 $125,000 to $149,99991 $150,000 to $174,99935 $175,000 to $199,999204 $200,000 to $249,999353 $250,000 to $299,9991,416 $300,000 to $399,9991,544 $400,000 to $499,999867 $500,000 to $749,999300 $750,000 to $999,99964 $1,000,000 to $1,499,999Rent paid by renters in 2022 in Westerly, RI 150 $200 to $24943 $250 to $29934 $300 to $34951 $450 to $49916 $500 to $54932 $550 to $59966 $600 to $64953 $650 to $69914 $700 to $74922 $750 to $799294 $800 to $899132 $900 to $999624 $1,000 to $1,249405 $1,250 to $1,499441 $1,500 to $1,99997 $2,000 to $2,49947 No cash rent
Percentage of workers working in this county: 59.0%Number of people working at home: 1,025 (10.6% of all workers )
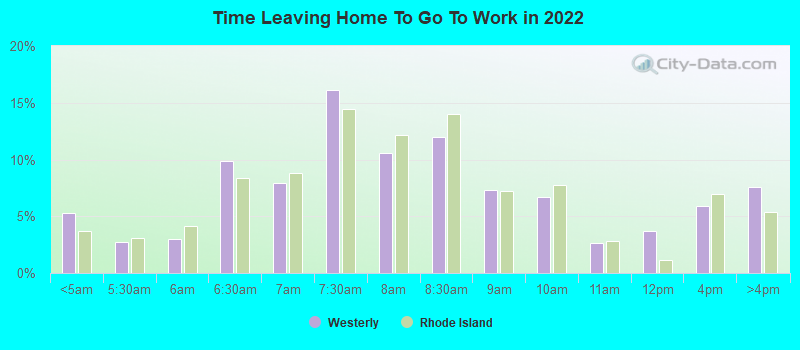
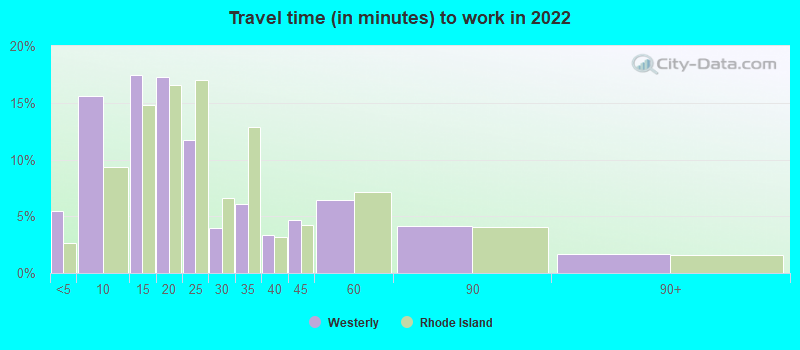
Travel time to work (commute)
Less than 5 minutes: 5215 to 9 minutes: 1,28910 to 14 minutes: 1,20415 to 19 minutes: 92620 to 24 minutes: 1,27825 to 29 minutes: 93430 to 34 minutes: 71335 to 39 minutes: 18840 to 44 minutes: 49445 to 59 minutes: 38560 to 89 minutes: 30490 or more minutes: 176
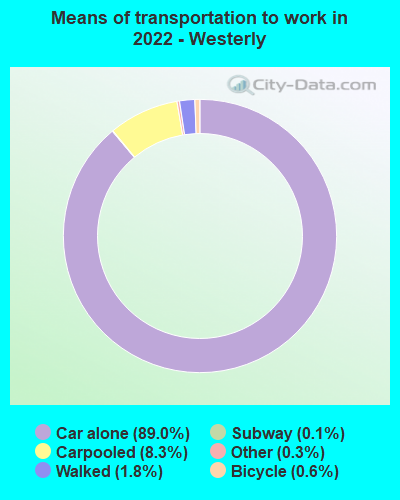
Means of transportation to work:
Drove a car alone: 7,425 (77.8%)Carpooled: 742 (7.8%)Long-distance train or commuter rail : 12 (0.1%)Taxi: 34 (0.4%)Bicycle: 64 (0.7%)Walked: 154 (1.6%)Worked at home: 1,025 (10.7%)
Unemployment by race in 2022
Unemployment rate for White non-Hispanic residents 2.0% Males3.7% FemalesUnemployment rate for Black residents 100.0% MalesUnemployment rate for other race residents 5.0% FemalesUnemployment rate for two or more race residents 46.8% FemalesUnemployment rate for Hispanic or Latino residents 54.7% Females
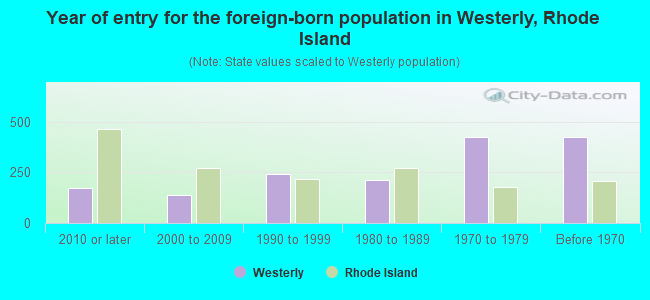
Year of entry for the foreign-born population in Westerly, Rhode Island
172 2010 or later 139 2000 to 2009 242 1990 to 1999 213 1980 to 1989 425 1970 to 1979 427 Before 1970
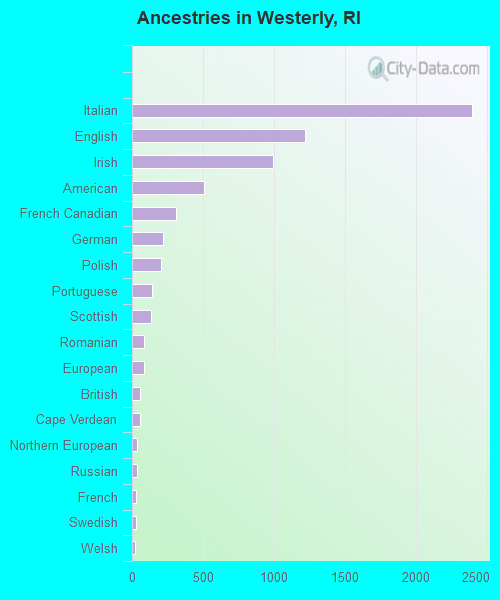
First ancestries reported:
Italian: 2,395 (31.1%)
English: 1,218 (15.8%)
Irish: 990 (12.9%)
American: 507 (6.6%)
French Canadian: 313 (4.1%)
German: 216 (2.8%)
Polish: 207 (2.7%)
Portuguese: 139 (1.8%)
Scottish: 136 (1.8%)
Romanian: 84 (1.1%)
European: 82 (1.1%)
British: 56 (0.7%)
Cape Verdean: 56 (0.7%)
Northern European: 34 (0.4%)
Russian: 34 (0.4%)
French: 31 (0.4%)
Swedish: 28 (0.4%)
Welsh: 22 (0.3%)
Czech: 21 (0.3%)
Armenian: 15 (0.2%)
Ukrainian: 14 (0.2%)
Eastern European: 13 (0.2%)
Greek: 12 (0.2%)
Norwegian: 12 (0.2%)
Egyptian: 11 (0.1%)
Lebanese: 8 (0.1%)
Iranian: 7 (0.09%)
Scotch-Irish: 7 (0.09%)
Czechoslovakian: 6 (0.08%)
Danish: 6 (0.08%) Most common places of birth for foreign-born residents (%): Mexico Westerly:
32.9% (363)Rhode Island:
2.4% (3,836)
China, excluding Hong Kong and Taiwan Westerly:
17.3% (191)Rhode Island:
3.0% (4,789)
Italy Westerly:
10.3% (114)Rhode Island:
1.4% (2,155)
Romania Westerly:
7.2% (79)Rhode Island:
0.2% (303)
Egypt Westerly:
3.7% (41)Rhode Island:
0.3% (505)
Philippines Westerly:
3.1% (34)Rhode Island:
1.7% (2,625)
Portugal Westerly:
3.0% (33)Rhode Island:
10.0% (15,766)
Cuba Westerly:
2.7% (30)Rhode Island:
0.3% (406)
Hong Kong Westerly:
2.6% (29)Rhode Island:
0.5% (712)
United Kingdom, excluding England and Scotland Westerly:
2.5% (27)Rhode Island:
0.7% (1,026)
Germany Westerly:
2.5% (27)Rhode Island:
0.8% (1,314)
Cabo Verde Westerly:
1.7% (19)Rhode Island:
5.1% (8,042)
Place of birth for U.S.-born residents:
This state: 9,884Other state: 7,478Northeast: 5,817Midwest: 397South: 776West: 483 93.1% of Westerly residents lived in the same house 1 years ago.
Out of people who lived in different houses, 26.9% lived in this county.
Out of people who lived in different counties, 24.5% lived in Rhode Island.
Westerly:
93.1%State average:
89.3%
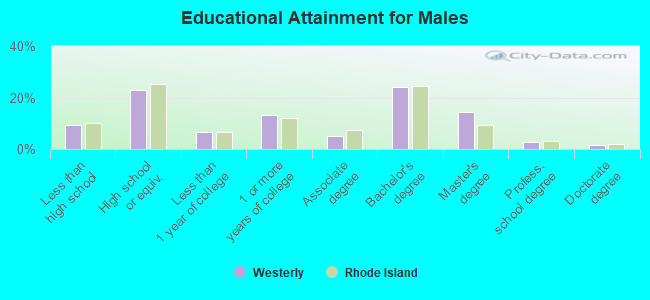
Education attainment for males 25 years and older:
No schooling: 34Nursery to 4th grade: 205th and 6th grade: 707th and 8th grade: 319th grade: 11510th grade: 5411th grade: 14812th grade, no diploma: 161High school graduate (or equivalency): 1,522Less than 1 year of college: 455Some college more than 1 year, no degree: 880Associate degree: 338Bachelor's degree: 1,621Master's degree: 963Professional school degree: 177Doctorate degree: 110
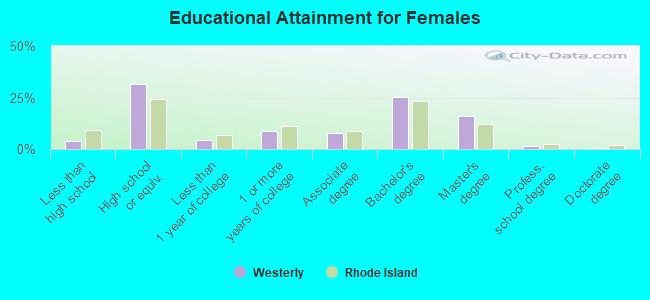
Education attainment for females 25 years and older:
No schooling: 15Nursery to 4th grade: 325th and 6th grade: 17th and 8th grade: 309th grade: 5210th grade: 1111th grade: 3112th grade, no diploma: 107High school graduate (or equivalency): 2,272Less than 1 year of college: 325Some college more than 1 year, no degree: 627Associate degree: 567Bachelor's degree: 1,800Master's degree: 1,163Professional school degree: 112Doctorate degree: 40
Housing units in structures:
One, detached: 5,707One, attached: 290Two: 1,0613 or 4: 9015 to 9: 44510 to 19: 42720 to 49: 36950 or more: 196Mobile homes: 15Housing units lacking complete plumbing facilities in 2022: 0.6%Housing units lacking complete kitchen facilities in 2022: 1.9%House/condo owner moved in on average 15 years ago
Renter moved in on average 4 years ago
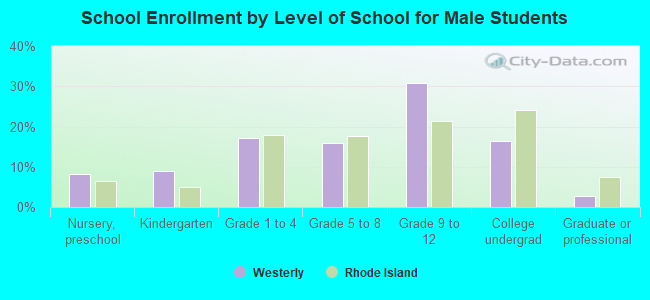
Private vs. public school enrollment:
Students in private schools in grades 1 to 8 (elementary and middle school): 76 Here:
8.9%Rhode Island:
12.2%
Students in private schools in grades 9 to 12 (high school): 46 Here:
6.2%Rhode Island:
11.6%
Students in private undergraduate colleges: 199 Here:
35.8%Rhode Island:
41.1%