Westmont, CA (California) Houses and Residents
| Westmont: | $651,896 |
| California: | $715,900 |
Mean price in 2022:
Detached houses: $599,094
Here: $599,094 State: $988,808 Townhouses or other attached units: $887,747
Here: $887,747 State: $838,546 In 2-unit structures: $900,974
Here: $900,974 State: $1,138,100 In 3-to-4-unit structures: $742,420
Here: $742,420 State: $824,253 Mobile homes: $368,678
Here: $368,678 State: $184,506
Total population: 31,853 (Urban population: 31,542, Rural population: 0)
Houses: 11,316 (10,675 occupied: 2,990 owner occupied, 7,726 renter occupied)
| % of renters here: | 72% |
| State: | 44% |
Housing density: 6,120 houses/condos per square mile
Median price asked for vacant for-sale houses and condos in 2022: $2,838,071.
Median contract rent in 2022: $1,300 (lower quartile is $854, upper quartile is $1,710)
Median rent asked for vacant for-rent units in 2022: $1,838
Median gross rent in Westmont, CA in 2022: $1,432
Housing units in Westmont with a mortgage: 2,249 (212 second mortgage, 27 home equity loan, 146 both second mortgage and home equity loan)
Houses without a mortgage: 5
Median household income for houses/condos with a mortgage: $108,572
Median household income for apartments without a mortgage: $62,813
Median monthly housing costs: $1,533
Compare current foreclosures near Westmont, CA:
| Photo | Address | Area | Beds / Baths | Price | Details |
|---|---|---|---|---|---|

|
#1
Horn Ave Apt 618
West Hollywood, CA 90069
|
797 sq. feet
|
1 baths 1 beds |
$625,000
|
show details |

|
#2
Cedarbrook Dr
Beverly Hills, CA 90210
|
2,371 sq. feet
|
2 baths 3 beds |
$2,350,000
|
show details |

|
#3
Flicker Way
West Hollywood, CA 90069
|
1,612 sq. feet
|
3 baths 3 beds |
$1,207,500
|
show details |

|
#4
S Slater Ave
Compton, CA 90222
|
- sq. feet
|
2 baths 3 beds |
$572,000
|
show details |

|
#5
And 1240 Exposition
Los Angeles, CA 90007
|
- sq. feet
|
2 baths 2 beds |
$614,900
|
show details |

|
#6
Wilshire Blvd Apt 703
Los Angeles, CA 90024
|
2,245 sq. feet
|
2 baths 2 beds |
$1,750,000
|
show details |

|
#7
Bohlig Rd Apt 45
Los Angeles, CA 90032
|
813 sq. feet
|
2 baths 2 beds |
show details | |

|
#8
Marina City Dr Unit 116
Marina Del Rey, CA 90292
|
1,722 sq. feet
|
2 baths 3 beds |
show details | |

|
#9
Elburg St Unit A
Paramount, CA 90723
|
1,131 sq. feet
|
2 baths 3 beds |
show details | |

|
#10
W 110th St
Inglewood, CA 90303
|
3,481 sq. feet
|
4 baths 6 beds |
show details |
| Photo | Address | Area | Beds / Baths | Price | Details |
|---|---|---|---|---|---|

|
#11
6th Ave
Venice, CA 90291
|
3,192 sq. feet
|
3 baths 6 beds |
show details | |

|
#12
N Beachwood Dr
Los Angeles, CA 90068
|
1,848 sq. feet
|
2 baths 2 beds |
show details | |

|
#13
W Arbor St # 57
Long Beach, CA 90805
|
1,585 sq. feet
|
2 baths 3 beds |
show details | |

|
#14
Ingraham St
Los Angeles, CA 90005
|
21,100 sq. feet
|
24 baths 23 beds |
show details | |

|
#15
W 73rd St
Los Angeles, CA 90047
|
1,700 sq. feet
|
2 baths 2 beds |
show details | |

|
#16
Norwalk Blvd Apt
Hawaiian Gardens, CA 90716
|
800 sq. feet
|
2 baths 1 beds |
show details | |

|
#17
E 60th St
Los Angeles, CA 90001
|
1,883 sq. feet
|
3 baths 5 beds |
show details | |

|
#18
Redondo Avenue, Units 5-8
Long Beach, CA 90804
|
3,360 sq. feet
|
4 baths 8 beds |
show details | |

|
#19
Marina City Drive # Ph 29
Marina Del Rey, CA 90292
|
3,200 sq. feet
|
2 baths 2 beds |
show details | |

|
#20
Carlin Ave
Lynwood, CA 90262
|
1,833 sq. feet
|
2 baths 3 beds |
show details |
| Photo | Address | Area | Beds / Baths | Price | Details |
|---|---|---|---|---|---|

|
#21
Marconi St
Huntington Park, CA 90255
|
2,245 sq. feet
|
3 baths 4 beds |
show details | |

|
#22
Towne Ave
Carson, CA 90746
|
986 sq. feet
|
1 baths 3 beds |
show details | |

|
#23
Otis St
Lynwood, CA 90262
|
1,228 sq. feet
|
2 baths 3 beds |
show details | |

|
#24
Virginia St
Lynwood, CA 90262
|
1,548 sq. feet
|
2 baths 3 beds |
show details | |

|
#25
E Reeve St
Compton, CA 90220
|
1,008 sq. feet
|
1 baths 3 beds |
show details | |

|
#26
Josephine St
Lynwood, CA 90262
|
1,414 sq. feet
|
1 baths 3 beds |
show details | |

|
#27
Stanford Ave
Los Angeles, CA 90011
|
600 sq. feet
|
1 baths 2 beds |
show details | |

|
#28
E Mcmillan St
Compton, CA 90221
|
1,248 sq. feet
|
2 baths 3 beds |
show details | |

|
#29
Liberty Blvd
South Gate, CA 90280
|
1,488 sq. feet
|
2 baths 3 beds |
show details | |

|
#30
N Spruce St
Montebello, CA 90640
|
1,102 sq. feet
|
1 baths 3 beds |
show details |
| Photo | Address | Area | Beds / Baths | Price | Details |
|---|---|---|---|---|---|

|
#31
Walton Ave
Los Angeles, CA 90007
|
852 sq. feet
|
1 baths 2 beds |
show details | |

|
#32
Platt Ave
Lynwood, CA 90262
|
814 sq. feet
|
1 baths 2 beds |
show details | |

|
#33
Buell St
Santa Fe Springs, CA 90670
|
1,203 sq. feet
|
2 baths 3 beds |
show details | |

|
#34
Rosecrans Ave
Norwalk, CA 90650
|
1,008 sq. feet
|
1 baths 3 beds |
show details | |

|
#35
Hollydale Dr
Los Angeles, CA 90039
|
982 sq. feet
|
1 baths 2 beds |
show details | |

|
#36
Longworth Ave
Norwalk, CA 90650
|
1,789 sq. feet
|
2 baths 5 beds |
show details | |

|
#37
Crossway Dr
Pico Rivera, CA 90660
|
1,162 sq. feet
|
2 baths 2 beds |
show details | |

|
#38
10th St Apt 1
Santa Monica, CA 90401
|
756 sq. feet
|
1 baths 2 beds |
show details | |

|
#39
Palo Verde Ave
Cerritos, CA 90703
|
757 sq. feet
|
1 baths 2 beds |
show details | |

|
#40
Bridgeport
Manhattan Beach, CA 90266
|
2,038 sq. feet
|
2 baths 3 beds |
show details |
| Photo | Address | Area | Beds / Baths | Price | Details |
|---|---|---|---|---|---|

|
#41
W 29th Pl
Los Angeles, CA 90018
|
1,292 sq. feet
|
2 baths 2 beds |
show details | |

|
#42
Regina Ave
Torrance, CA 90504
|
2,976 sq. feet
|
3 baths 5 beds |
show details | |

|
#43
Hannum Ave
Culver City, CA 90230
|
1,492 sq. feet
|
3 baths 2 beds |
show details | |

|
#44
Hannum Ave
Culver City, CA 90230
|
1,739 sq. feet
|
3 baths 2 beds |
show details | |

|
#45
Hannum Ave
Culver City, CA 90230
|
1,888 sq. feet
|
3 baths 2 beds |
show details | |

|
#46
Kirkwood Dr
Los Angeles, CA 90046
|
1,245 sq. feet
|
2 baths 2 beds |
show details | |

|
#47
S 3rd St
Montebello, CA 90640
|
1,440 sq. feet
|
2 baths 3 beds |
show details | |

|
#48
Mayfield Ave
Los Angeles, CA 90049
|
14,211 sq. feet
|
35 baths 27 beds |
show details | |

|
#49
Quebec Dr
Los Angeles, CA 90068
|
4,136 sq. feet
|
5 baths 4 beds |
show details | |

|
Check over 1 million property listings on Foreclosure.com!
|
browse all offers | |||

Latest news about housing in Westmont, CA collected exclusively by city-data.com from local newspapers, TV, and radio stations


Median year apartment built: 1958
Household type by relationship:
Households: 34,578- Male householders: 4,173 (857 living alone), Female householders: 6,148 (1,687 living alone)
2,956 spouses (2,923 opposite-sex spouses), 977 unmarried partners, (936 opposite-sex unmarried partners), 13,019 children (11,964 natural, 176 adopted, 878 stepchildren), 1,975 grandchildren, 1,027 brothers or sisters, 817 parents, 14 foster children, 2,059 other relatives, 1,175 non-relatives
- In group quarters: 232
Size of family households: 1,897 2-persons, 1,692 3-persons, 1,439 4-persons, 1,384 5-persons, 604 6-persons, 474 7-or-more-persons.
Size of nonfamily households: 2,730 1-person, 309 2-persons, 9 3-persons, 77 4-persons, 22 5-persons.
3,447 married couples with children.
4,303 single-parent households (1,133 men, 3,170 women).
46.0% of residents of Westmont speak English at home.
54.0% of residents speak Spanish at home (38% speak English very well, 34% speak English well, 20% speak English not well, 8% don't speak English at all).
0.1% of residents speak other Indo-European language at home (100% speak English very well).
0.7% of residents speak Asian or Pacific Island language at home (54% speak English very well, 27% speak English well, 19% speak English not well).
0.4% of residents speak other language at home (98% speak English very well, 2% speak English well).
Foreign born population: 10,053 (29.1%)
(30.5% of them are naturalized citizens)
| Here: | 5.4 |
| State: | 6.0 |
| Here: | 4.0 |
| State: | 3.9 |

- Bedrooms in owner-occupied houses and condos in Westmont, California
- 13no bedroom
- 511 bedroom
- 9122 bedrooms
- 1,7463 bedrooms
- 2444 bedrooms
- 245+ bedrooms

- Bedrooms in renter-occupied apartments in Westmont, California
- 283no bedroom
- 2,7051 bedroom
- 2,9232 bedrooms
- 1,5543 bedrooms
- 2394 bedrooms
- 225+ bedrooms

- Cars and other vehicles available in Westmont in owner-occupied houses/condos
- 201no vehicle
- 5941 vehicle
- 9212 vehicles
- 5723 vehicles
- 5444 vehicles
- 1575+ vehicles

- Cars and other vehicles available in Westmont in renter-occupied apartments
- 1,798no vehicle
- 3,2261 vehicle
- 1,7732 vehicles
- 5753 vehicles
- 2844 vehicles
- 705+ vehicles

- Rooms in owner-occupied houses in Westmont, California
- 131 room
- 02 rooms
- 963 rooms
- 5764 rooms
- 8265 rooms
- 8886 rooms
- 3207 rooms
- 1408 rooms
- 1319+ rooms

- Rooms in renter-occupied apartments in Westmont, California
- 2681 room
- 2302 rooms
- 2,2913 rooms
- 2,0164 rooms
- 1,5225 rooms
- 1,0566 rooms
- 2127 rooms
- 1158 rooms
- 159+ rooms


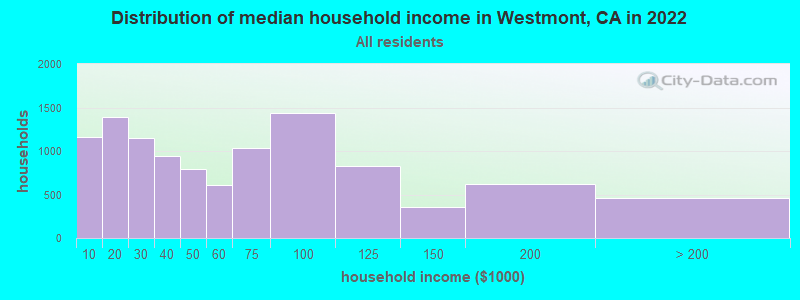
Westmont, CA household income distribution

- 1,162Less than $10,000
- 1,394$10,000 to $19,999
- 1,150$20,000 to $29,999
- 938$30,000 to $39,999
- 795$40,000 to $49,999
- 612$50,000 to $59,999
- 1,034$60,000 to $74,999
- 1,432$75,000 to $99,999
- 825$100,000 to $124,999
- 356$125,000 to $149,999
- 615$150,000 to $199,999
- 460$200,000 or more
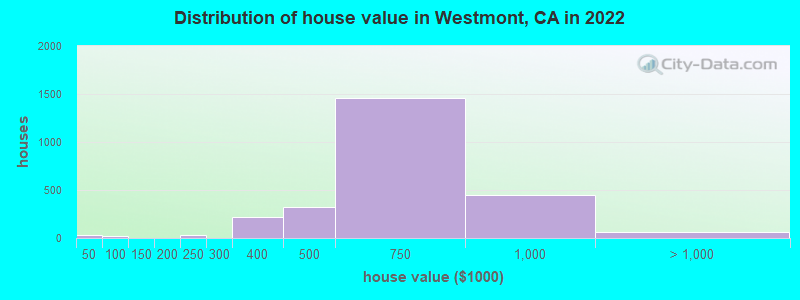
Home value of owner - occupied houses in 2022 in Westmont, CA
-
- 36$10,000 to $14,999
- 15$50,000 to $59,999
- 1$100,000 to $124,999
- 31$200,000 to $249,999
- 221$300,000 to $399,999
- 328$400,000 to $499,999
- 1,456$500,000 to $749,999
- 449$750,000 to $999,999
- 53$1,000,000 to $1,499,999
- 13$2,000,000 or more
Rent paid by renters in 2022 in Westmont, CA
-
- 161Less than $100
- 74$100 to $149
- 62$150 to $199
- 425$200 to $249
- 136$250 to $299
- 7$300 to $349
- 105$350 to $399
- 99$400 to $449
- 126$450 to $499
- 132$500 to $549
- 131$550 to $599
- 77$600 to $649
- 31$650 to $699
- 57$700 to $749
- 152$750 to $799
- 361$800 to $899
- 390$900 to $999
- 1,156$1,000 to $1,249
- 929$1,250 to $1,499
- 2,703$1,500 to $1,999
- 312$2,000 to $2,499
- 70$2,500 to $2,999
- 221No cash rent


Percentage of workers working in this county: 96.9%
Number of people working at home: 956 (7.0% of all workers)
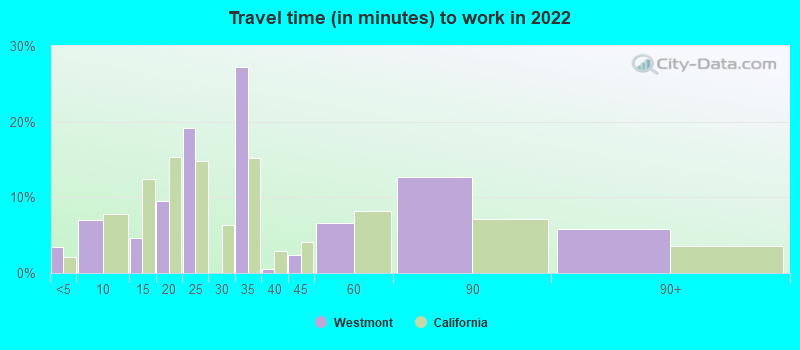
Travel time to work (commute)
- Less than 5 minutes: 138
- 5 to 9 minutes: 485
- 10 to 14 minutes: 511
- 15 to 19 minutes: 1,366
- 20 to 24 minutes: 1,581
- 25 to 29 minutes: 611
- 30 to 34 minutes: 2,858
- 35 to 39 minutes: 391
- 40 to 44 minutes: 843
- 45 to 59 minutes: 1,669
- 60 to 89 minutes: 1,328
- 90 or more minutes: 385
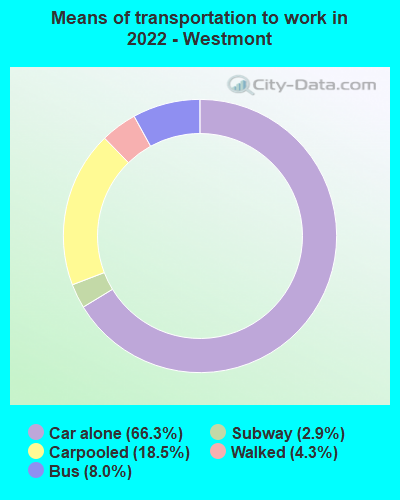
Means of transportation to work:
- Drove a car alone: 719 (38.2%)
- Carpooled: 222 (11.8%)
- Bus: 78 (4.1%)
- Long-distance train or commuter rail: 19 (1.0%)
- Walked: 50 (2.7%)
- Worked at home: 956 (50.8%)

- Unemployment by race in 2022
- Unemployment rate for White non-Hispanic residents
- 33.9%Males
- 22.0%Females
- Unemployment rate for Black residents
- 9.0%Males
- 13.0%Females
- Unemployment rate for American Indian and Alaska Native residents
- 23.3%Females
- Unemployment rate for other race residents
- 7.5%Males
- 5.7%Females
- Unemployment rate for two or more race residents
- 10.5%Males
- 17.1%Females
- Unemployment rate for Hispanic or Latino residents
- 7.0%Males
- 9.2%Females

- Year of entry for the foreign-born population in Westmont, California
- 2,6722010 or later
- 2,7042000 to 2009
- 2,0721990 to 1999
- 3,2501980 to 1989
- 1,4531970 to 1979
- 360Before 1970
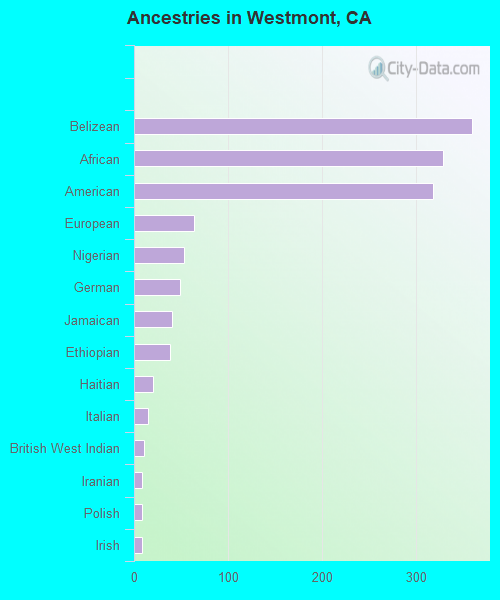
First ancestries reported:
- Belizean: 360 (1.5%)
- African: 329 (1.4%)
- American: 318 (1.3%)
- European: 64 (0.3%)
- Nigerian: 53 (0.2%)
- German: 49 (0.2%)
- Jamaican: 40 (0.2%)
- Ethiopian: 38 (0.2%)
- Haitian: 20 (0.08%)
- Italian: 15 (0.06%)
- British West Indian: 11 (0.05%)
- Iranian: 9 (0.04%)
- Polish: 9 (0.04%)
- Irish: 8 (0.03%)
Most common places of birth for foreign-born residents (%):
| Westmont: | 39.1% (3,932) |
| California: | 37.2% (3,881,193) |
| Westmont: | 25.0% (2,511) |
| California: | 4.2% (440,287) |
| Westmont: | 22.8% (2,296) |
| California: | 2.8% (290,436) |
| Westmont: | 7.2% (725) |
| California: | 0.6% (66,590) |
| Westmont: | 2.0% (206) |
| California: | 0.2% (15,693) |
Place of birth for U.S.-born residents:
- This state: 20,905
- Other state: 3,352
- Northeast: 374
- Midwest: 434
- South: 2,305
- West: 273
94.5% of Westmont residents lived in the same house 1 years ago.
Out of people who lived in different houses, 43.9% lived in this county.
Out of people who lived in different counties, 82.5% lived in California.
| Westmont: | 94.5% |
| State average: | 88.9% |
Education attainment for males 25 years and older:
- No schooling: 510
- Nursery to 4th grade: 196
- 5th and 6th grade: 857
- 7th and 8th grade: 202
- 9th grade: 361
- 10th grade: 130
- 11th grade: 237
- 12th grade, no diploma: 434
- High school graduate (or equivalency): 2,999
- Less than 1 year of college: 655
- Some college more than 1 year, no degree: 1,282
- Associate degree: 389
- Bachelor's degree: 714
- Master's degree: 183
- Professional school degree: 28
- Doctorate degree: 15

Education attainment for females 25 years and older:
- No schooling: 475
- Nursery to 4th grade: 379
- 5th and 6th grade: 732
- 7th and 8th grade: 192
- 9th grade: 454
- 10th grade: 117
- 11th grade: 358
- 12th grade, no diploma: 467
- High school graduate (or equivalency): 3,317
- Less than 1 year of college: 698
- Some college more than 1 year, no degree: 2,151
- Associate degree: 823
- Bachelor's degree: 954
- Master's degree: 384
- Professional school degree: 100
- Doctorate degree: 51


Housing units in structures:
- One, detached: 4,838
- One, attached: 1,284
- Two: 1,125
- 3 or 4: 1,479
- 5 to 9: 1,201
- 10 to 19: 674
- 20 to 49: 471
- 50 or more: 179
- Mobile homes: 61
Housing units lacking complete kitchen facilities in 2022: 3.6%
House/condo owner moved in on average 13 years ago
Renter moved in on average 6 years ago

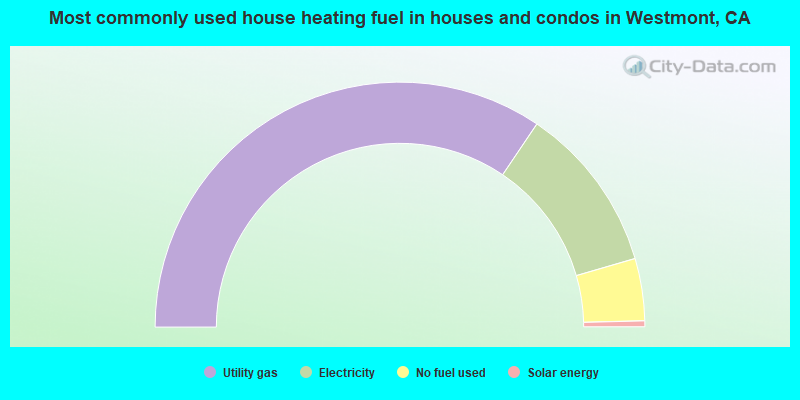
- 68.9%Utility gas
- 22.1%Electricity
- 8.2%No fuel used
- 0.8%Solar energy
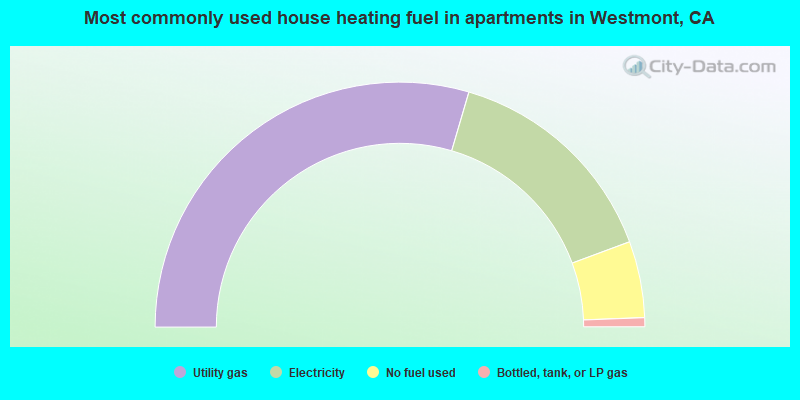
- 59.1%Utility gas
- 29.6%Electricity
- 10.1%No fuel used
- 1.2%Bottled, tank, or LP gas
Private vs. public school enrollment:
| Here: | 9.0% |
| California: | 10.5% |
| Here: | 5.9% |
| California: | 8.5% |
| Here: | 20.6% |
| California: | 15.9% |


