Westmont, IL (Illinois) Houses and Residents
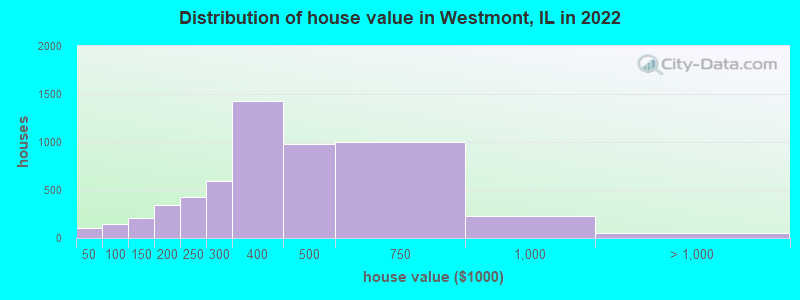
Estimated median house or condo value in 2022: $364,396 (it was $171,000 in 2000 )
Westmont:
$364,396Illinois:
$251,600
Lower value quartile - upper value quartile: $259,369 - $490,572Mean price in 2022: Detached houses: $441,107 Here:
$441,107State:
$310,164
Townhouses or other attached units: $309,334 Here:
$309,334State:
$286,230
In 3-to-4-unit structures: $215,641 Here:
$215,641State:
$330,907
In 5-or-more-unit structures: $199,649 Here:
$199,649State:
$318,887
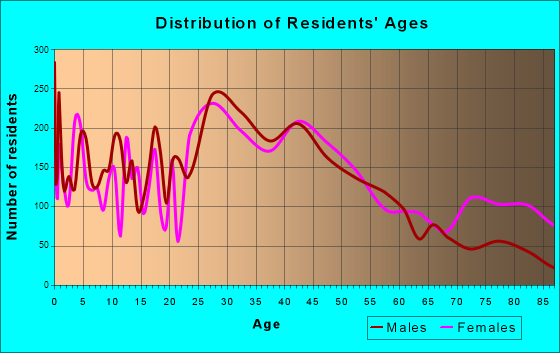
Total population: 24,963 (Urban population: 24,343, Rural population: 0)
Houses: 11,261 (10,388 occupied: 5,437 owner occupied, 4,962 renter occupied )
% of renters here:
48%State:
33%
Housing density: 2,300 houses/condos per square mile
Median price asked for vacant for-sale houses and condos in 2022: $374,886.
Median contract rent in 2022: $1,236 (lower quartile is $1,017, upper quartile is $1,499)
Median rent asked for vacant for-rent units in 2022: $1,314
Median gross rent in Westmont, IL in 2022: $1,304
Housing units in Westmont with a mortgage: 3,253 (305 second mortgage, 0 home equity loan, 292 both second mortgage and home equity loan )Houses without a mortgage: 170
Median household income for houses/condos with a mortgage: $139,643
Median household income for apartments without a mortgage: $88,682
Median monthly housing costs: $1,355
Data:
Median house or condo value ($)
Median house or condo value ($ change since 2000)
Median house or condo value ($) - White
Median house or condo value ($) - Black or African American
Median house or condo value ($) - Asian
Median house or condo value ($) - Hispanic or Latino
Median house or condo value ($) - American Indian and Alaska Native
Median house or condo value ($) - Multirace
Median house or condo value ($) - Other Race
Median price asked for mobile homes ($)
Household density (households per square mile)
Mean house or condo value by units in structure - 1, detached ($)
Mean house or condo value by units in structure - 1, attached ($)
Mean house or condo value by units in structure - 2 ($)
Mean house or condo value by units in structure by units in structure - 3 or 4 ($)
Mean house or condo value by units in structure - 5 or more ($)
Mean house or condo value by units in structure - Boat, RV, van, etc. ($)
Mean house or condo value by units in structure - Mobile home ($)
Median contract rent ($)
Median contract rent - Lower quartile ($)
Median contract rent - Upper quartile ($)
Median gross rent ($)
Urban houses (%)
Rural houses (%)
Houses occupied (%)
Houses occupied (% change since 2000)
Houses owner occupied (%)
Houses owner occupied (% change since 2000)
Houses renter occupied (%)
Houses renter occupied (% change since 2000)
Vacant housing units - For rent (%)
Vacant housing units - For rent (% change since 2000)
Vacant housing units - For sale only (%)
Vacant housing units - For sale only (% change since 2000)
Vacant housing units - Rented or sold, not occupied (%)
Vacant housing units - Rented or sold, not occupied (% change since 2000)
Vacant housing units - For seasonal, recreational, or occasional use (%)
Vacant housing units - For seasonal, recreational, or occasional use (% change since 2000)
Vacant housing units - For migrant workers (%)
Vacant housing units - For migrant workers (% change since 2000)
Vacant housing units - Other vacant (%)
Vacant housing units - Other vacant (% change since 2000)
Median monthly housing costs ($)
Median household income for houses/condos with a mortgage ($)
Median household income for houses/condos without a mortgage ($)
Median household income ($)
Median household income ($) - White
Median household income ($) - Black or African American
Median household income ($) - Asian
Median household income ($) - Hispanic or Latino
Median household income ($) - American Indian and Alaska Native
Median household income ($) - Multirace
Median household income ($) - Other Race
Mortgage status - with mortgage (%)
Mortgage status - with second mortgage (%)
Mortgage status - with home equity loan (%)
Mortgage status - with both second mortgage and home equity loan (%)
Mortgage status - without a mortgage (%)
Median year house/condo built
Median year apartment built
Household type by relationship - Male householder living alone (%)
Household type by relationship - Male householder not living alone (%)
Household type by relationship - Female householder living alone (%)
Household type by relationship - Female householder not living alone (%)
Household type by relationship - Opposite-Sex spouse (%)
Household type by relationship - Same-Sex spouse (%)
Household type by relationship - Opposite-Sex unmarried partner (%)
Household type by relationship - Same-Sex unmarried partner (%)
Household type by relationship - In group quarters (%)
Size of family households - 2-person household (%)
Size of family households - 3-person household (%)
Size of family households - 4-person household (%)
Size of family households - 5-person household (%)
Size of family households - 6-person household (%)
Size of family households - 7-or-more-person household (%)
Size of nonfamily households - 1-person household (%)
Size of nonfamily households - 2-person household (%)
Size of nonfamily households - 3-person household (%)
Size of nonfamily households - 4-person household (%)
Size of nonfamily households - 5-person household (%)
Size of nonfamily households - 6-person household (%)
Size of nonfamily households - 7-or-moreperson household (%)
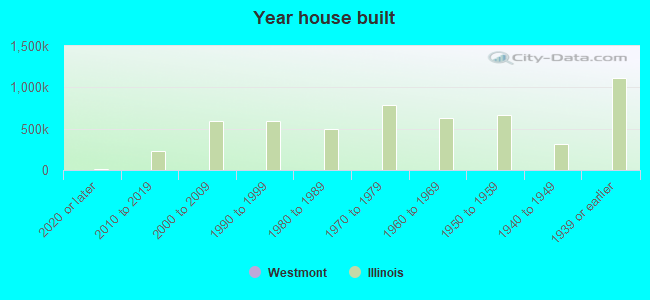
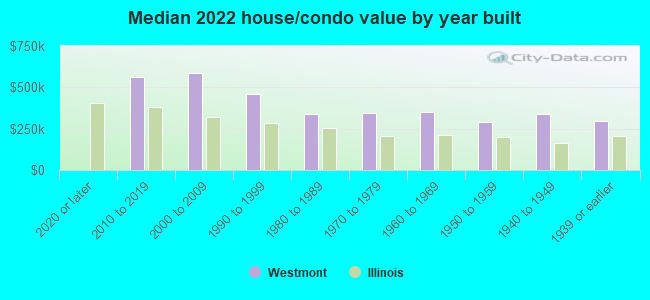
Year house built - Built 2010 or later (%)
Year house built - Built 2000 to 2009 (%)
Year house built - Built 1990 to 1999 (%)
Year house built - Built 1980 to 1989 (%)
Year house built - Built 1970 to 1979 (%)
Year house built - Built 1960 to 1969 (%)
Year house built - Built 1950 to 1959 (%)
Year house built - Built 1940 to 1949 (%)
Year house built - Built 1939 or earlier (%)
Median number of rooms in houses and condos
Median number of rooms in apartments
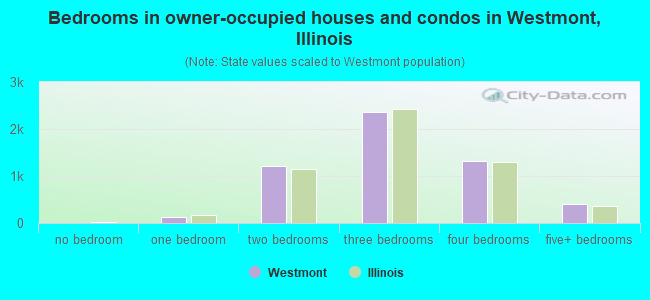
Median number of bedrooms in owner occupied houses
Mean number of bedrooms in owner occupied houses
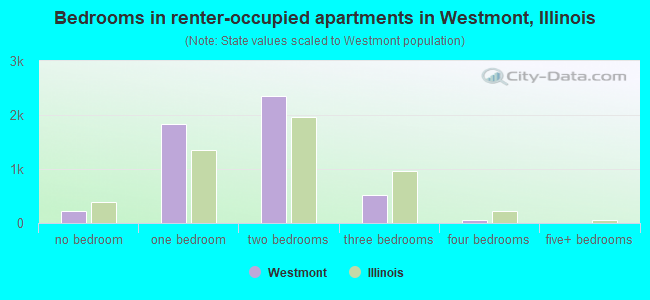
Median number of bedrooms in renter occupied houses
Mean number of bedrooms in renter occupied houses
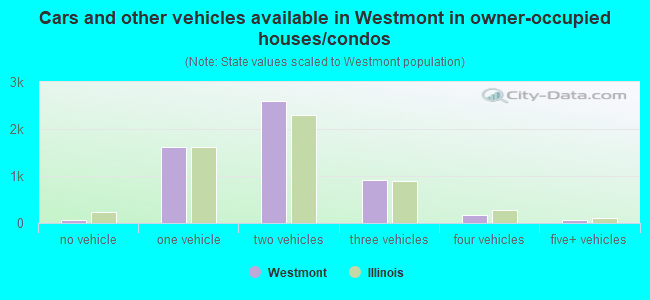
Median number of vehichles in owner occupied houses
Mean number of vehichles in owner occupied houses
Median number of vehichles in renter occupied houses
Mean number of vehichles in renter occupied houses
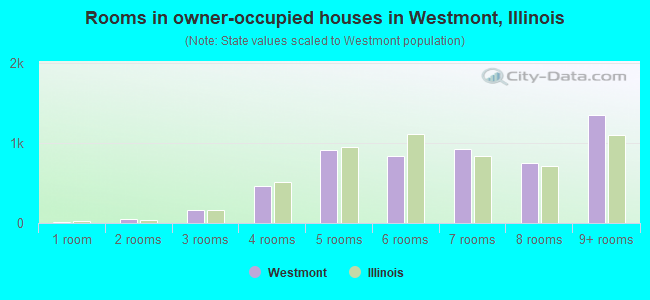
Rooms in owner-occupied houses - 1 room (%)
Rooms in owner-occupied houses - 2 rooms (%)
Rooms in owner-occupied houses - 3 rooms (%)
Rooms in owner-occupied houses - 4 rooms (%)
Rooms in owner-occupied houses - 5 rooms (%)
Rooms in owner-occupied houses - 6 rooms (%)
Rooms in owner-occupied houses - 7 rooms (%)
Rooms in owner-occupied houses - 8 rooms (%)
Rooms in owner-occupied houses - 9+ rooms (%)
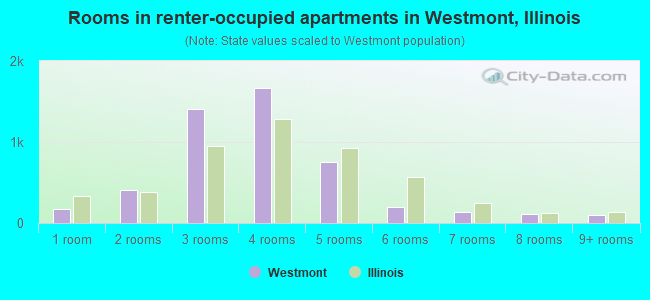
Rooms in renter-occupied houses - 1 room (%)
Rooms in renter-occupied houses - 2 rooms (%)
Rooms in renter-occupied houses - 3 rooms (%)
Rooms in renter-occupied houses - 4 rooms (%)
Rooms in renter-occupied houses - 5 rooms (%)
Rooms in renter-occupied houses - 6 rooms (%)
Rooms in renter-occupied houses - 7 rooms (%)
Rooms in renter-occupied houses - 8 rooms (%)
Rooms in renter-occupied houses - 9+ rooms (%)
Bedrooms in owner-occupied houses - no bedrooms (%)
Bedrooms in owner-occupied houses - 1 bedroom (%)
Bedrooms in owner-occupied houses - 2 bedrooms (%)
Bedrooms in owner-occupied houses - 3 bedrooms (%)
Bedrooms in owner-occupied houses - 4 bedrooms (%)
Bedrooms in owner-occupied houses - 5+ bedrooms (%)
Bedrooms in renter-occupied houses - no bedrooms (%)
Bedrooms in renter-occupied houses - 1 bedroom (%)
Bedrooms in renter-occupied houses - 2 bedrooms (%)
Bedrooms in renter-occupied houses - 3 bedrooms (%)
Bedrooms in renter-occupied houses - 4 bedrooms (%)
Bedrooms in renter-occupied houses - 5+ bedrooms (%)
Vehicles available in owner-occupied houses - no vehicle available (%)
Vehicles available in owner-occupied houses - 1 vehicle available(%)
Vehicles available in owner-occupied houses - 2 Vehicles available (%)
Vehicles available in owner-occupied houses - 3 Vehicles available (%)
Vehicles available in owner-occupied houses - 4 Vehicles available (%)
Vehicles available in owner-occupied houses - 5+ Vehicles available (%)
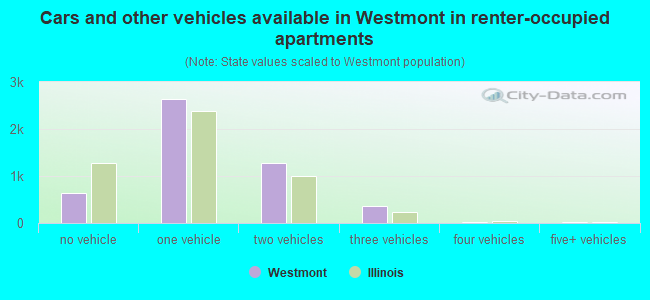
Vehicles available in renter-occupied houses - no vehicle available (%)
Vehicles available in renter-occupied houses - 1 vehicle available (%)
Vehicles available in renter-occupied houses - 2 Vehicles available (%)
Vehicles available in renter-occupied houses - 3 Vehicles available (%)
Vehicles available in renter-occupied houses - 4 Vehicles available (%)
Vehicles available in renter-occupied houses - 5+ Vehicles available (%)
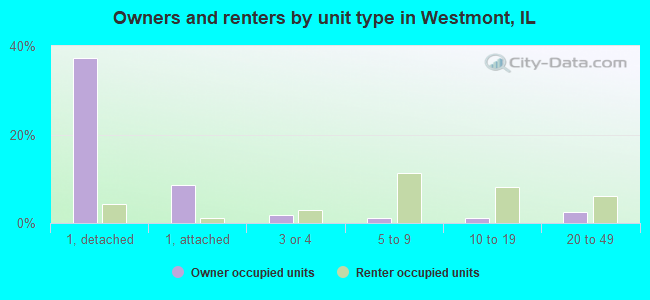
Housing units in structures - 1, detached (%)
Housing units in structures - 1, attached (%)
Housing units in structures - 2 (%)
Housing units in structures - 3 or 4 (%)
Housing units in structures - 5 to 9 (%)
Housing units in structures - 10 to 19 (%)
Housing units in structures - 20 to 49 (%)
Housing units in structures - 50 or more (%)
Housing units in structures - Mobile home (%)
Housing units in structures - Boat, RV, van, etc. (%)
Housing units in structures - Owners - 1, detached (%)
Housing units in structures - Owners - 1, attached (%)
Housing units in structures - Owners - 2 (%)
Housing units in structures - Owners - 3 or 4 (%)
Housing units in structures - Owners - 5 to 9 (%)
Housing units in structures - Owners - 10 to 19 (%)
Housing units in structures - Owners - 20 to 49 (%)
Housing units in structures - Owners - 50 or more (%)
Housing units in structures - Owners - Mobile home (%)
Housing units in structures - Owners - Boat, RV, van, etc. (%)
Housing units in structures - Renters - 1, detached (%)
Housing units in structures - Renters - 1, attached (%)
Housing units in structures - Renters - 2 (%)
Housing units in structures - Renters - 3 or 4 (%)
Housing units in structures - Renters - 5 to 9 (%)
Housing units in structures - Renters - 10 to 19 (%)
Housing units in structures - Renters - 20 to 49 (%)
Housing units in structures - Renters - 50 or more (%)
Housing units in structures - Renters - Mobile home (%)
Housing units in structures - Renters - Boat, RV, van, etc. (%)
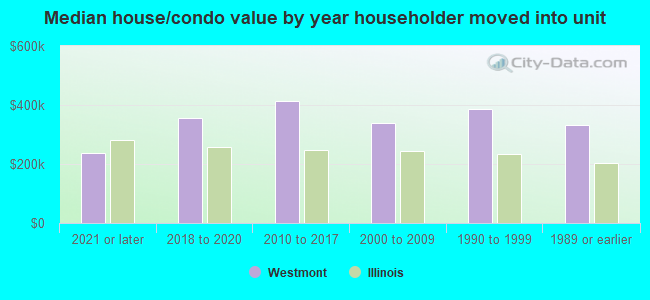
House/condo owner moved in on average (years ago)
Renter moved in on average (years ago)
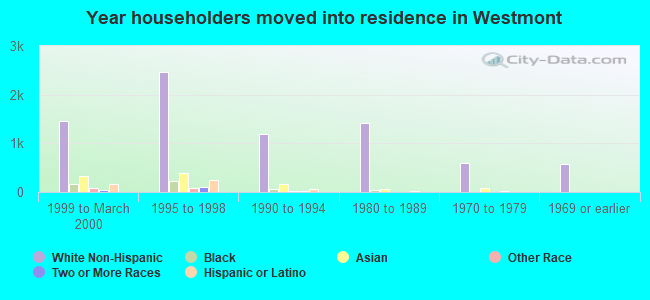
Year householder moved into unit - Moved in 1999 to March 2000 (%)
Year householder moved into unit - Moved in 1999 to March 2000 (%) - White
Year householder moved into unit - Moved in 1999 to March 2000 (%) - Black or African American
Year householder moved into unit - Moved in 1999 to March 2000 (%) - Asian
Year householder moved into unit - Moved in 1999 to March 2000 (%) - Hispanic or Latino
Year householder moved into unit - Moved in 1999 to March 2000 (%) - American Indian and Alaska Native
Year householder moved into unit - Moved in 1999 to March 2000 (%) - Multirace
Year householder moved into unit - Moved in 1999 to March 2000 (%) - Other Race
Year householder moved into unit - Moved in 1995 to 1998 (%)
Year householder moved into unit - Moved in 1995 to 1998 (%) - White
Year householder moved into unit - Moved in 1995 to 1998 (%) - Black or African American
Year householder moved into unit - Moved in 1995 to 1998 (%) - Asian
Year householder moved into unit - Moved in 1995 to 1998 (%) - Hispanic or Latino
Year householder moved into unit - Moved in 1995 to 1998 (%) - American Indian and Alaska Native
Year householder moved into unit - Moved in 1995 to 1998 (%) - Multirace
Year householder moved into unit - Moved in 1995 to 1998 (%) - Other Race
Year householder moved into unit - Moved in 1990 to 1994 (%)
Year householder moved into unit - Moved in 1990 to 1994 (%) - White
Year householder moved into unit - Moved in 1990 to 1994 (%) - Black or African American
Year householder moved into unit - Moved in 1990 to 1994 (%) - Asian
Year householder moved into unit - Moved in 1990 to 1994 (%) - Hispanic or Latino
Year householder moved into unit - Moved in 1990 to 1994 (%) - American Indian and Alaska Native
Year householder moved into unit - Moved in 1990 to 1994 (%) - Multirace
Year householder moved into unit - Moved in 1990 to 1994 (%) - Other Race
Year householder moved into unit - Moved in 1980 to 1989 (%)
Year householder moved into unit - Moved in 1980 to 1989 (%) - White
Year householder moved into unit - Moved in 1980 to 1989 (%) - Black or African American
Year householder moved into unit - Moved in 1980 to 1989 (%) - Asian
Year householder moved into unit - Moved in 1980 to 1989 (%) - Hispanic or Latino
Year householder moved into unit - Moved in 1980 to 1989 (%) - American Indian and Alaska Native
Year householder moved into unit - Moved in 1980 to 1989 (%) - Multirace
Year householder moved into unit - Moved in 1980 to 1989 (%) - Other Race
Year householder moved into unit - Moved in 1970 to 1979 (%)
Year householder moved into unit - Moved in 1970 to 1979 (%) - White
Year householder moved into unit - Moved in 1970 to 1979 (%) - Black or African American
Year householder moved into unit - Moved in 1970 to 1979 (%) - Asian
Year householder moved into unit - Moved in 1970 to 1979 (%) - Hispanic or Latino
Year householder moved into unit - Moved in 1970 to 1979 (%) - American Indian and Alaska Native
Year householder moved into unit - Moved in 1970 to 1979 (%) - Multirace
Year householder moved into unit - Moved in 1970 to 1979 (%) - Other Race
Year householder moved into unit - Moved in 1969 or earlier (%)
Year householder moved into unit - Moved in 1969 or earlier (%) - White
Year householder moved into unit - Moved in 1969 or earlier (%) - Black or African American
Year householder moved into unit - Moved in 1969 or earlier (%) - Asian
Year householder moved into unit - Moved in 1969 or earlier (%) - Hispanic or Latino
Year householder moved into unit - Moved in 1969 or earlier (%) - American Indian and Alaska Native
Year householder moved into unit - Moved in 1969 or earlier (%) - Multirace
Year householder moved into unit - Moved in 1969 or earlier (%) - Other Race
Housing units lacking complete plumbing facilities (%)
Housing units lacking complete kitchen facilities (%)
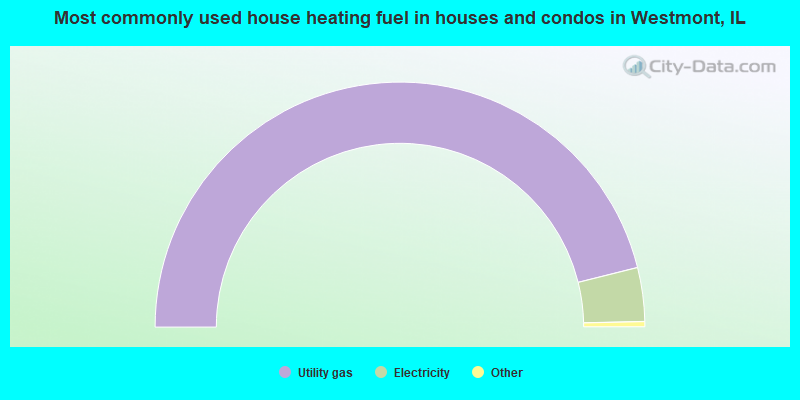
House heating fuel used in houses and condos - Utility gas (%)
House heating fuel used in houses and condos - Bottled, tank, or LP gas (%)
House heating fuel used in houses and condos - Electricity (%)
House heating fuel used in houses and condos - Fuel oil, kerosene, etc. (%)
House heating fuel used in houses and condos - Coal or coke (%)
House heating fuel used in houses and condos - Wood (%)
House heating fuel used in houses and condos - Solar energy (%)
House heating fuel used in houses and condos - Other fuel (%)
House heating fuel used in houses and condos - No fuel used (%)
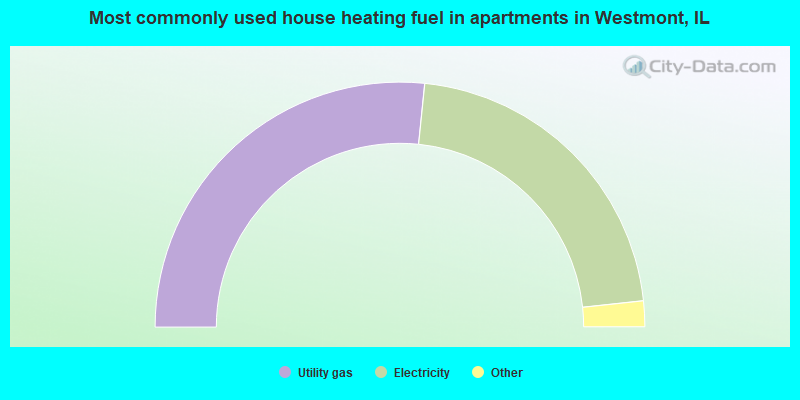
House heating fuel used in apartments - Utility gas (%)
House heating fuel used in apartments - Bottled, tank, or LP gas (%)
House heating fuel used in apartments - Electricity (%)
House heating fuel used in apartments - Fuel oil, kerosene, etc. (%)
House heating fuel used in apartments - Coal or coke (%)
House heating fuel used in apartments - Wood (%)
House heating fuel used in apartments - Solar energy (%)
House heating fuel used in apartments - Other fuel (%)
House heating fuel used in apartments - No fuel used (%)
Latest news about housing in Westmont, IL collected exclusively by city-data.com from local newspapers, TV, and radio stations
Median year house/condo built: 1980Median year apartment built: 1974Household type by relationship:
Households: 24,019
Male householders: 4,807 (1,351 living alone ), Female householders: 5,421 (2,330 living alone )4,882 spouses (4,854 opposite-sex spouses ), 405 unmarried partners , (395 opposite-sex unmarried partners ), 6,447 children (6,193 natural , 39 adopted , 214 stepchildren ), 327 grandchildren , 276 brothers or sisters , 356 parents , 18 foster children , 261 other relatives , 406 non-relatives In group quarters: 407
Size of family households: 2,847 2-persons , 1,714 3-persons , 1,074 4-persons , 400 5-persons , 60 6-persons , 185 7-or-more-persons .
Size of nonfamily households: 3,816 1-person , 374 2-persons , 12 3-persons , 6 4-persons .
3,042 married couples with children. single-parent households (182 men , 964 women ).
68.9% of residents of Westmont speak English at home. of residents speak Spanish at home (60% speak English very well , 22% speak English well , 11% speak English not well , 7% don't speak English at all ).of residents speak other Indo-European language at home (75% speak English very well , 19% speak English well , 5% speak English not well , 1% don't speak English at all ).of residents speak Asian or Pacific Island language at home (68% speak English very well , 24% speak English well , 2% speak English not well , 5% don't speak English at all ).of residents speak other language at home (66% speak English very well , 17% speak English well , 17% speak English not well ).
Foreign born population: 5,967 (24.8%)of them are naturalized citizens )
Median number of rooms in houses and condos:
Median number of rooms in apartments
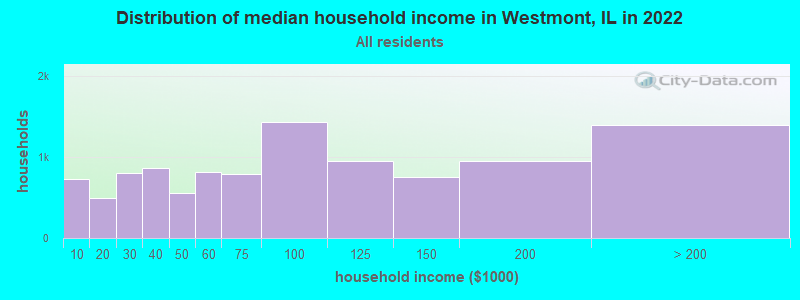
Westmont, IL household income distribution 730 Less than $10,000494 $10,000 to $19,999797 $20,000 to $29,999868 $30,000 to $39,999551 $40,000 to $49,999809 $50,000 to $59,999784 $60,000 to $74,9991,431 $75,000 to $99,999955 $100,000 to $124,999752 $125,000 to $149,999946 $150,000 to $199,9991,399 $200,000 or more
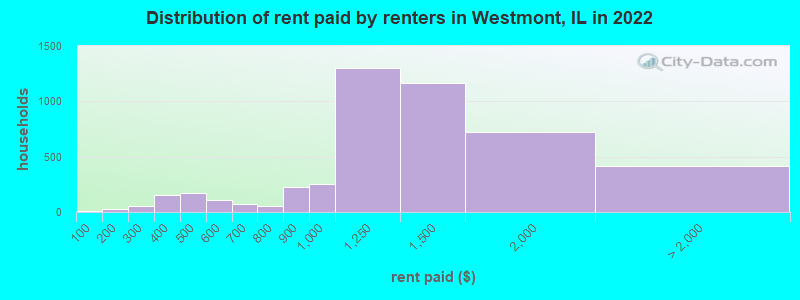
Home value of owner - occupied houses in 2022 in Westmont, IL 16 Less than $10,0005 $20,000 to $24,99977 $25,000 to $29,9998 $40,000 to $49,99937 $50,000 to $59,99914 $70,000 to $79,99950 $80,000 to $89,99930 $90,000 to $99,999107 $100,000 to $124,999100 $125,000 to $149,999142 $150,000 to $174,999203 $175,000 to $199,999425 $200,000 to $249,999594 $250,000 to $299,9991,432 $300,000 to $399,999978 $400,000 to $499,9991,000 $500,000 to $749,999229 $750,000 to $999,99941 $1,000,000 to $1,499,99913 $2,000,000 or moreRent paid by renters in 2022 in Westmont, IL 12 Less than $10026 $150 to $19921 $200 to $24935 $250 to $29991 $300 to $34962 $350 to $399104 $400 to $44964 $450 to $49957 $500 to $54946 $550 to $59957 $600 to $64912 $650 to $69921 $700 to $74930 $750 to $799226 $800 to $899254 $900 to $9991,302 $1,000 to $1,2491,162 $1,250 to $1,499718 $1,500 to $1,999277 $2,000 to $2,49943 $2,500 to $2,99914 $3,500 or more75 No cash rent
Percentage of workers working in this county: 68.9%Number of people working at home: 2,423 (19.8% of all workers )
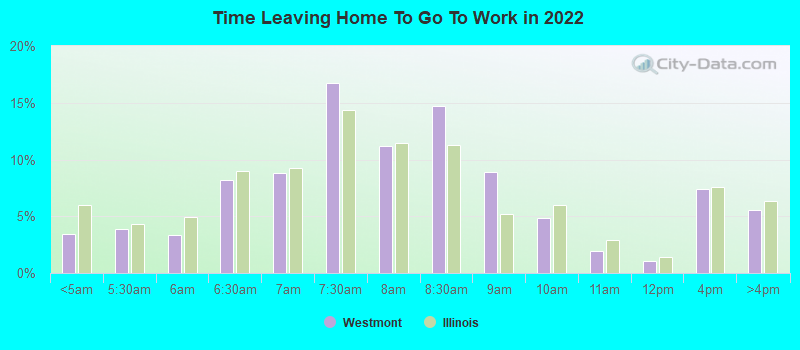
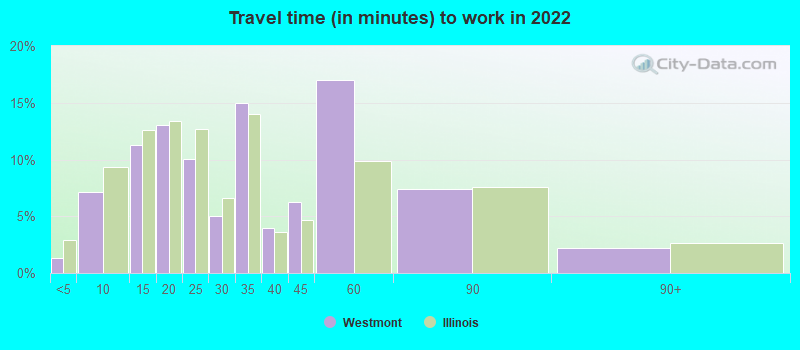
Travel time to work (commute)
Less than 5 minutes: 1835 to 9 minutes: 80410 to 14 minutes: 1,10515 to 19 minutes: 2,15320 to 24 minutes: 1,19825 to 29 minutes: 68830 to 34 minutes: 1,43635 to 39 minutes: 24040 to 44 minutes: 62045 to 59 minutes: 79160 to 89 minutes: 48290 or more minutes: 138
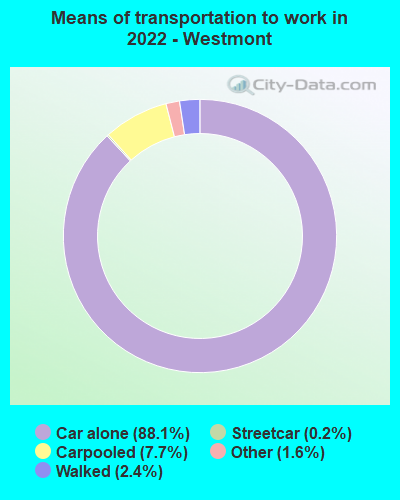
Means of transportation to work:
Drove a car alone: 9,608 (70.9%)Carpooled: 1,033 (7.6%)Bus : 14 (0.1%)Subway or elevated rail : 20 (0.1%)Taxi: 195 (1.4%)Walked: 246 (1.8%)Worked at home: 2,423 (17.9%)
Unemployment by race in 2022
Unemployment rate for White non-Hispanic residents 3.0% Males2.7% FemalesUnemployment rate for Black residents 18.8% MalesUnemployment rate for Asian residents 1.5% Males1.7% FemalesUnemployment rate for two or more race residents 8.7% MalesUnemployment rate for Hispanic or Latino residents 2.0% Males
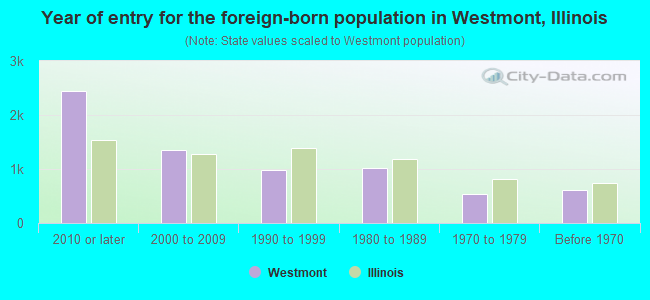
Year of entry for the foreign-born population in Westmont, Illinois
2,445 2010 or later 1,348 2000 to 2009 983 1990 to 1999 1,018 1980 to 1989 539 1970 to 1979 613 Before 1970
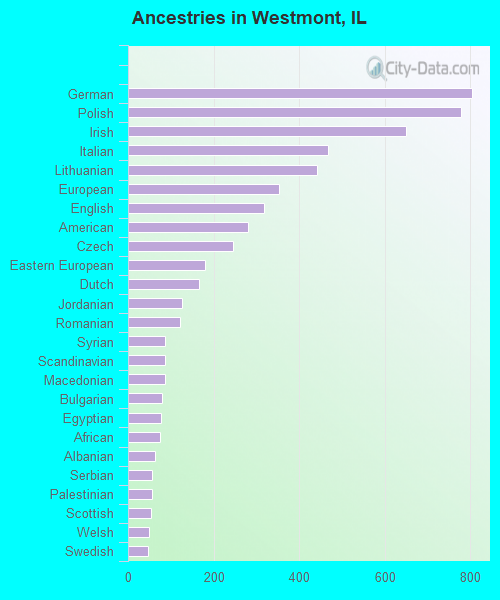
First ancestries reported:
German: 804 (6.4%)
Polish: 778 (6.2%)
Irish: 650 (5.2%)
Italian: 467 (3.7%)
Lithuanian: 442 (3.5%)
European: 352 (2.8%)
English: 319 (2.5%)
American: 280 (2.2%)
Czech: 245 (2.0%)
Eastern European: 181 (1.4%)
Dutch: 165 (1.3%)
Jordanian: 127 (1.0%)
Romanian: 122 (1.0%)
Syrian: 86 (0.7%)
Scandinavian: 86 (0.7%)
Macedonian: 86 (0.7%)
Bulgarian: 79 (0.6%)
Egyptian: 78 (0.6%)
African: 76 (0.6%)
Albanian: 62 (0.5%)
Serbian: 57 (0.5%)
Palestinian: 55 (0.4%)
Scottish: 54 (0.4%)
Welsh: 49 (0.4%)
Swedish: 46 (0.4%)
Greek: 44 (0.4%)
Iranian: 41 (0.3%)
Czechoslovakian: 37 (0.3%)
Scotch-Irish: 37 (0.3%)
Moroccan: 36 (0.3%)
Croatian: 35 (0.3%)
Lebanese: 34 (0.3%)
Norwegian: 32 (0.3%)
Turkish: 29 (0.2%)
Slovak: 28 (0.2%)
Belgian: 27 (0.2%)
Ukrainian: 26 (0.2%)
Australian: 24 (0.2%)
British: 22 (0.2%)
Hungarian: 21 (0.2%)
French: 20 (0.2%)
Slovene: 17 (0.1%)
Slavic: 15 (0.1%)
Arab: 13 (0.1%)
Estonian: 13 (0.1%)
Jamaican: 11 (0.09%)
Danish: 10 (0.08%)
Brazilian: 10 (0.08%)
Swiss: 10 (0.08%)
French Canadian: 6 (0.05%)
Northern European: 5 (0.04%)
Most common places of birth for foreign-born residents (%): India Westmont:
24.1% (1,444)Illinois:
9.2% (166,409)
Mexico Westmont:
18.2% (1,095)Illinois:
34.7% (626,958)
Lithuania Westmont:
6.1% (365)Illinois:
0.6% (10,249)
Philippines Westmont:
5.0% (302)Illinois:
5.2% (93,003)
China, excluding Hong Kong and Taiwan Westmont:
4.7% (284)Illinois:
4.1% (74,364)
Taiwan Westmont:
4.6% (278)Illinois:
0.5% (8,235)
Lebanon Westmont:
3.9% (233)Illinois:
0.2% (3,080)
Syria Westmont:
2.4% (145)Illinois:
0.4% (6,781)
North Macedonia (Macedonia) Westmont:
2.2% (133)Illinois:
0.2% (4,211)
Germany Westmont:
2.1% (124)Illinois:
1.0% (18,753)
Iran Westmont:
2.0% (121)Illinois:
0.4% (6,922)
Poland Westmont:
2.0% (120)Illinois:
6.9% (124,474)
Belarus Westmont:
1.6% (95)Illinois:
0.3% (6,186)
Place of birth for U.S.-born residents:
This state: 14,067Other state: 3,796Northeast: 871Midwest: 1,567South: 811West: 531 87.2% of Westmont residents lived in the same house 1 years ago.
Out of people who lived in different houses, 31.0% lived in this county.
Out of people who lived in different counties, 72.6% lived in Illinois.
Westmont:
87.2%State average:
88.3%
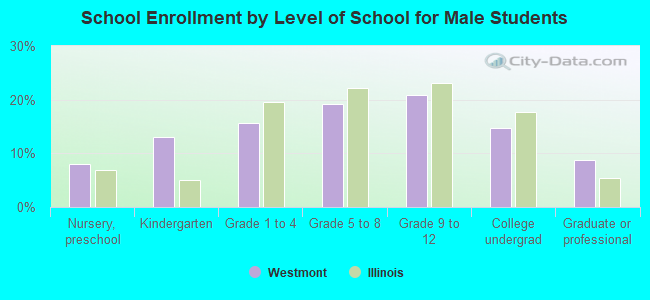
Education attainment for males 25 years and older:
No schooling: 144Nursery to 4th grade: 05th and 6th grade: 437th and 8th grade: 229th grade: 2510th grade: 3011th grade: 2712th grade, no diploma: 96High school graduate (or equivalency): 1,478Less than 1 year of college: 440Some college more than 1 year, no degree: 947Associate degree: 453Bachelor's degree: 2,385Master's degree: 1,176Professional school degree: 389Doctorate degree: 238
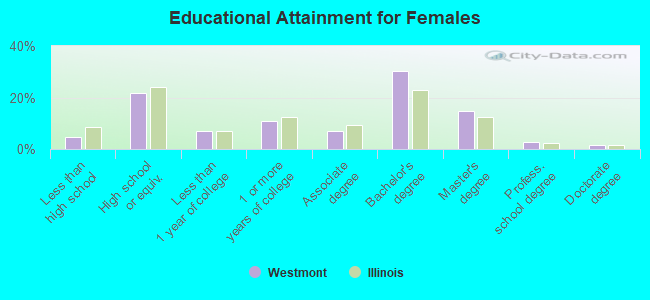
Education attainment for females 25 years and older:
No schooling: 169Nursery to 4th grade: 115th and 6th grade: 607th and 8th grade: 189th grade: 1610th grade: 8811th grade: 7012th grade, no diploma: 14High school graduate (or equivalency): 2,118Less than 1 year of college: 673Some college more than 1 year, no degree: 1,073Associate degree: 669Bachelor's degree: 2,938Master's degree: 1,445Professional school degree: 259Doctorate degree: 136
Housing units in structures:
One, detached: 4,474One, attached: 1,069Two: 1333 or 4: 5795 to 9: 1,33010 to 19: 1,48020 to 49: 90650 or more: 1,285Housing units lacking complete plumbing facilities in 2022: 0.3%Housing units lacking complete kitchen facilities in 2022: 0.4%House/condo owner moved in on average 13 years ago
Renter moved in on average 4 years ago
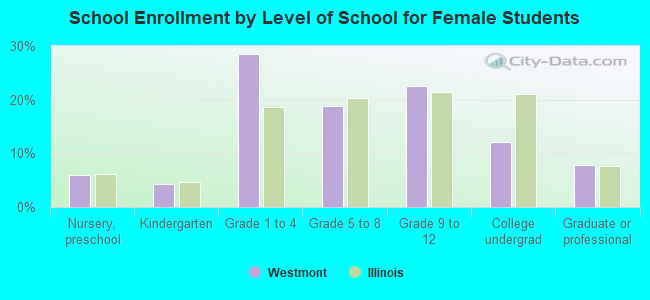
Private vs. public school enrollment:
Students in private schools in grades 1 to 8 (elementary and middle school): 299 Students in private schools in grades 9 to 12 (high school): 110 Students in private undergraduate colleges: 180