Westmoreland, NY (New York) Houses and Residents
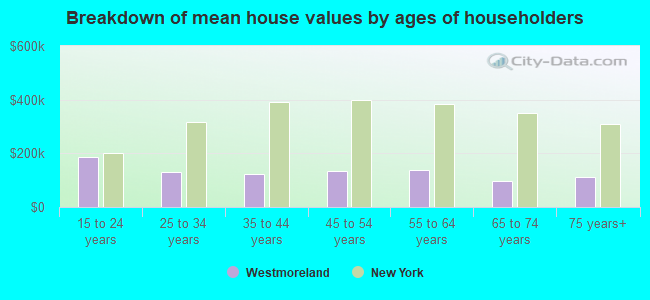
| Westmoreland: | $178,451 |
| New York: | $400,400 |
Total population: 6,138 (Urban population: 284, Rural population: 5,923 (69 farm, 5,854 nonfarm))
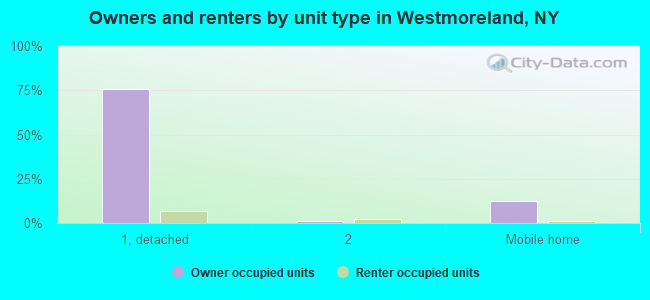
Houses: 2,323 (2,234 occupied: 1,994 owner occupied, 240 renter occupied)
| % of renters here: | 11% |
| State: | 46% |
Housing density: 54 houses/condos per square mile
Median price asked for vacant for-sale houses and condos in 2022 in this county: $174,734.
Median contract rent in 2022: $931 (lower quartile is $713, upper quartile is $1,356)
Median rent asked for vacant for-rent units in 2022: $925
Median gross rent in Westmoreland, NY in 2022: $1,245
Housing units in Westmoreland with a mortgage: 883 (26 second mortgage, 164 home equity loan, 0 both second mortgage and home equity loan)
Houses without a mortgage: 503
Compare current foreclosures near Westmoreland, NY:
| Photo | Address | Area | Beds / Baths | Price | Details |
|---|---|---|---|---|---|

|
#1
Kellogg St
Clinton, NY 13323
|
1,152 sq. feet
|
1 baths 3 beds |
$44,900
|
show details |

|
#2
Broad St
Durhamville, NY 13054
|
1,248 sq. feet
|
1 baths 3 beds |
show details | |

|
#3
Miller St
Utica, NY 13501
|
1,900 sq. feet
|
1 baths 3 beds |
show details | |

|
#4
Turin Rd
Rome, NY 13440
|
1,510 sq. feet
|
2 baths 5 beds |
show details | |

|
#5
Floyd Ave
Rome, NY 13440
|
1,637 sq. feet
|
1 baths 3 beds |
show details | |

|
#6
Healy Ave
Rome, NY 13440
|
1,566 sq. feet
|
1 baths 3 beds |
show details | |

|
#7
Arlington Ter
Utica, NY 13501
|
1,968 sq. feet
|
2 baths 4 beds |
show details | |

|
#8
Reels Dr
Utica, NY 13502
|
925 sq. feet
|
1 baths 3 beds |
show details | |

|
#9
Passer Rd
Blossvale, NY 13308
|
1,170 sq. feet
|
2 baths 3 beds |
show details | |

|
#10
Downer Ave
Utica, NY 13502
|
1,547 sq. feet
|
2 baths 3 beds |
show details |
| Photo | Address | Area | Beds / Baths | Price | Details |
|---|---|---|---|---|---|

|
#11
Marnie St
Utica, NY 13502
|
1,485 sq. feet
|
1 baths 3 beds |
show details | |

|
#12
Dewitt Ln
Rome, NY 13440
|
925 sq. feet
|
1 baths 3 beds |
show details | |

|
#13
Lock Rd
Rome, NY 13440
|
1,285 sq. feet
|
1 baths 2 beds |
show details | |

|
#14
Stop 7 Rd
Whitesboro, NY 13492
|
1,456 sq. feet
|
2 baths 3 beds |
show details | |

|
#15
Nys Route 26
Vernon, NY 13476
|
1,310 sq. feet
|
1 baths 4 beds |
show details | |

|
#16
Coleman Mills Rd
Rome, NY 13440
|
1,269 sq. feet
|
1 baths 3 beds |
show details | |

|
#17
Streun Rd
Taberg, NY 13471
|
1,327 sq. feet
|
2 baths 4 beds |
show details | |

|
#18
Sinclair Ave
Utica, NY 13502
|
1,728 sq. feet
|
1 baths 4 beds |
show details | |

|
#19
2nd St
Yorkville, NY 13495
|
- sq. feet
|
1 baths 3 beds |
show details | |

|
#20
Franklyn St
Rome, NY 13440
|
1,330 sq. feet
|
1 baths 3 beds |
show details |
| Photo | Address | Area | Beds / Baths | Price | Details |
|---|---|---|---|---|---|

|
#21
Eaton Rd
Marcy, NY 13403
|
1,560 sq. feet
|
2 baths 3 beds |
show details | |

|
#22
Tamarack St
Utica, NY 13502
|
1,400 sq. feet
|
1 baths 3 beds |
show details | |

|
#23
Mcvean St
Utica, NY 13502
|
1,760 sq. feet
|
1 baths 4 beds |
show details | |

|
#24
N Lake St
Oneida, NY 13421
|
708 sq. feet
|
1 baths 2 beds |
show details | |

|
#25
N Willow St
Oneida, NY 13421
|
1,326 sq. feet
|
1 baths 3 beds |
show details | |

|
#26
Shank Ave
Rome, NY 13440
|
1,629 sq. feet
|
1 baths 3 beds |
show details | |

|
#27
Railroad St
Stittville, NY 13469
|
2,336 sq. feet
|
1 baths 2 beds |
show details | |

|
#28
Foster St
Durhamville, NY 13054
|
1,078 sq. feet
|
1 baths 2 beds |
show details | |

|
#29
Oneida St
New Hartford, NY 13413
|
1,920 sq. feet
|
2 baths 4 beds |
show details | |

|
#30
Belmont Ave
Oneida, NY 13421
|
1,296 sq. feet
|
2 baths 2 beds |
show details |
| Photo | Address | Area | Beds / Baths | Price | Details |
|---|---|---|---|---|---|

|
#31
Boyce Ave # 1
Utica, NY 13501
|
2,550 sq. feet
|
2 baths 6 beds |
show details | |

|
#32
Seneca St
Oneida, NY 13421
|
1,236 sq. feet
|
1 baths 3 beds |
show details | |

|
#33
High St
Utica, NY 13501
|
1,864 sq. feet
|
2 baths 3 beds |
show details | |

|
#34
Lowell Rd
Rome, NY 13440
|
1,386 sq. feet
|
2 baths 3 beds |
show details | |

|
#35
Lorena Rd
Rome, NY 13440
|
1,377 sq. feet
|
1 baths 3 beds |
show details | |

|
#36
Highland Ave
Utica, NY 13502
|
1,352 sq. feet
|
1 baths 4 beds |
show details | |

|
#37
Oswego Rd
Rome, NY 13440
|
2,579 sq. feet
|
2 baths 3 beds |
show details | |

|
#38
The Vineyard
Oneida, NY 13421
|
1,364 sq. feet
|
1 baths 4 beds |
show details | |

|
#39
Lynch Ave
Utica, NY 13502
|
1,869 sq. feet
|
2 baths 4 beds |
show details | |

|
#40
Cemetery Rd
Rome, NY 13440
|
1,808 sq. feet
|
2 baths 4 beds |
show details |
| Photo | Address | Area | Beds / Baths | Price | Details |
|---|---|---|---|---|---|

|
#41
Maxwell Rd
Clinton, NY 13323
|
1,748 sq. feet
|
2 baths 3 beds |
show details | |

|
#42
Tabor Pl
Utica, NY 13502
|
792 sq. feet
|
1 baths 2 beds |
show details | |

|
#43
Sinclair Ave
Utica, NY 13502
|
1,332 sq. feet
|
1 baths 3 beds |
show details | |

|
#44
Sunnyside Dr
Utica, NY 13501
|
1,260 sq. feet
|
1 baths 3 beds |
show details | |

|
#45
Kenyon Ct
Utica, NY 13501
|
1,232 sq. feet
|
1 baths 3 beds |
show details | |

|
#46
Caroline St
Utica, NY 13502
|
2,470 sq. feet
|
2 baths 3 beds |
show details | |

|
#47
Glen Rd N
Rome, NY 13440
|
1,200 sq. feet
|
1 baths 3 beds |
show details | |

|
#48
Mathews Ave
Utica, NY 13502
|
1,848 sq. feet
|
2 baths 4 beds |
show details | |

|
#49
Hayes Rd
Marcy, NY 13403
|
1,320 sq. feet
|
1 baths 3 beds |
show details | |

|
Check over 1 million property listings on Foreclosure.com!
|
browse all offers | |||

Latest news about housing in Westmoreland, NY collected exclusively by city-data.com from local newspapers, TV, and radio stations


Household type by relationship:
Households: 221,473- In family households: 180,003 (38,915 male householders, 19,474 female householders)
41,459 spouses, 64,645 children (60,737 natural, 1,263 adopted, 2,645 stepchildren), 3,730 grandchildren, 1,655 brothers or sisters, 1,752 parents, foster children, 1,721 other relatives, 5,703 non-relatives
- In nonfamily households: 41,470 (16,117 male householders (12,914 living alone)), 18,522 female householders (16,047 living alone)), 6,831 nonrelatives
- In group quarters: 13,405 (8,414 institutionalized population)
36,373 married couples with children.
15,413 single-parent households (3,340 men, 12,073 women).
95.9% of residents of Westmoreland speak English at home.
1.0% of residents speak Spanish at home (100% speak English very well).
2.6% of residents speak other Indo-European language at home (55% speak English very well, 26% speak English well, 6% speak English not well, 13% don't speak English at all).
0.5% of residents speak Asian or Pacific Island language at home (66% speak English very well, 34% speak English not well).
Foreign born population: 221 (3.7%)
(140.7% of them are naturalized citizens)
| Here: | 6.8 |
| State: | 6.3 |
| Here: | 5.6 |
| State: | 3.8 |
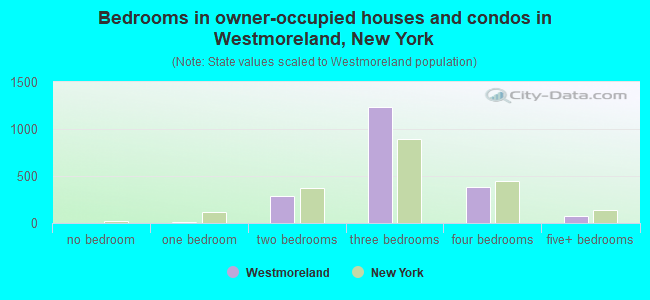
- Bedrooms in owner-occupied houses and condos in Westmoreland, New York
- 0no bedroom
- 71 bedroom
- 2912 bedrooms
- 1,2383 bedrooms
- 3814 bedrooms
- 775+ bedrooms
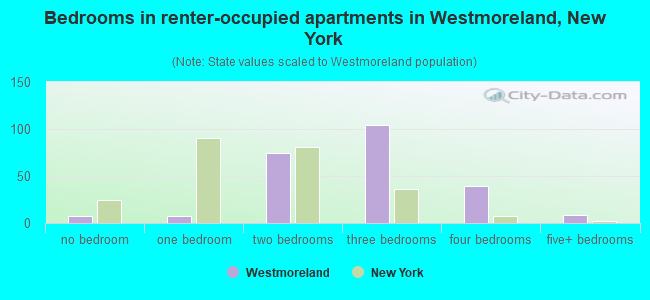
- Bedrooms in renter-occupied apartments in Westmoreland, New York
- 7no bedroom
- 71 bedroom
- 742 bedrooms
- 1043 bedrooms
- 394 bedrooms
- 95+ bedrooms
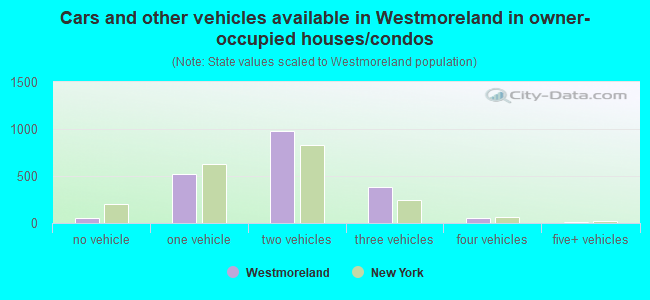
- Cars and other vehicles available in Westmoreland in owner-occupied houses/condos
- 48no vehicle
- 5221 vehicle
- 9812 vehicles
- 3793 vehicles
- 524 vehicles
- 125+ vehicles
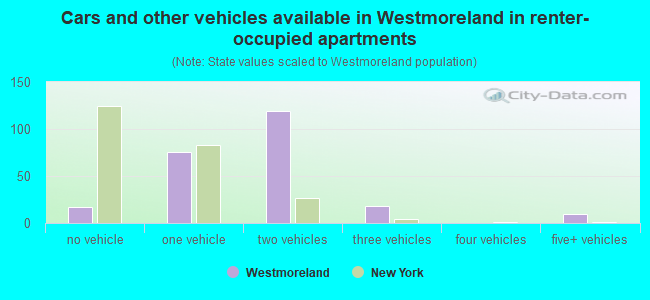
- Cars and other vehicles available in Westmoreland in renter-occupied apartments
- 17no vehicle
- 761 vehicle
- 1192 vehicles
- 183 vehicles
- 04 vehicles
- 105+ vehicles
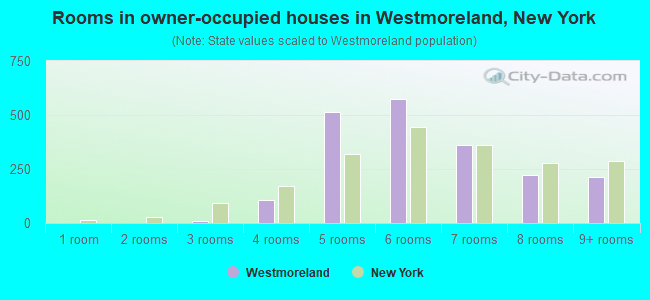
- Rooms in owner-occupied houses in Westmoreland, New York
- 01 room
- 02 rooms
- 73 rooms
- 1054 rooms
- 5135 rooms
- 5736 rooms
- 3617 rooms
- 2228 rooms
- 2139+ rooms
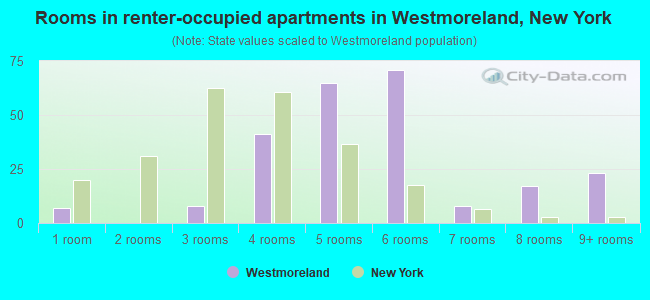
- Rooms in renter-occupied apartments in Westmoreland, New York
- 71 room
- 02 rooms
- 83 rooms
- 414 rooms
- 655 rooms
- 716 rooms
- 87 rooms
- 178 rooms
- 239+ rooms
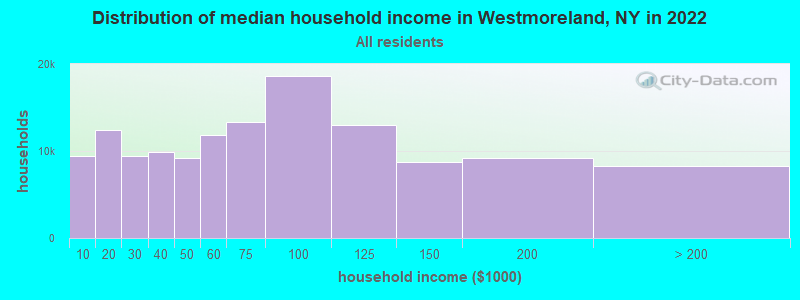
Westmoreland, NY household income distribution

- 9,477Less than $10,000
- 12,397$10,000 to $19,999
- 9,455$20,000 to $29,999
- 9,835$30,000 to $39,999
- 9,232$40,000 to $49,999
- 11,807$50,000 to $59,999
- 13,346$60,000 to $74,999
- 18,678$75,000 to $99,999
- 13,026$100,000 to $124,999
- 8,773$125,000 to $149,999
- 9,179$150,000 to $199,999
- 8,250$200,000 or more
Percentage of workers working in this county: 85.0%
Number of people working at home: 377 (12.4% of all workers)
Travel time to work (commute)
- Less than 5 minutes: 103
- 5 to 9 minutes: 292
- 10 to 14 minutes: 457
- 15 to 19 minutes: 716
- 20 to 24 minutes: 728
- 25 to 29 minutes: 194
- 30 to 34 minutes: 261
- 35 to 39 minutes: 8
- 40 to 44 minutes: 12
- 45 to 59 minutes: 139
- 60 to 89 minutes: 78
- 90 or more minutes: 31
Means of transportation to work:
- Drove a car alone: 2,582 (82.8%)
- Carpooled: 341 (10.9%)
- Railroad: 17 (0.5%)
- Walked: 42 (1.3%)
- Other means: 37 (1.2%)
- Worked at home: 98 (3.1%)
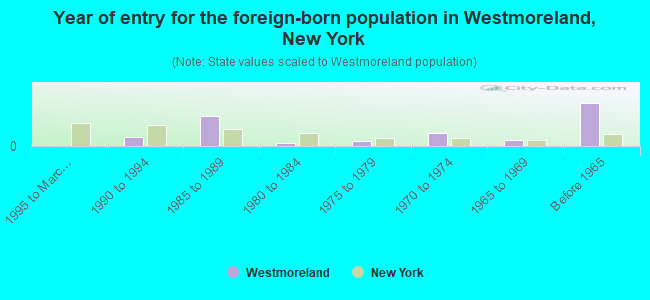
- Year of entry for the foreign-born population in Westmoreland, New York
- 01995 to March 2000
- 111990 to 1994
- 381985 to 1989
- 41980 to 1984
- 61975 to 1979
- 161970 to 1974
- 81965 to 1969
- 54Before 1965
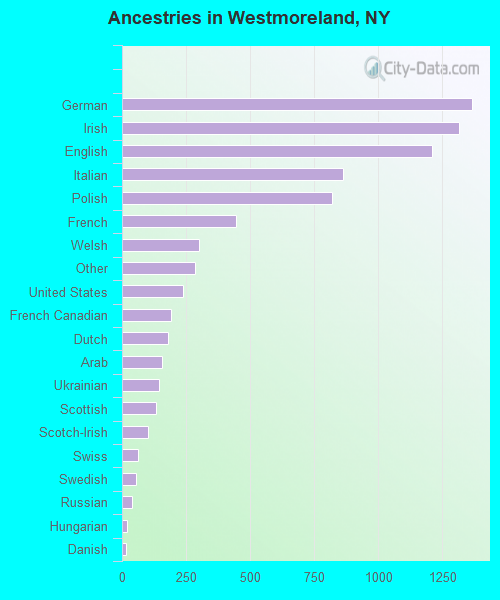
First ancestries reported:
- German: 1,365 (17.2%)
- Irish: 1,316 (16.6%)
- English: 1,212 (15.2%)
- Italian: 865 (10.9%)
- Polish: 819 (10.3%)
- French: 446 (5.6%)
- Welsh: 300 (3.8%)
- Other: 287 (3.6%)
- United States: 239 (3.0%)
- French Canadian: 192 (2.4%)
- Dutch: 178 (2.2%)
- Arab: 155 (1.9%)
- Ukrainian: 143 (1.8%)
- Scottish: 133 (1.7%)
- Scotch-Irish: 102 (1.3%)
- Swiss: 61 (0.8%)
- Swedish: 54 (0.7%)
- Russian: 38 (0.5%)
- Hungarian: 19 (0.2%)
- Danish: 14 (0.2%)
- Lithuanian: 6 (0.08%)
- Subsaharan African: 6 (0.08%)
Most common places of birth for foreign-born residents (%):
| Westmoreland: | 27.7% (38) |
| New York: | 1.4% (53,825) |
| Westmoreland: | 16.8% (23) |
| New York: | 1.6% (62,237) |
| Westmoreland: | 14.6% (20) |
| New York: | 3.8% (147,729) |
| Westmoreland: | 13.9% (19) |
| New York: | 1.8% (69,327) |
| Westmoreland: | 8.0% (11) |
| New York: | 0.6% (25,141) |
| Westmoreland: | 6.6% (9) |
| New York: | 0.2% (7,400) |
| Westmoreland: | 5.1% (7) |
| New York: | 0.3% (10,672) |
| Westmoreland: | 4.4% (6) |
| New York: | 0.1% (4,273) |
| Westmoreland: | 2.9% (4) |
| New York: | 1.9% (72,408) |
Place of birth for U.S.-born residents:
- This state: 5,481
- Other state: 580
- Northeast: 358
- Midwest: 46
- South: 127
- West: 49
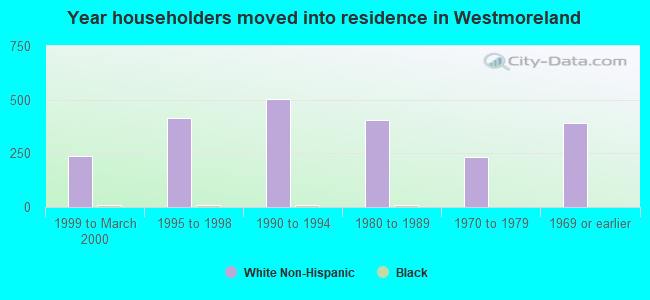
73% of Westmoreland residents lived in the same house 5 years ago.
Out of people who lived in different houses, 83% lived in this county.
Out of people who lived in different counties, 61% lived in New York.
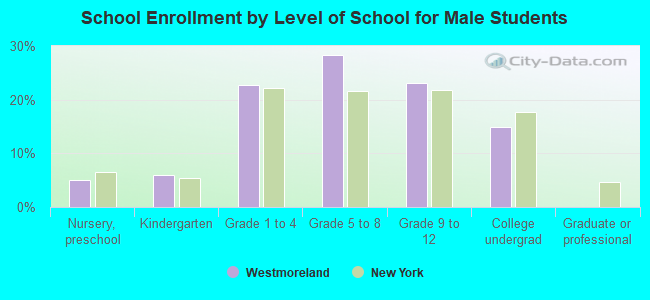
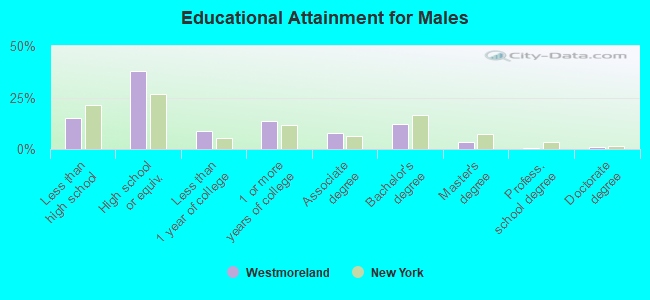
Education attainment for males 25 years and older:
- No schooling: 0
- Nursery to 4th grade: 0
- 5th and 6th grade: 28
- 7th and 8th grade: 30
- 9th grade: 38
- 10th grade: 49
- 11th grade: 95
- 12th grade, no diploma: 59
- High school graduate (or equivalency): 764
- Less than 1 year of college: 175
- Some college more than 1 year, no degree: 275
- Associate degree: 152
- Bachelor's degree: 239
- Master's degree: 72
- Professional school degree: 7
- Doctorate degree: 23
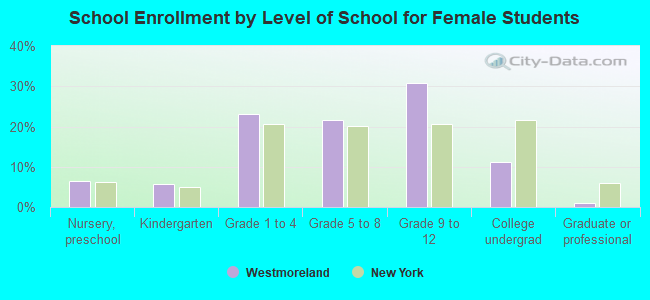
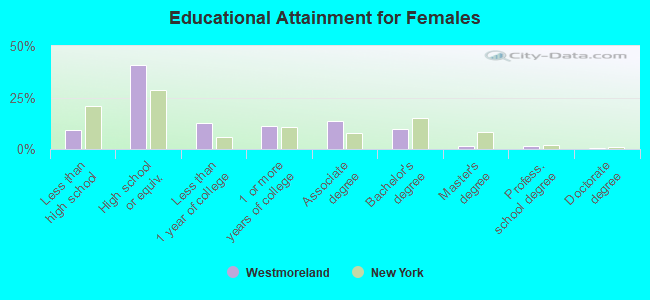
Education attainment for females 25 years and older:
- No schooling: 0
- Nursery to 4th grade: 5
- 5th and 6th grade: 0
- 7th and 8th grade: 28
- 9th grade: 29
- 10th grade: 35
- 11th grade: 45
- 12th grade, no diploma: 47
- High school graduate (or equivalency): 850
- Less than 1 year of college: 261
- Some college more than 1 year, no degree: 231
- Associate degree: 289
- Bachelor's degree: 203
- Master's degree: 31
- Professional school degree: 31
- Doctorate degree: 10


Housing units in structures:
- One, detached: 1,895
- One, attached: 8
- Two: 79
- 3 or 4: 7
- 5 to 9: 7
- Mobile homes: 327
Median worth of mobile homes: $115,968
Housing units lacking complete kitchen facilities: 0.9%
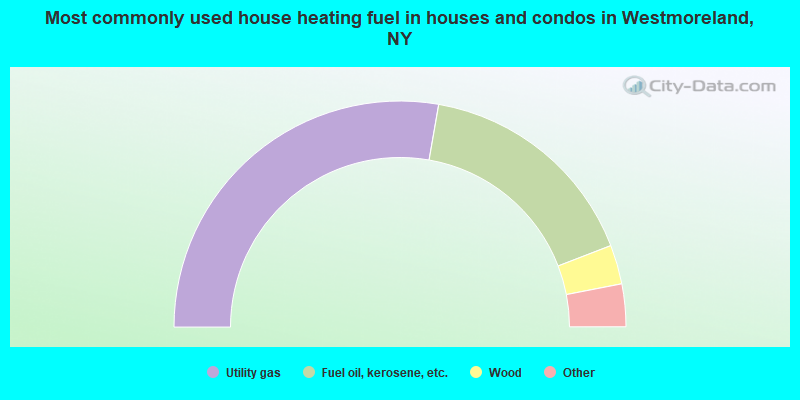
- 55.5%Utility gas
- 32.8%Fuel oil, kerosene, etc.
- 5.6%Wood
- 3.2%Electricity
- 2.3%Bottled, tank, or LP gas
- 0.6%Other fuel
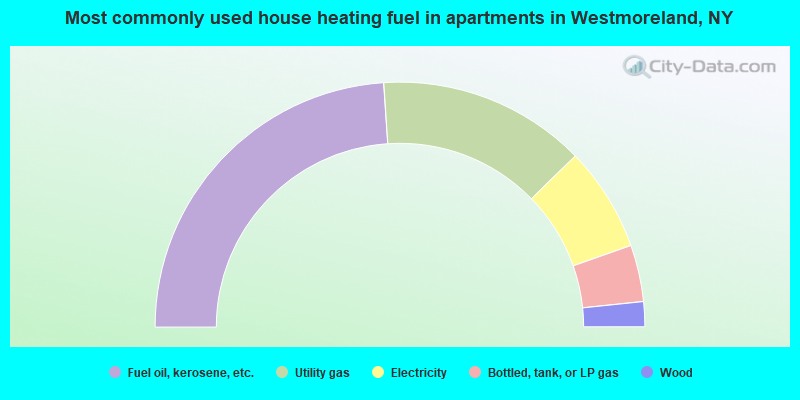
- 47.9%Fuel oil, kerosene, etc.
- 27.5%Utility gas
- 13.8%Electricity
- 7.5%Bottled, tank, or LP gas
- 3.3%Wood
Private vs. public school enrollment:
| Here: | 4.7% |
| New York: | 14.0% |
| Here: | 4.1% |
| New York: | 13.2% |
| Here: | 6.7% |
| New York: | 38.2% |