Weybridge, VT (Vermont) Houses and Residents
| Weybridge: | $428,985 |
| Vermont: | $304,700 |
Total population: 833 (Urban population: 35 (all inside urban clusters), Rural population: 789 (17 farm, 772 nonfarm))
Houses: 334 (322 occupied: 270 owner occupied, 52 renter occupied)
| % of renters here: | 16% |
| State: | 26% |
Housing density: 20 houses/condos per square mile
Median price asked for vacant for-sale houses and condos in 2022 in this county: $228,979.
Median contract rent in 2022: $1,065 (lower quartile is $847, upper quartile is $1,436)
Median gross rent in Weybridge, VT in 2022: $1,140
Housing units in Weybridge with a mortgage: 88 (5 second mortgage, 29 home equity loan, 0 both second mortgage and home equity loan)
Houses without a mortgage: 60
Compare current foreclosures near Weybridge, VT:
| Photo | Address | Area | Beds / Baths | Price | Details |
|---|---|---|---|---|---|

|
#1
Creek Rd
Crown Point, NY 12928
|
1,640 sq. feet
|
2 baths 3 beds |
$42,000
|
show details |

|
#2
Raymond Wright Ave
Mineville, NY 12956
|
1,302 sq. feet
|
1 baths 3 beds |
show details | |

|
#3
Nys Route 9n
Ticonderoga, NY 12883
|
2,674 sq. feet
|
4 baths 5 beds |
show details | |

|
#4
Warner Hill Rd
Ticonderoga, NY 12883
|
1,361 sq. feet
|
2 baths 4 beds |
show details | |

|
#5
Raymond Wright Ave
Mineville, NY 12956
|
2,292 sq. feet
|
2 baths 6 beds |
show details | |

|
#6
Witherbee Rd
Witherbee, NY 12998
|
975 sq. feet
|
1 baths 2 beds |
show details | |

|
#7
Plank Rd
Mineville, NY 12956
|
1,182 sq. feet
|
1 baths 2 beds |
show details | |

|
#8
Shore Airport Rd
Ticonderoga, NY 12883
|
2,878 sq. feet
|
4 baths 5 beds |
show details | |

|
#9
Moriah Rd
Moriah, NY 12960
|
1,760 sq. feet
|
1 baths 4 beds |
show details | |

|
#10
Champlain Dr
Mineville, NY 12956
|
2,206 sq. feet
|
2 baths 3 beds |
show details |
| Photo | Address | Area | Beds / Baths | Price | Details |
|---|---|---|---|---|---|

|
#11
Creek Rd
Crown Point, NY 12928
|
1,648 sq. feet
|
1 baths 3 beds |
show details | |

|
#12
Windy Hill Rd
Moriah, NY 12960
|
1,162 sq. feet
|
1 baths 3 beds |
show details | |

|
#13
Ferry Rd
Crown Point, NY 12928
|
960 sq. feet
|
1 baths 3 beds |
show details | |

|
#14
Vt Route 116
Starksboro, VT 05487
|
- sq. feet
|
- baths - beds |
show details | |

|
#15
Cuttinghill Rd
Whiting, VT 05778
|
- sq. feet
|
- baths - beds |
show details | |

|
#16
Route 73
Orwell, VT 05760
|
- sq. feet
|
- baths - beds |
show details | |

|
#17
Armory Ln Apt 201
Vergennes, VT 05491
|
- sq. feet
|
- baths - beds |
show details | |

|
#18
Main St # 1
Port Henry, NY 12974
|
- sq. feet
|
- baths - beds |
show details | |

|
#19
Pine St # 4
Bristol, VT 05443
|
- sq. feet
|
- baths - beds |
show details | |

|
#20
Dynamite Ln
Mineville, NY 12956
|
- sq. feet
|
- baths - beds |
show details |
| Photo | Address | Area | Beds / Baths | Price | Details |
|---|---|---|---|---|---|

|
#21
N Meadow Dr
Bristol, VT 05443
|
- sq. feet
|
- baths - beds |
show details | |

|
#22
S Maple St
Vergennes, VT 05491
|
- sq. feet
|
- baths - beds |
show details | |

|
#23
Broad St
Port Henry, NY 12974
|
- sq. feet
|
- baths - beds |
show details | |

|
#24
Henrys Way
Ferrisburg, VT 05456
|
- sq. feet
|
- baths - beds |
show details | |

|
#25
Leicester Whiting Rd
Whiting, VT 05778
|
- sq. feet
|
- baths - beds |
show details | |

|
#26
Plank Rd
Vergennes, VT 05491
|
- sq. feet
|
- baths - beds |
show details | |

|
#27
Hardscrabble Rd
Bristol, VT 05443
|
- sq. feet
|
- baths - beds |
show details | |

|
#28
Rattlin Bridge Rd
Bridport, VT 05734
|
- sq. feet
|
- baths - beds |
show details | |

|
Check over 1 million property listings on Foreclosure.com!
|
browse all offers | |||
Latest news about housing in Weybridge, VT collected exclusively by city-data.com from local newspapers, TV, and radio stations

 | Does Vermont want another out-of-stater? (129 replies) |
| The COST of living in Vermont (108 replies) |
| Thoughts on living in Ferrisburg? (3 replies) |
| Discouraged!... but hopeful...Today show...anyone see it? (27 replies) |
| Southern VT (11 replies) |
| Family Considering Middlebury Area (1 reply) |

Household type by relationship:
Households: 33,969- In family households: 27,795 (6,422 male householders, 2,918 female householders)
7,510 spouses, 8,926 children (8,175 natural, 336 adopted, 415 stepchildren), 378 grandchildren, 176 brothers or sisters, 192 parents, foster children, 179 other relatives, 914 non-relatives
- In nonfamily households: 6,174 (2,298 male householders (1,677 living alone)), 2,446 female householders (1,912 living alone)), 1,430 nonrelatives
- In group quarters: 2,852 (163 institutionalized population)
6,630 married couples with children.
1,679 single-parent households (533 men, 1,146 women).
96.4% of residents of Weybridge speak English at home.
1.8% of residents speak Spanish at home (71% speak English very well, 29% speak English well).
1.8% of residents speak other Indo-European language at home (57% speak English very well, 43% speak English well).
Foreign born population: 32 (3.5%)
(46.9% of them are naturalized citizens)
| Here: | 6.4 |
| State: | 6.4 |
| Here: | 5.4 |
| State: | 3.9 |

- Bedrooms in owner-occupied houses and condos in Weybridge, Vermont
- 0no bedroom
- 21 bedroom
- 542 bedrooms
- 1223 bedrooms
- 784 bedrooms
- 145+ bedrooms

- Bedrooms in renter-occupied apartments in Weybridge, Vermont
- 0no bedroom
- 81 bedroom
- 182 bedrooms
- 153 bedrooms
- 74 bedrooms
- 45+ bedrooms

- Cars and other vehicles available in Weybridge in owner-occupied houses/condos
- 0no vehicle
- 611 vehicle
- 1482 vehicles
- 523 vehicles
- 74 vehicles
- 25+ vehicles

- Cars and other vehicles available in Weybridge in renter-occupied apartments
- 4no vehicle
- 281 vehicle
- 132 vehicles
- 33 vehicles
- 24 vehicles
- 25+ vehicles

- Rooms in owner-occupied houses in Weybridge, Vermont
- 01 room
- 02 rooms
- 43 rooms
- 84 rooms
- 555 rooms
- 526 rooms
- 637 rooms
- 418 rooms
- 479+ rooms

- Rooms in renter-occupied apartments in Weybridge, Vermont
- 01 room
- 02 rooms
- 43 rooms
- 84 rooms
- 135 rooms
- 86 rooms
- 77 rooms
- 48 rooms
- 89+ rooms


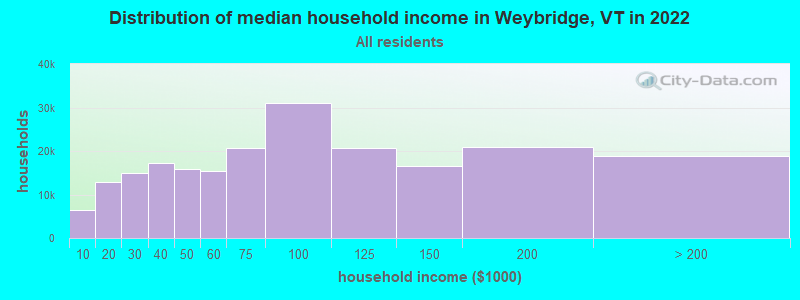
Weybridge, VT household income distribution

- 6,452Less than $10,000
- 12,972$10,000 to $19,999
- 14,840$20,000 to $29,999
- 17,147$30,000 to $39,999
- 15,929$40,000 to $49,999
- 15,510$50,000 to $59,999
- 20,691$60,000 to $74,999
- 31,148$75,000 to $99,999
- 20,696$100,000 to $124,999
- 16,501$125,000 to $149,999
- 21,007$150,000 to $199,999
- 18,912$200,000 or more
Percentage of workers working in this county: 86.4%
Number of people working at home: 77 (17.2% of all workers)
Travel time to work (commute)
- Less than 5 minutes: 20
- 5 to 9 minutes: 81
- 10 to 14 minutes: 95
- 15 to 19 minutes: 80
- 20 to 24 minutes: 17
- 25 to 29 minutes: 5
- 30 to 34 minutes: 18
- 35 to 39 minutes: 0
- 40 to 44 minutes: 6
- 45 to 59 minutes: 27
- 60 to 89 minutes: 17
- 90 or more minutes: 2
Means of transportation to work:
- Drove a car alone: 302 (73.5%)
- Carpooled: 45 (10.9%)
- Bicycle: 3 (0.7%)
- Walked: 18 (4.4%)
- Worked at home: 43 (10.5%)


- Year of entry for the foreign-born population in Weybridge, Vermont
- 31995 to March 2000
- 51990 to 1994
- 21985 to 1989
- 51980 to 1984
- 41975 to 1979
- 01970 to 1974
- 01965 to 1969
- 10Before 1965

First ancestries reported:
- English: 209 (19.6%)
- Irish: 145 (13.6%)
- United States: 105 (9.9%)
- Other: 99 (9.3%)
- French: 96 (9.0%)
- French Canadian: 83 (7.8%)
- German: 79 (7.4%)
- Swedish: 48 (4.5%)
- Italian: 39 (3.7%)
- Scottish: 33 (3.1%)
- Welsh: 24 (2.3%)
- Dutch: 21 (2.0%)
- Polish: 17 (1.6%)
- Russian: 11 (1.0%)
- Arab: 10 (0.9%)
- Danish: 10 (0.9%)
- Norwegian: 9 (0.8%)
- Scotch-Irish: 9 (0.8%)
- West Indian: 7 (0.7%)
- Swiss: 3 (0.3%)
- Czech: 2 (0.2%)
- Hungarian: 2 (0.2%)
- Lithuanian: 2 (0.2%)
- Ukrainian: 2 (0.2%)
Most common places of birth for foreign-born residents (%):
| Weybridge: | 51.7% (15) |
| Vermont: | 34.0% (7,912) |
| Weybridge: | 10.3% (3) |
| Vermont: | 0.8% (191) |
| Weybridge: | 10.3% (3) |
| Vermont: | 0.0% (11) |
| Weybridge: | 6.9% (2) |
| Vermont: | 7.2% (1,669) |
| Weybridge: | 6.9% (2) |
| Vermont: | 2.5% (588) |
| Weybridge: | 6.9% (2) |
| Vermont: | 0.3% (59) |
| Weybridge: | 6.9% (2) |
| Vermont: | 0.2% (48) |
Place of birth for U.S.-born residents:
- This state: 411
- Other state: 378
- Northeast: 249
- Midwest: 70
- South: 38
- West: 21
67% of Weybridge residents lived in the same house 5 years ago.
Out of people who lived in different houses, 67% lived in this county.
Out of people who lived in different counties, 30% lived in Vermont.
Education attainment for males 25 years and older:
- No schooling: 0
- Nursery to 4th grade: 0
- 5th and 6th grade: 2
- 7th and 8th grade: 16
- 9th grade: 0
- 10th grade: 0
- 11th grade: 4
- 12th grade, no diploma: 4
- High school graduate (or equivalency): 71
- Less than 1 year of college: 4
- Some college more than 1 year, no degree: 32
- Associate degree: 18
- Bachelor's degree: 51
- Master's degree: 33
- Professional school degree: 16
- Doctorate degree: 27

Education attainment for females 25 years and older:
- No schooling: 0
- Nursery to 4th grade: 0
- 5th and 6th grade: 2
- 7th and 8th grade: 3
- 9th grade: 2
- 10th grade: 4
- 11th grade: 2
- 12th grade, no diploma: 4
- High school graduate (or equivalency): 49
- Less than 1 year of college: 10
- Some college more than 1 year, no degree: 41
- Associate degree: 28
- Bachelor's degree: 89
- Master's degree: 45
- Professional school degree: 14
- Doctorate degree: 9


Housing units in structures:
- One, detached: 283
- One, attached: 12
- Two: 14
- 10 to 19: 2
- Mobile homes: 23
Median worth of mobile homes: $99,182

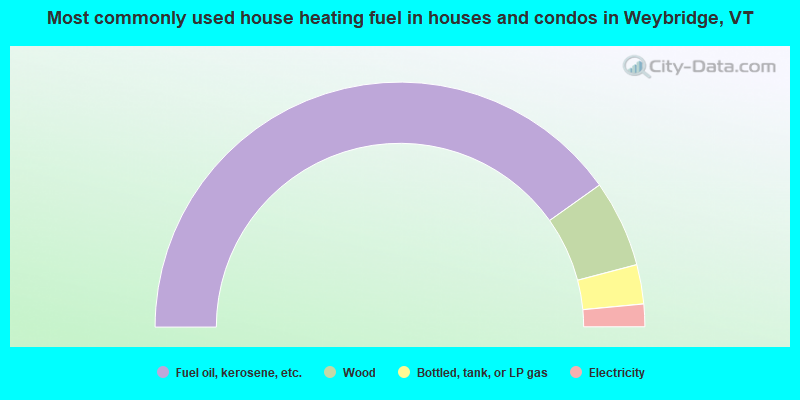
- 80.4%Fuel oil, kerosene, etc.
- 11.5%Wood
- 5.2%Bottled, tank, or LP gas
- 3.0%Electricity
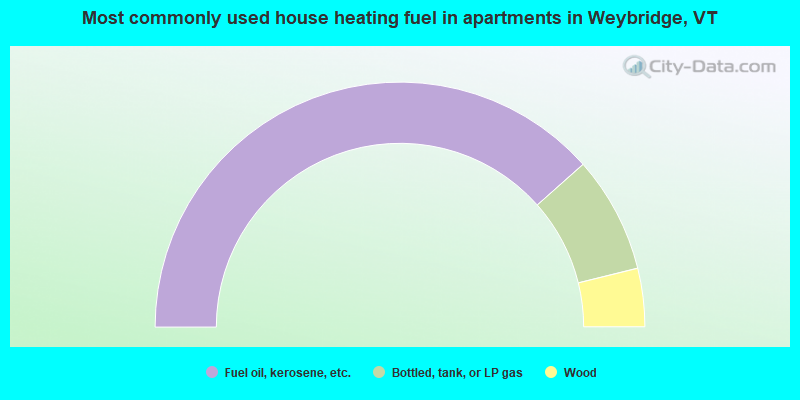
- 76.9%Fuel oil, kerosene, etc.
- 15.4%Bottled, tank, or LP gas
- 7.7%Wood
Private vs. public school enrollment:
| Here: | 4.5% |
| Vermont: | 7.2% |
| Here: | 21.6% |
| Vermont: | 10.4% |
| Here: | 36.4% |
| Vermont: | 37.7% |


