Wharton, TX (Texas) Houses and Residents
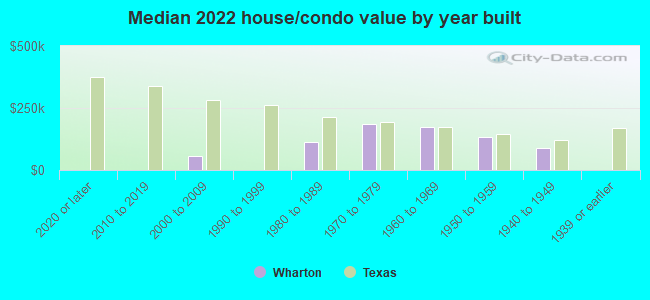
| Wharton: | $149,387 |
| Texas: | $275,400 |
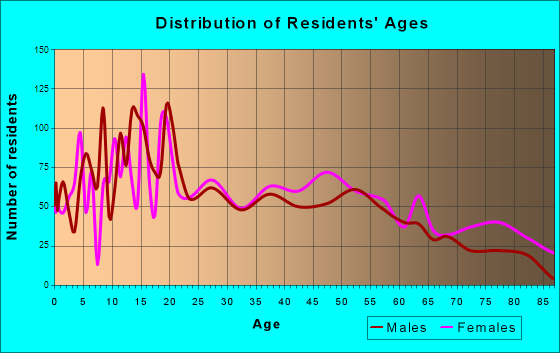
Total population: 8,659 (All urban)
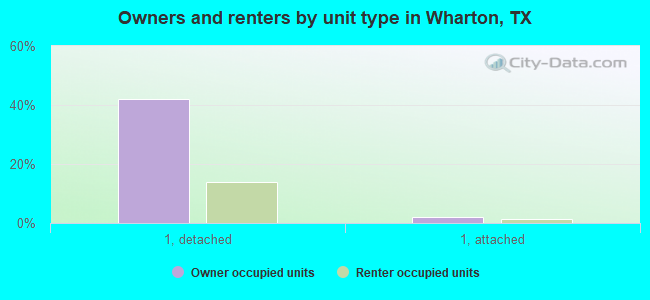
Houses: 4,272 (3,608 occupied: 1,656 owner occupied, 2,007 renter occupied)
| % of renters here: | 55% |
| State: | 38% |
Housing density: 591 houses/condos per square mile
Median price asked for vacant for-sale houses and condos in 2022 in this county: $200,664.
Median contract rent in 2022: $685 (lower quartile is $502, upper quartile is $904)
Median rent asked for vacant for-rent units in 2022: $854
Median gross rent in Wharton, TX in 2022: $808
Housing units in Wharton with a mortgage: 688 (109 second mortgage, 0 home equity loan, 66 both second mortgage and home equity loan)
Houses without a mortgage: 37
Median household income for houses/condos with a mortgage: $77,174
Median household income for apartments without a mortgage: $46,137
Median monthly housing costs: $783
Compare current foreclosures near Wharton, TX:
| Photo | Address | Area | Beds / Baths | Price | Details |
|---|---|---|---|---|---|

|
#1
Kelving Way
Wharton, TX 77488
|
1,350 sq. feet
|
- baths - beds |
show details | |

|
#2
Pecan Valley Dr
Wharton, TX 77488
|
- sq. feet
|
- baths - beds |
show details | |

|
#3
Speed St
Wharton, TX 77488
|
- sq. feet
|
- baths - beds |
show details | |

|
#4
County Road 174
Wharton, TX 77488
|
- sq. feet
|
- baths - beds |
show details | |

|
#5
W Emily Ave
Wharton, TX 77488
|
950 sq. feet
|
- baths - beds |
show details | |

|
#6
Alvin St
El Campo, TX 77437
|
1,172 sq. feet
|
2 baths 2 beds |
show details | |

|
#7
County Road 453
El Campo, TX 77437
|
2,160 sq. feet
|
- baths - beds |
show details | |

|
#8
Beasley Ave
Needville, TX 77461
|
1,250 sq. feet
|
- baths 3 beds |
show details | |

|
#9
Colony Rd
Needville, TX 77461
|
2,608 sq. feet
|
- baths 4 beds |
show details | |

|
#10
Lundy St
El Campo, TX 77437
|
2,004 sq. feet
|
- baths - beds |
show details |
| Photo | Address | Area | Beds / Baths | Price | Details |
|---|---|---|---|---|---|

|
#11
Battle Rd
Beasley, TX 77417
|
- sq. feet
|
- baths - beds |
show details | |

|
#12
Avenue C
El Campo, TX 77437
|
1,848 sq. feet
|
- baths - beds |
show details | |

|
#13
Braxton Rd
Kendleton, TX 77451
|
- sq. feet
|
- baths - beds |
show details | |

|
#14
Avenue D
El Campo, TX 77437
|
4,042 sq. feet
|
- baths - beds |
show details | |

|
#15
County Road 351
El Campo, TX 77437
|
- sq. feet
|
- baths - beds |
show details | |

|
#16
Clubside Dr
East Bernard, TX 77435
|
- sq. feet
|
- baths - beds |
show details | |

|
#17
Avenue K
El Campo, TX 77437
|
1,204 sq. feet
|
- baths - beds |
show details | |

|
#18
Lalla Rookh Ave
Boling, TX 77420
|
- sq. feet
|
- baths - beds |
show details | |

|
#19
Sam St
El Campo, TX 77437
|
1,368 sq. feet
|
- baths - beds |
show details | |

|
#20
Fm 1301 Rd
Pledger, TX 77468
|
- sq. feet
|
- baths - beds |
show details |
| Photo | Address | Area | Beds / Baths | Price | Details |
|---|---|---|---|---|---|

|
#21
W Norris St
El Campo, TX 77437
|
2,109 sq. feet
|
- baths - beds |
show details | |

|
#22
Hill Side Ln
Needville, TX 77461
|
1,320 sq. feet
|
- baths - beds |
show details | |

|
#23
County Road 460
El Campo, TX 77437
|
- sq. feet
|
- baths - beds |
show details | |

|
#24
Avenue A
El Campo, TX 77437
|
1,248 sq. feet
|
- baths - beds |
show details | |

|
Check over 1 million property listings on Foreclosure.com!
|
browse all offers | |||

Latest news about housing in Wharton, TX collected exclusively by city-data.com from local newspapers, TV, and radio stations

 | Best Inner Loop Apartments with Good Schools (19 replies) |
| Million Dollar Question - Buy or Wait? 2022 Edition (620 replies) |
| Texas reaches new population milestone 30 million! (54 replies) |
| Here's who's on the ballot in the 2024 Texas elections. (21 replies) |
| Feels like I'm being priced out - where can I buy in DFW? Single 30M, work remotely make 200K (74 replies) |
| Private School Thoughts (63 replies) |
Median year apartment built: 1980
Household type by relationship:
Households: 8,902- Male householders: 1,652 (757 living alone), Female householders: 1,906 (708 living alone)
1,052 spouses (1,052 opposite-sex spouses), 30 unmarried partners, (30 opposite-sex unmarried partners), 2,491 children (2,414 natural, 77 adopted, 0 stepchildren), 583 grandchildren, 250 brothers or sisters, 162 parents, 0 foster children, 169 other relatives, 226 non-relatives
- In group quarters: 375
Size of family households: 741 2-persons, 472 3-persons, 332 4-persons, 237 5-persons, 104 6-persons, 49 7-or-more-persons.
Size of nonfamily households: 1,545 1-person, 200 2-persons.
946 married couples with children.
501 single-parent households (224 men, 277 women).
75.2% of residents of Wharton speak English at home.
23.9% of residents speak Spanish at home (69% speak English very well, 13% speak English well, 7% speak English not well, 11% don't speak English at all).
0.7% of residents speak other Indo-European language at home (81% speak English very well, 10% speak English well, 9% speak English not well).
0.4% of residents speak Asian or Pacific Island language at home (46% speak English very well, 54% speak English well).
Foreign born population: 916 (10.3%)
(23.9% of them are naturalized citizens)
| Here: | 5.7 |
| State: | 6.3 |
| Here: | 3.3 |
| State: | 4.0 |
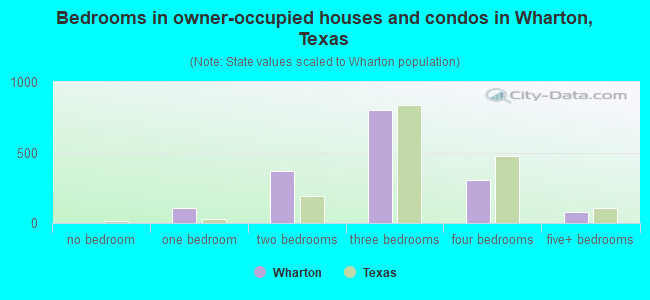
- Bedrooms in owner-occupied houses and condos in Wharton, Texas
- 0no bedroom
- 1071 bedroom
- 3702 bedrooms
- 8003 bedrooms
- 3034 bedrooms
- 765+ bedrooms
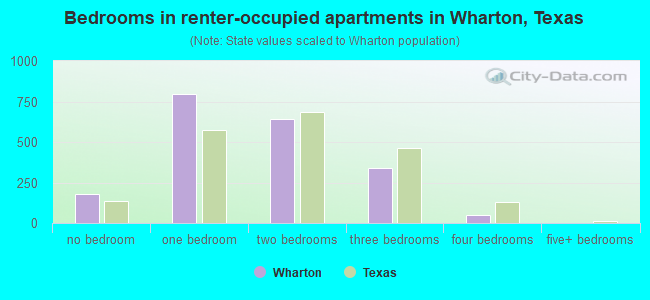
- Bedrooms in renter-occupied apartments in Wharton, Texas
- 179no bedroom
- 7981 bedroom
- 6452 bedrooms
- 3393 bedrooms
- 474 bedrooms
- 05+ bedrooms
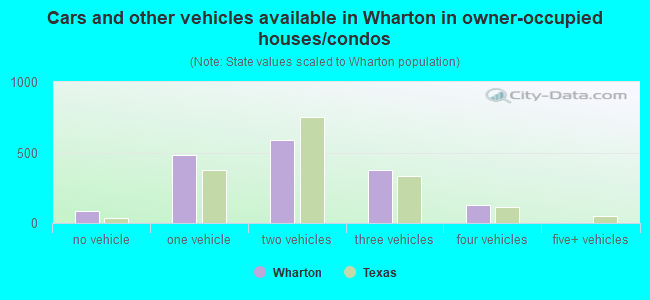
- Cars and other vehicles available in Wharton in owner-occupied houses/condos
- 86no vehicle
- 4791 vehicle
- 5882 vehicles
- 3783 vehicles
- 1264 vehicles
- 05+ vehicles
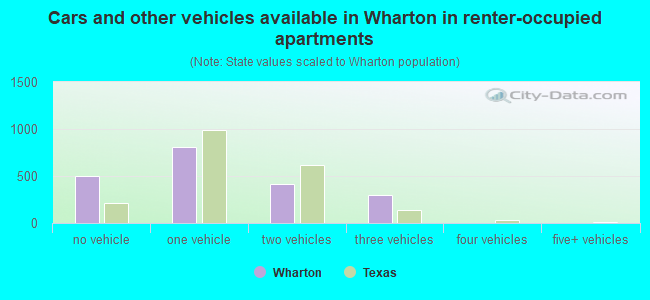
- Cars and other vehicles available in Wharton in renter-occupied apartments
- 495no vehicle
- 8071 vehicle
- 4112 vehicles
- 2943 vehicles
- 04 vehicles
- 05+ vehicles
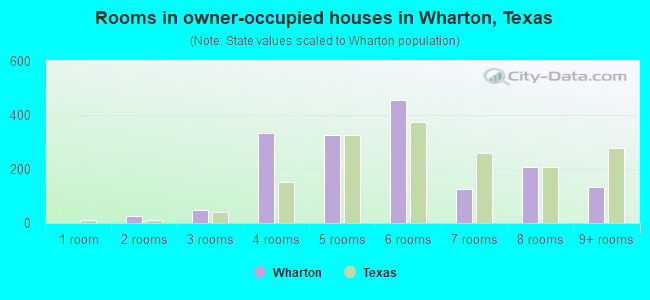
- Rooms in owner-occupied houses in Wharton, Texas
- 01 room
- 272 rooms
- 503 rooms
- 3324 rooms
- 3275 rooms
- 4546 rooms
- 1277 rooms
- 2068 rooms
- 1339+ rooms
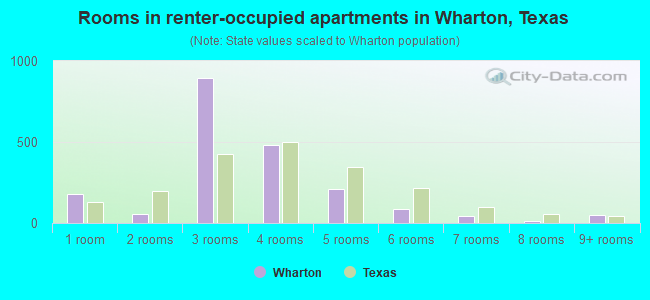
- Rooms in renter-occupied apartments in Wharton, Texas
- 1791 room
- 562 rooms
- 8943 rooms
- 4804 rooms
- 2075 rooms
- 856 rooms
- 457 rooms
- 108 rooms
- 529+ rooms
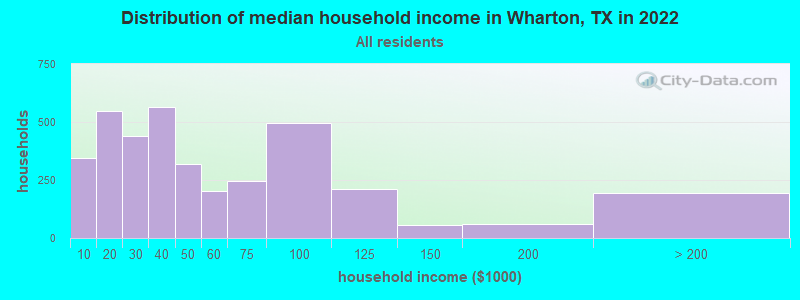
Wharton, TX household income distribution

- 343Less than $10,000
- 548$10,000 to $19,999
- 439$20,000 to $29,999
- 564$30,000 to $39,999
- 321$40,000 to $49,999
- 202$50,000 to $59,999
- 246$60,000 to $74,999
- 494$75,000 to $99,999
- 210$100,000 to $124,999
- 58$125,000 to $149,999
- 59$150,000 to $199,999
- 194$200,000 or more
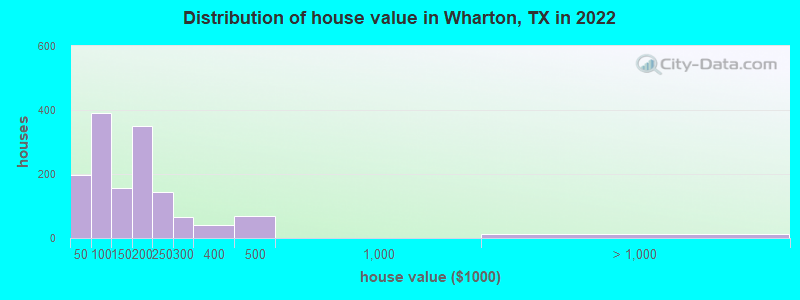
Home value of owner - occupied houses in 2022 in Wharton, TX
-
- 16Less than $10,000
- 8$10,000 to $14,999
- 0$20,000 to $24,999
- 122$25,000 to $29,999
- 6$30,000 to $34,999
- 40$40,000 to $49,999
- 61$50,000 to $59,999
- 78$60,000 to $69,999
- 20$70,000 to $79,999
- 39$80,000 to $89,999
- 148$90,000 to $99,999
- 85$100,000 to $124,999
- 69$125,000 to $149,999
- 208$150,000 to $174,999
- 142$175,000 to $199,999
- 143$200,000 to $249,999
- 66$250,000 to $299,999
- 40$300,000 to $399,999
- 69$400,000 to $499,999
- 11$2,000,000 or more
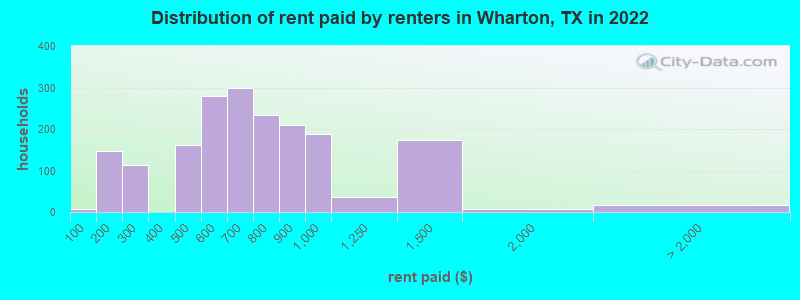
Rent paid by renters in 2022 in Wharton, TX
-
- 7Less than $100
- 147$150 to $199
- 48$200 to $249
- 64$250 to $299
- 19$400 to $449
- 141$450 to $499
- 194$500 to $549
- 85$550 to $599
- 161$600 to $649
- 137$650 to $699
- 136$700 to $749
- 97$750 to $799
- 209$800 to $899
- 188$900 to $999
- 35$1,000 to $1,249
- 172$1,250 to $1,499
- 8$1,500 to $1,999
- 16No cash rent
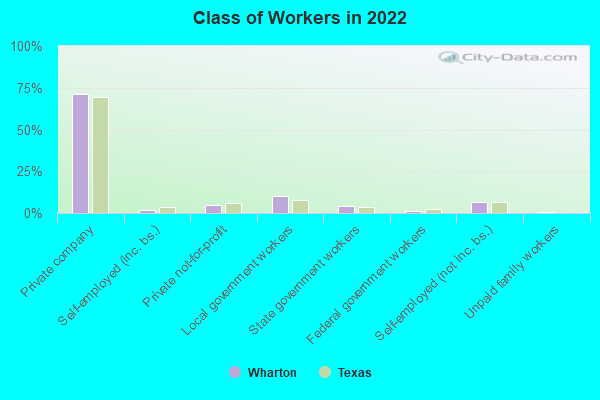
Percentage of workers working in this county: 72.0%
Number of people working at home: 176 (4.4% of all workers)
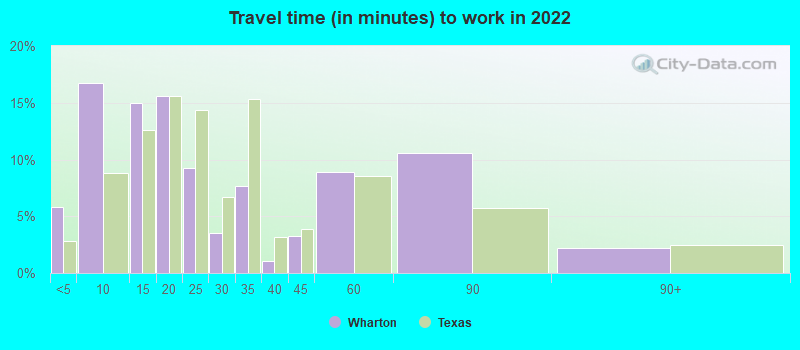
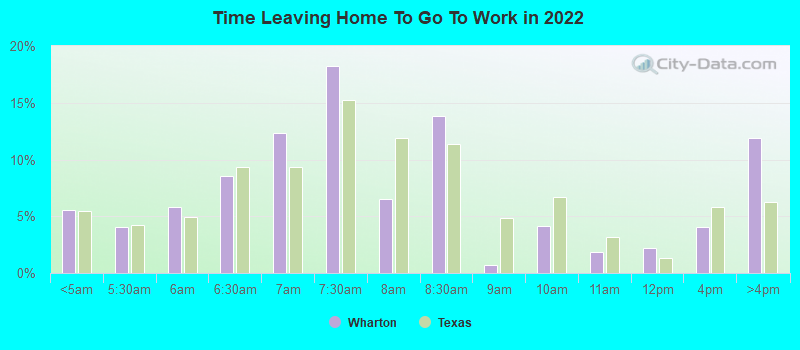
Travel time to work (commute)
- Less than 5 minutes: 292
- 5 to 9 minutes: 772
- 10 to 14 minutes: 685
- 15 to 19 minutes: 341
- 20 to 24 minutes: 488
- 25 to 29 minutes: 68
- 30 to 34 minutes: 194
- 35 to 39 minutes: 126
- 40 to 44 minutes: 129
- 45 to 59 minutes: 222
- 60 to 89 minutes: 269
- 90 or more minutes: 88
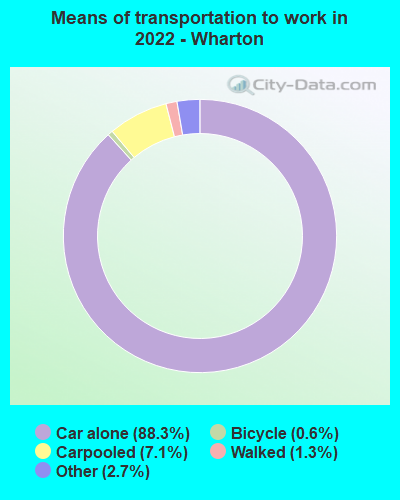
Means of transportation to work:
- Drove a car alone: 4,957 (81.9%)
- Carpooled: 431 (7.1%)
- Bus: 1 (0.0%)
- Taxi: 185 (3.1%)
- Bicycle: 34 (0.6%)
- Walked: 76 (1.3%)
- Worked at home: 176 (2.9%)
- Unemployment by race in 2022
- Unemployment rate for White non-Hispanic residents
- 6.7%Females
- Unemployment rate for Black residents
- 6.0%Males
- 13.3%Females
- Unemployment rate for Asian residents
- 70.7%Females
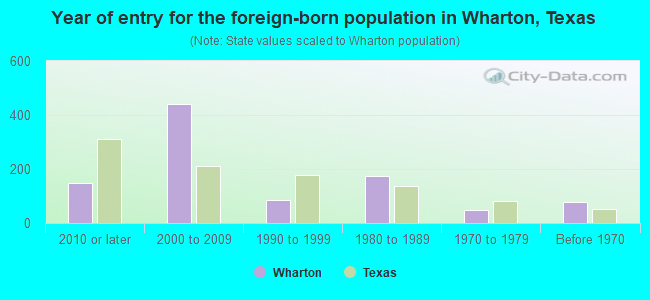
- Year of entry for the foreign-born population in Wharton, Texas
- 1482010 or later
- 4412000 to 2009
- 861990 to 1999
- 1731980 to 1989
- 481970 to 1979
- 76Before 1970
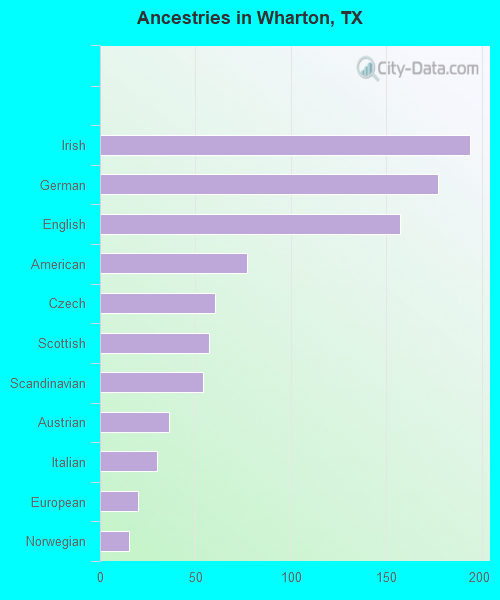
First ancestries reported:
- Irish: 194 (3.7%)
- German: 177 (3.4%)
- English: 157 (3.0%)
- American: 77 (1.5%)
- Czech: 60 (1.2%)
- Scottish: 57 (1.1%)
- Scandinavian: 54 (1.0%)
- Austrian: 36 (0.7%)
- Italian: 30 (0.6%)
- European: 20 (0.4%)
- Norwegian: 15 (0.3%)
Most common places of birth for foreign-born residents (%):
| Wharton: | 84.2% (771) |
| Texas: | 48.4% (2,411,723) |
| Wharton: | 2.6% (24) |
| Texas: | 4.5% (224,455) |
| Wharton: | 2.4% (22) |
| Texas: | 0.2% (9,236) |
| Wharton: | 2.1% (19) |
| Texas: | 1.2% (60,172) |
Place of birth for U.S.-born residents:
- This state: 6,943
- Other state: 880
- Northeast: 83
- Midwest: 223
- South: 257
- West: 320
85.9% of Wharton residents lived in the same house 1 years ago.
Out of people who lived in different houses, 27.6% lived in this county.
Out of people who lived in different counties, 99.9% lived in Texas.
| Wharton: | 85.9% |
| State average: | 85.7% |
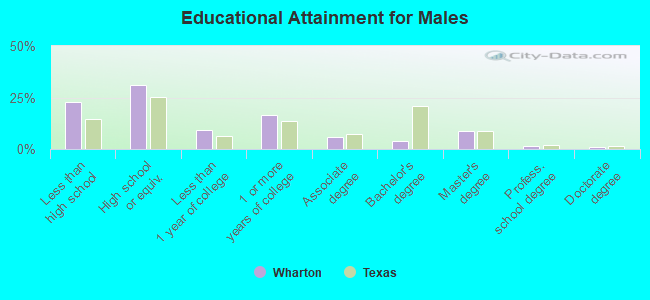
Education attainment for males 25 years and older:
- No schooling: 144
- Nursery to 4th grade: 0
- 5th and 6th grade: 37
- 7th and 8th grade: 62
- 9th grade: 135
- 10th grade: 35
- 11th grade: 90
- 12th grade, no diploma: 105
- High school graduate (or equivalency): 825
- Less than 1 year of college: 242
- Some college more than 1 year, no degree: 440
- Associate degree: 153
- Bachelor's degree: 105
- Master's degree: 231
- Professional school degree: 35
- Doctorate degree: 20
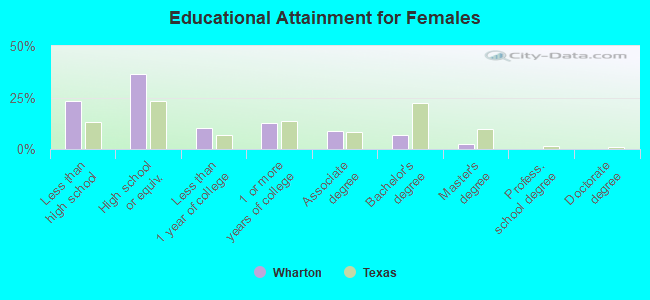
Education attainment for females 25 years and older:
- No schooling: 59
- Nursery to 4th grade: 3
- 5th and 6th grade: 24
- 7th and 8th grade: 76
- 9th grade: 141
- 10th grade: 123
- 11th grade: 54
- 12th grade, no diploma: 254
- High school graduate (or equivalency): 1,140
- Less than 1 year of college: 314
- Some college more than 1 year, no degree: 389
- Associate degree: 266
- Bachelor's degree: 216
- Master's degree: 70
- Professional school degree: 0
- Doctorate degree: 0
Housing units in structures:
- One, detached: 2,390
- One, attached: 117
- Two: 238
- 3 or 4: 213
- 5 to 9: 443
- 10 to 19: 217
- 20 to 49: 128
- 50 or more: 343
- Mobile homes: 170
- Boats, RVs, vans, etc.: 8
Housing units lacking complete kitchen facilities in 2022: 9.9%
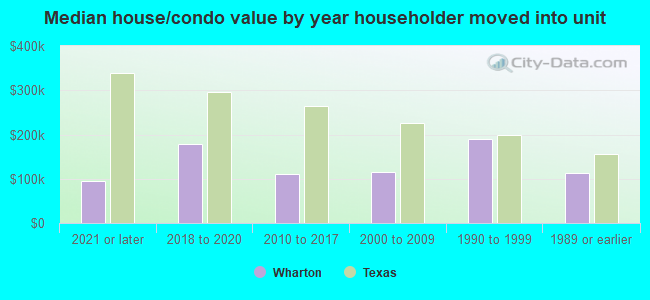
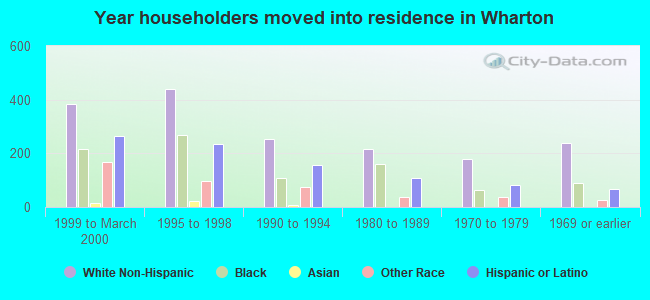
House/condo owner moved in on average 15 years ago
Renter moved in on average 5 years ago
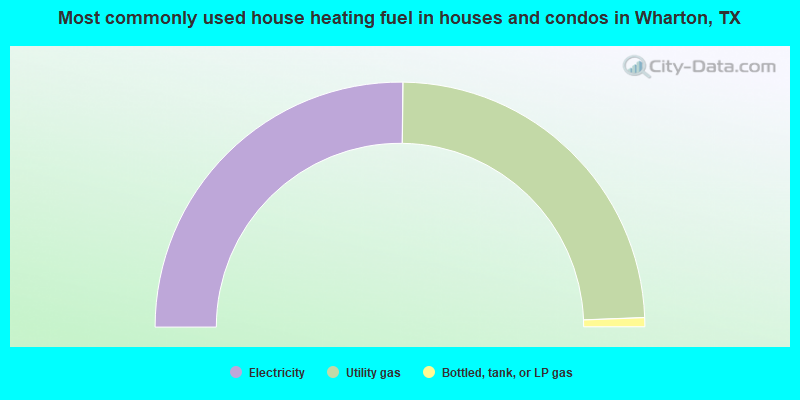
- 50.4%Electricity
- 48.4%Utility gas
- 1.2%Bottled, tank, or LP gas
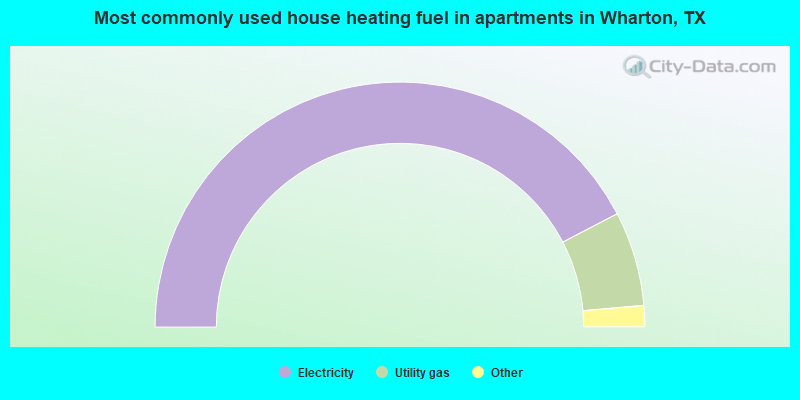
- 84.8%Electricity
- 12.5%Utility gas
- 1.6%Bottled, tank, or LP gas
- 1.1%No fuel used
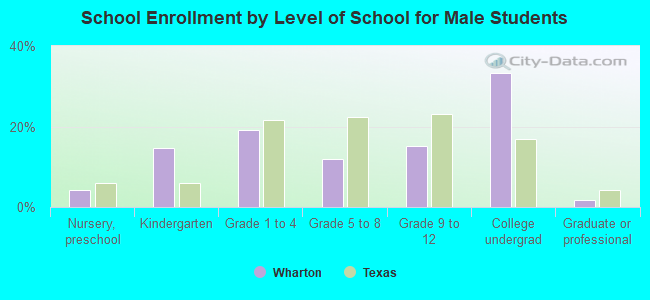
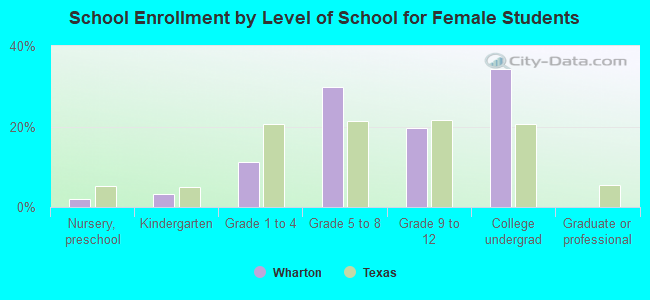
Private vs. public school enrollment:
| Here: | 9.0% |
| Texas: | 8.8% |
| Here: | 17.6% |
| Texas: | 8.0% |
| Here: | 5.2% |
| Texas: | 16.2% |