White Salmon, WA (Washington) Houses and Residents
| White Salmon: | $550,613 |
| Washington: | $569,500 |
Total population: 2,314 (Urban population: 2,142 (all inside urban clusters), Rural population: 11 (all nonfarm))
Houses: 1,323 (1,176 occupied: 819 owner occupied, 360 renter occupied)
| % of renters here: | 31% |
| State: | 36% |
Housing density: 1,061 houses/condos per square mile
Median price asked for vacant for-sale houses and condos in 2022 in this county: $473,227.
Median contract rent in 2022: $1,107 (lower quartile is $709, upper quartile is $1,455)
Median rent asked for vacant for-rent units in 2022: $7,754
Median gross rent in White Salmon, WA in 2022: $1,146
Housing units in White Salmon with a mortgage: 406 (10 second mortgage, 0 home equity loan, 10 both second mortgage and home equity loan)
Houses without a mortgage: 0
Median household income for houses/condos with a mortgage: $107,439
Median household income for apartments without a mortgage: $71,525
Median monthly housing costs: $1,097
Compare current foreclosures near White Salmon, WA:
| Photo | Address | Area | Beds / Baths | Price | Details |
|---|---|---|---|---|---|

|
#1
SW Brislawn Loop Rd
White Salmon, WA 98672
|
- sq. feet
|
- baths - beds |
show details | |

|
#2
W 4th St
The Dalles, OR 97058
|
2,949 sq. feet
|
4 baths 5 beds |
show details | |

|
#3
Alpine Ln
Carson, WA 98610
|
1,592 sq. feet
|
2 baths 4 beds |
show details | |

|
#4
5th Ave
Dallesport, WA 98617
|
- sq. feet
|
2 baths 3 beds |
show details | |

|
#5
Dee Hwy
Hood River, OR 97031
|
1,448 sq. feet
|
2 baths 2 beds |
show details | |

|
#6
W 9th St
The Dalles, OR 97058
|
1,366 sq. feet
|
1 baths 4 beds |
show details | |

|
#7
W 3rd St
The Dalles, OR 97058
|
1,740 sq. feet
|
2 baths 4 beds |
show details | |

|
#8
W Scenic Dr
The Dalles, OR 97058
|
2,466 sq. feet
|
2 baths 4 beds |
show details | |

|
#9
Mount Hood St
The Dalles, OR 97058
|
957 sq. feet
|
2 baths 3 beds |
show details | |

|
#10
Kelly Henke Rd
Stevenson, WA 98648
|
1,296 sq. feet
|
2 baths 3 beds |
show details |
| Photo | Address | Area | Beds / Baths | Price | Details |
|---|---|---|---|---|---|

|
#11
E 8th St
The Dalles, OR 97058
|
2,176 sq. feet
|
1 baths 3 beds |
show details | |

|
#12
Maxs Pl
Hood River, OR 97031
|
1,868 sq. feet
|
2 baths 3 beds |
show details | |

|
#13
State St
Hood River, OR 97031
|
1,912 sq. feet
|
2 baths 5 beds |
show details | |

|
#14
22nd St
Hood River, OR 97031
|
1,929 sq. feet
|
2 baths 3 beds |
show details | |

|
#15
22nd St
Hood River, OR 97031
|
2,289 sq. feet
|
2 baths 4 beds |
show details | |

|
#16
Foster Ct
Hood River, OR 97031
|
1,819 sq. feet
|
2 baths 3 beds |
show details | |

|
#17
3rd Ave Unit 68
Mosier, OR 97040
|
- sq. feet
|
2 baths 2 beds |
show details | |

|
#18
W 2nd St Apt 3
The Dalles, OR 97058
|
- sq. feet
|
1 baths 2 beds |
show details | |

|
#19
Pomona St Apt A
The Dalles, OR 97058
|
- sq. feet
|
- baths - beds |
show details | |

|
#20
Pomona St Apt B
The Dalles, OR 97058
|
- sq. feet
|
- baths - beds |
show details |
| Photo | Address | Area | Beds / Baths | Price | Details |
|---|---|---|---|---|---|

|
#21
W 7th St Apt 23
The Dalles, OR 97058
|
- sq. feet
|
- baths - beds |
show details | |

|
#22
Red Hill Dr
Mount Hood Parkdale, OR 97041
|
- sq. feet
|
- baths - beds |
show details | |

|
#23
W 10th St Unit 45
The Dalles, OR 97058
|
- sq. feet
|
- baths - beds |
show details | |

|
#24
Cascade Ave Apt 103
Hood River, OR 97031
|
- sq. feet
|
- baths - beds |
show details | |

|
#25
W 12th St
The Dalles, OR 97058
|
- sq. feet
|
- baths - beds |
show details | |

|
#26
12th St # 272
Hood River, OR 97031
|
- sq. feet
|
- baths - beds |
show details | |

|
#27
Chenoweth Rd Unit A-31
The Dalles, OR 97058
|
- sq. feet
|
- baths - beds |
show details | |

|
#28
Eugene St Apt 1
Hood River, OR 97031
|
- sq. feet
|
- baths - beds |
show details | |

|
#29
Frankton Rd
Hood River, OR 97031
|
- sq. feet
|
- baths - beds |
show details | |

|
#30
N Elm St
Bingen, WA 98605
|
- sq. feet
|
- baths - beds |
show details |
| Photo | Address | Area | Beds / Baths | Price | Details |
|---|---|---|---|---|---|

|
Check over 1 million property listings on Foreclosure.com!
|
browse all offers | |||
| Photo | Address | Area | Beds / Baths | Price | Details |
|---|


 | Welcome to the Vancouver Forum -- Photos Only (254 replies) |
| Washington Weather - Daily Weather pics and reports! (2567 replies) |
| 'Prop 13 like' proposed change to WA property tax structure (86 replies) |
| Is Washougal really "up and coming"? (51 replies) |
| Sewage Plant on the Island Next to Camas? (28 replies) |
| Feeling the Market (94 replies) |

Median year apartment built: 1979
Household type by relationship:
Households: 2,536- Male householders: 687 (303 living alone), Female householders: 468 (159 living alone)
477 spouses (468 opposite-sex spouses), 67 unmarried partners, (67 opposite-sex unmarried partners), 580 children (557 natural, 0 adopted, 22 stepchildren), 0 grandchildren, 18 brothers or sisters, 99 parents, 0 foster children, 16 other relatives, 113 non-relatives
- In group quarters: 7
Size of family households: 336 2-persons, 117 3-persons, 89 4-persons, 41 5-persons, 47 6-persons.
Size of nonfamily households: 489 1-person, 65 2-persons.
345 married couples with children.
37 single-parent households (0 men, 37 women).
77.6% of residents of White Salmon speak English at home.
21.7% of residents speak Spanish at home (49% speak English very well, 13% speak English well, 22% speak English not well, 16% don't speak English at all).
1.0% of residents speak other Indo-European language at home (100% speak English very well).
Foreign born population: 412 (16.2%)
(45.1% of them are naturalized citizens)
| Here: | 6.1 |
| State: | 6.5 |
| Here: | 3.2 |
| State: | 3.9 |

- Bedrooms in owner-occupied houses and condos in White Salmon, Washington
- 0no bedroom
- 191 bedroom
- 1102 bedrooms
- 5643 bedrooms
- 1274 bedrooms
- 05+ bedrooms

- Bedrooms in renter-occupied apartments in White Salmon, Washington
- 14no bedroom
- 1591 bedroom
- 1232 bedrooms
- 543 bedrooms
- 104 bedrooms
- 05+ bedrooms

- Cars and other vehicles available in White Salmon in owner-occupied houses/condos
- 0no vehicle
- 2171 vehicle
- 3762 vehicles
- 1893 vehicles
- 374 vehicles
- 05+ vehicles

- Cars and other vehicles available in White Salmon in renter-occupied apartments
- 34no vehicle
- 1961 vehicle
- 612 vehicles
- 693 vehicles
- 04 vehicles
- 05+ vehicles

- Rooms in owner-occupied houses in White Salmon, Washington
- 01 room
- 02 rooms
- 63 rooms
- 1284 rooms
- 1185 rooms
- 2666 rooms
- 1437 rooms
- 838 rooms
- 779+ rooms

- Rooms in renter-occupied apartments in White Salmon, Washington
- 141 room
- 332 rooms
- 1603 rooms
- 554 rooms
- 385 rooms
- 196 rooms
- 317 rooms
- 08 rooms
- 109+ rooms


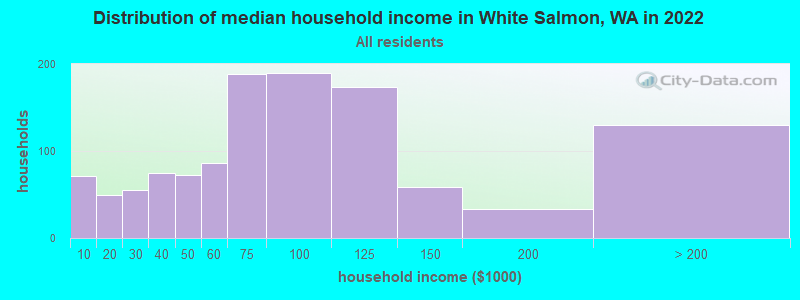
White Salmon, WA household income distribution

- 71Less than $10,000
- 50$10,000 to $19,999
- 55$20,000 to $29,999
- 75$30,000 to $39,999
- 72$40,000 to $49,999
- 86$50,000 to $59,999
- 188$60,000 to $74,999
- 190$75,000 to $99,999
- 174$100,000 to $124,999
- 59$125,000 to $149,999
- 33$150,000 to $199,999
- 130$200,000 or more
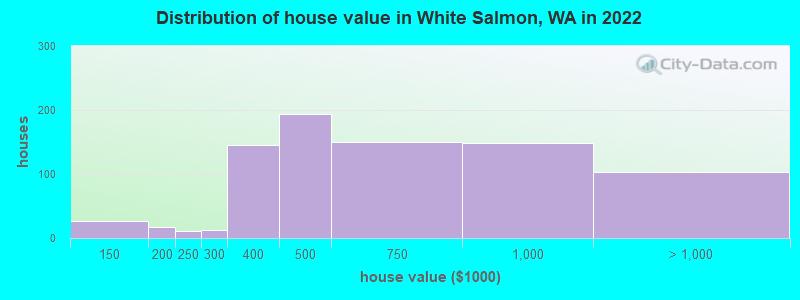
Home value of owner - occupied houses in 2022 in White Salmon, WA
-
- 27$100,000 to $124,999
- 17$150,000 to $174,999
- 11$200,000 to $249,999
- 12$250,000 to $299,999
- 145$300,000 to $399,999
- 193$400,000 to $499,999
- 150$500,000 to $749,999
- 147$750,000 to $999,999
- 87$1,000,000 to $1,499,999
- 8$1,500,000 to $1,999,999
- 6$2,000,000 or more
Rent paid by renters in 2022 in White Salmon, WA
-
- 18$250 to $299
- 28$350 to $399
- 8$450 to $499
- 23$650 to $699
- 13$750 to $799
- 33$800 to $899
- 63$1,000 to $1,249
- 45$1,250 to $1,499
- 76$1,500 to $1,999
- 29No cash rent


Percentage of workers working in this county: 78.6%
Number of people working at home: 329 (26.1% of all workers)
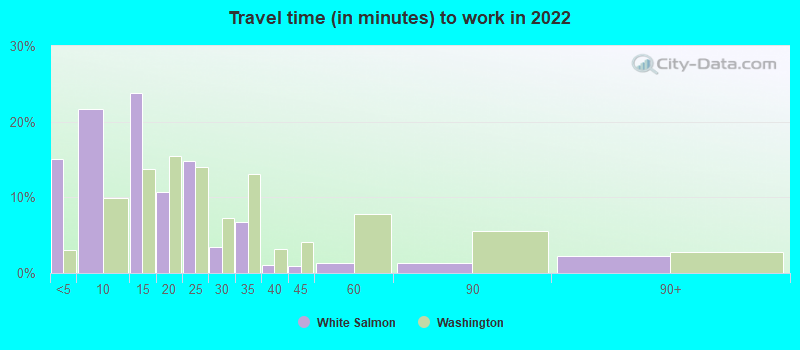
Travel time to work (commute)
- Less than 5 minutes: 139
- 5 to 9 minutes: 220
- 10 to 14 minutes: 277
- 15 to 19 minutes: 67
- 20 to 24 minutes: 56
- 25 to 29 minutes: 68
- 30 to 34 minutes: 72
- 35 to 39 minutes: 37
- 40 to 44 minutes: 0
- 45 to 59 minutes: 0
- 60 to 89 minutes: 4
- 90 or more minutes: 41
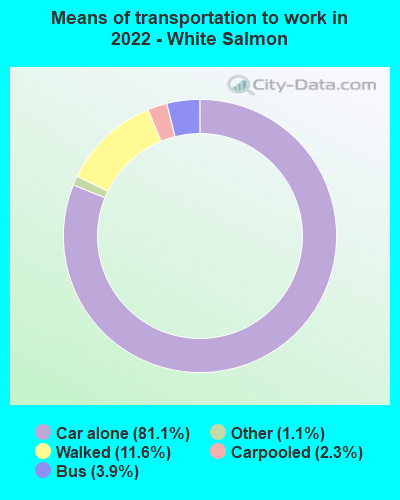
Means of transportation to work:
- Drove a car alone: 1,078 (65.5%)
- Carpooled: 31 (1.9%)
- Bus: 34 (2.1%)
- Taxi: 14 (0.9%)
- Walked: 157 (9.5%)
- Worked at home: 329 (20.0%)

- Unemployment by race in 2022
- Unemployment rate for White non-Hispanic residents
- 2.3%Males

- Year of entry for the foreign-born population in White Salmon, Washington
- 102010 or later
- 282000 to 2009
- 1491990 to 1999
- 811980 to 1989
- 221970 to 1979
- 18Before 1970

First ancestries reported:
- English: 238 (15.9%)
- Irish: 200 (13.4%)
- German: 172 (11.5%)
- American: 115 (7.7%)
- Northern European: 51 (3.4%)
- Scottish: 43 (2.9%)
- French: 24 (1.6%)
- Norwegian: 20 (1.3%)
- European: 18 (1.2%)
- Eastern European: 13 (0.9%)
Most common places of birth for foreign-born residents (%):
| White Salmon: | 77.4% (319) |
| Washington: | 21.1% (241,655) |
| White Salmon: | 5.8% (24) |
| Washington: | 0.3% (3,373) |
| White Salmon: | 5.6% (23) |
| Washington: | 1.6% (17,761) |
| White Salmon: | 4.4% (18) |
| Washington: | 0.2% (2,284) |
| White Salmon: | 3.2% (13) |
| Washington: | 4.1% (47,238) |
| White Salmon: | 2.4% (10) |
| Washington: | 1.0% (10,943) |
Place of birth for U.S.-born residents:
- This state: 520
- Other state: 1,513
- Northeast: 138
- Midwest: 403
- South: 234
- West: 736
91.6% of White Salmon residents lived in the same house 1 years ago.
Out of people who lived in different houses, 29.1% lived in this county.
Out of people who lived in different counties, 2.4% lived in Washington.
| White Salmon: | 91.6% |
| State average: | 85.2% |
Education attainment for males 25 years and older:
- No schooling: 48
- Nursery to 4th grade: 15
- 5th and 6th grade: 23
- 7th and 8th grade: 51
- 9th grade: 0
- 10th grade: 0
- 11th grade: 23
- 12th grade, no diploma: 0
- High school graduate (or equivalency): 212
- Less than 1 year of college: 0
- Some college more than 1 year, no degree: 154
- Associate degree: 39
- Bachelor's degree: 296
- Master's degree: 97
- Professional school degree: 5
- Doctorate degree: 86

Education attainment for females 25 years and older:
- No schooling: 46
- Nursery to 4th grade: 5
- 5th and 6th grade: 22
- 7th and 8th grade: 11
- 9th grade: 24
- 10th grade: 0
- 11th grade: 0
- 12th grade, no diploma: 0
- High school graduate (or equivalency): 134
- Less than 1 year of college: 101
- Some college more than 1 year, no degree: 48
- Associate degree: 95
- Bachelor's degree: 174
- Master's degree: 191
- Professional school degree: 6
- Doctorate degree: 19


Housing units in structures:
- One, detached: 909
- One, attached: 33
- Two: 46
- 3 or 4: 88
- 5 to 9: 51
- 10 to 19: 12
- 50 or more: 33
- Mobile homes: 147
House/condo owner moved in on average 16 years ago
Renter moved in on average 4 years ago

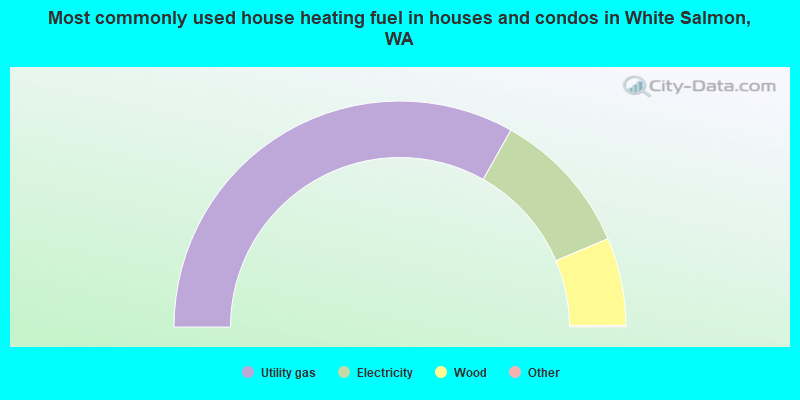
- 66.5%Utility gas
- 20.9%Electricity
- 12.6%Wood
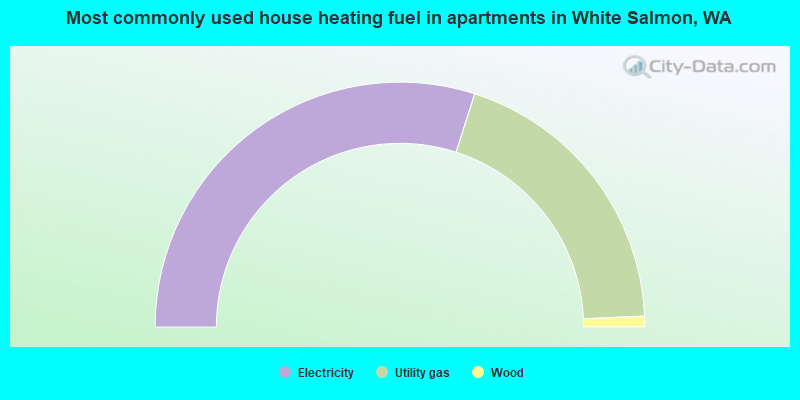
- 59.9%Electricity
- 38.7%Utility gas
- 1.4%Wood
Private vs. public school enrollment:
| Here: | 0.0% |
| Washington: | 12.4% |
| Here: | 0.0% |
| Washington: | 9.2% |
| Here: | 0.0% |
| Washington: | 16.5% |


