Whiteriver, AZ (Arizona) Houses and Residents
| Whiteriver: | $77,531 |
| Arizona: | $402,800 |
Mean price in 2022:
Detached houses: $100,007
Here: $100,007 State: $521,408 Mobile homes: $11,419
Here: $11,419 State: $141,516
Total population: 4,104 (All urban)
Houses: 1,384 (1,287 occupied: 676 owner occupied, 719 renter occupied)
| % of renters here: | 52% |
| State: | 33% |
Housing density: 78 houses/condos per square mile
Median price asked for vacant for-sale houses and condos in 2022 in this county: $281,812.
Median contract rent in 2022: $365
Median rent asked for vacant for-rent units in 2022: $286
Median gross rent in Whiteriver, AZ in 2022: $676
Housing units in Whiteriver with a mortgage: 23 (0 second mortgage, 0 home equity loan, 0 both second mortgage and home equity loan)
Houses without a mortgage: 0
Median household income for apartments without a mortgage: $23,809
Median monthly housing costs: $329
Compare current foreclosures near your location:
| Photo | Address | Area | Beds / Baths | Price | Details |
|---|---|---|---|---|---|

|
#1
S High St
Columbus, OH 43207
|
1,678 sq. feet
|
2 baths 4 beds |
$27,500
|
show details |

|
#2
Bayberry Cir
Columbus, OH 43207
|
1,564 sq. feet
|
1 baths 3 beds |
$127,500
|
show details |

|
#3
E 21st Ave
Columbus, OH 43211
|
1,061 sq. feet
|
1 baths 3 beds |
$179,900
|
show details |

|
#4
Hildreth Ave
Columbus, OH 43203
|
1,798 sq. feet
|
2 baths 4 beds |
show details | |

|
#5
Upton Rd E
Columbus, OH 43232
|
852 sq. feet
|
1 baths 3 beds |
show details | |

|
#6
Glenmate Ct
Columbus, OH 43223
|
1,050 sq. feet
|
1 baths 3 beds |
show details | |

|
#7
Hiawatha Park Dr
Columbus, OH 43211
|
1,278 sq. feet
|
1 baths 4 beds |
show details | |

|
#8
Fergus Rd
Grove City, OH 43123
|
3,312 sq. feet
|
2 baths 4 beds |
show details | |

|
#9
Cannonade Ct
Columbus, OH 43230
|
2,023 sq. feet
|
2 baths 3 beds |
show details | |

|
#10
Fairfield Ave
Columbus, OH 43203
|
984 sq. feet
|
1 baths 2 beds |
show details |
| Photo | Address | Area | Beds / Baths | Price | Details |
|---|---|---|---|---|---|

|
#11
E Howard Rd
Columbus, OH 43207
|
1,056 sq. feet
|
1 baths 3 beds |
show details | |

|
#12
E Welch Ave
Columbus, OH 43207
|
1,864 sq. feet
|
2 baths 4 beds |
show details | |

|
#13
Chester Rd
Columbus, OH 43221
|
3,300 sq. feet
|
4 baths 5 beds |
show details | |

|
#14
S Champion Ave
Columbus, OH 43207
|
1,157 sq. feet
|
1 baths 2 beds |
show details | |

|
#15
Executive Ct
Westerville, OH 43081
|
1,811 sq. feet
|
2 baths 3 beds |
show details | |

|
#16
Lehner Rd
Columbus, OH 43224
|
1,628 sq. feet
|
2 baths 4 beds |
show details | |

|
#17
Wrexham Ave
Columbus, OH 43223
|
1,235 sq. feet
|
1 baths 3 beds |
show details | |

|
#18
Summertree Ln
Westerville, OH 43081
|
2,496 sq. feet
|
2 baths 3 beds |
show details | |

|
#19
Armada Rd
Columbus, OH 43232
|
1,028 sq. feet
|
1 baths 4 beds |
show details | |

|
#20
Chidley St
Galloway, OH 43119
|
1,502 sq. feet
|
1 baths 3 beds |
show details |
| Photo | Address | Area | Beds / Baths | Price | Details |
|---|---|---|---|---|---|

|
#21
London Groveport Rd
Grove City, OH 43123
|
816 sq. feet
|
1 baths 2 beds |
show details | |

|
#22
N Roys Ave
Columbus, OH 43204
|
648 sq. feet
|
2 baths 3 beds |
show details | |

|
#23
E Lincoln Ave
Columbus, OH 43214
|
874 sq. feet
|
1 baths 3 beds |
show details | |

|
#24
N Roys Ave
Columbus, OH 43204
|
1,248 sq. feet
|
2 baths 3 beds |
show details | |

|
#25
Falls Peak Ln
Delaware, OH 43015
|
1,352 sq. feet
|
2 baths 2 beds |
show details | |

|
#26
Striebel Ct
Columbus, OH 43227
|
925 sq. feet
|
1 baths 3 beds |
show details | |

|
#27
Rosewood Ct
Powell, OH 43065
|
2,801 sq. feet
|
3 baths 4 beds |
show details | |

|
#28
Whittman Ct
Plain City, OH 43064
|
3,186 sq. feet
|
3 baths 4 beds |
show details | |

|
#29
Hamilton Ave
Columbus, OH 43211
|
1,061 sq. feet
|
1 baths 3 beds |
show details | |

|
#30
High Free Pike
West Jefferson, OH 43162
|
1,216 sq. feet
|
2 baths 4 beds |
show details |
| Photo | Address | Area | Beds / Baths | Price | Details |
|---|---|---|---|---|---|

|
#31
Kelton Ave
Columbus, OH 43206
|
1,080 sq. feet
|
1 baths 3 beds |
show details | |

|
#32
Ashgrove Dr
Grove City, OH 43123
|
1,772 sq. feet
|
2 baths 4 beds |
show details | |

|
#33
Roundelay Rd N
Reynoldsburg, OH 43068
|
1,712 sq. feet
|
2 baths 3 beds |
show details | |

|
#34
Grasmere Ave
Columbus, OH 43211
|
720 sq. feet
|
1 baths 2 beds |
show details | |

|
#35
S Richardson Ave
Columbus, OH 43204
|
1,520 sq. feet
|
2 baths 3 beds |
show details | |

|
#36
N 18th St
Columbus, OH 43203
|
1,690 sq. feet
|
1 baths 4 beds |
show details | |

|
#37
Gladys Rd
Columbus, OH 43228
|
832 sq. feet
|
1 baths 3 beds |
show details | |

|
#38
Plainview Dr
Columbus, OH 43204
|
730 sq. feet
|
1 baths 2 beds |
show details | |

|
#39
Lowery Dr
Columbus, OH 43231
|
1,557 sq. feet
|
2 baths 3 beds |
show details | |

|
#40
Gertrude Dr
Columbus, OH 43227
|
1,287 sq. feet
|
1 baths 3 beds |
show details |
| Photo | Address | Area | Beds / Baths | Price | Details |
|---|---|---|---|---|---|

|
#41
Grand Bend Dr
Groveport, OH 43125
|
1,612 sq. feet
|
1 baths 3 beds |
show details | |

|
#42
Justin Rd
Columbus, OH 43227
|
986 sq. feet
|
1 baths 3 beds |
show details | |

|
#43
Crocker Rd
Columbus, OH 43232
|
895 sq. feet
|
1 baths 3 beds |
show details | |

|
#44
Wendler Blvd
Columbus, OH 43230
|
1,040 sq. feet
|
1 baths 3 beds |
show details | |

|
#45
Sapphire Dr
Grove City, OH 43123
|
3,241 sq. feet
|
3 baths 4 beds |
show details | |

|
#46
Dinard Way
Columbus, OH 43221
|
1,647 sq. feet
|
2 baths 3 beds |
show details | |

|
#47
Edgeview Rd
Columbus, OH 43207
|
1,352 sq. feet
|
1 baths 4 beds |
show details | |

|
#48
Torchwood Loop E
Columbus, OH 43229
|
2,116 sq. feet
|
2 baths 4 beds |
show details | |

|
#49
Pegwood Dr
Columbus, OH 43229
|
878 sq. feet
|
1 baths 1 beds |
show details | |

|
Check over 1 million property listings on Foreclosure.com!
|
browse all offers | |||

Latest news about housing in Whiteriver, AZ collected exclusively by city-data.com from local newspapers, TV, and radio stations

 | Year round RV living in Whiteriver AZ? (7 replies) |
| More Snow~Severe WX Alert (13 replies) |
| Roadtrip to Phoenix with fear of heights (15 replies) |
| Need info about San Carlos or Whiteriver, Arizona please (12 replies) |
| Seeking Southeastern/Central AZ History Buff (9 replies) |

Median year apartment built: 1987
Household type by relationship:
Households: 4,345- Male householders: 520 (153 living alone), Female householders: 764 (38 living alone)
535 spouses (535 opposite-sex spouses), 84 unmarried partners, (76 opposite-sex unmarried partners), 1,492 children (1,262 natural, 76 adopted, 153 stepchildren), 502 grandchildren, 104 brothers or sisters, 21 parents, 0 foster children, 168 other relatives, 33 non-relatives
- In group quarters: 118
Size of family households: 278 2-persons, 258 3-persons, 209 4-persons, 225 5-persons, 60 6-persons, 135 7-or-more-persons.
Size of nonfamily households: 209 1-person, 45 2-persons.
640 married couples with children.
174 single-parent households (0 men, 174 women).
42.1% of residents of Whiteriver speak English at home.
0.7% of residents speak Spanish at home (86% speak English very well, 14% speak English not well).
0.7% of residents speak Asian or Pacific Island language at home (100% speak English very well).
54.1% of residents speak other language at home (92% speak English very well, 7% speak English well, 1% speak English not well).
Foreign born population: 17 (0.4%)
(88.2% of them are naturalized citizens)
| Here: | 5.2 |
| State: | 6.0 |
| Here: | 5.0 |
| State: | 4.1 |

- Bedrooms in owner-occupied houses and condos in Whiteriver, Arizona
- 0no bedroom
- 101 bedroom
- 1402 bedrooms
- 3243 bedrooms
- 1944 bedrooms
- 95+ bedrooms

- Bedrooms in renter-occupied apartments in Whiteriver, Arizona
- 0no bedroom
- 611 bedroom
- 2812 bedrooms
- 2753 bedrooms
- 764 bedrooms
- 285+ bedrooms

- Cars and other vehicles available in Whiteriver in owner-occupied houses/condos
- 267no vehicle
- 871 vehicle
- 2012 vehicles
- 883 vehicles
- 234 vehicles
- 115+ vehicles

- Cars and other vehicles available in Whiteriver in renter-occupied apartments
- 155no vehicle
- 3781 vehicle
- 1712 vehicles
- 03 vehicles
- 154 vehicles
- 05+ vehicles

- Rooms in owner-occupied houses in Whiteriver, Arizona
- 01 room
- 02 rooms
- 193 rooms
- 1334 rooms
- 2255 rooms
- 1596 rooms
- 1177 rooms
- 158 rooms
- 99+ rooms

- Rooms in renter-occupied apartments in Whiteriver, Arizona
- 01 room
- 472 rooms
- 623 rooms
- 1814 rooms
- 2405 rooms
- 1256 rooms
- 657 rooms
- 08 rooms
- 09+ rooms


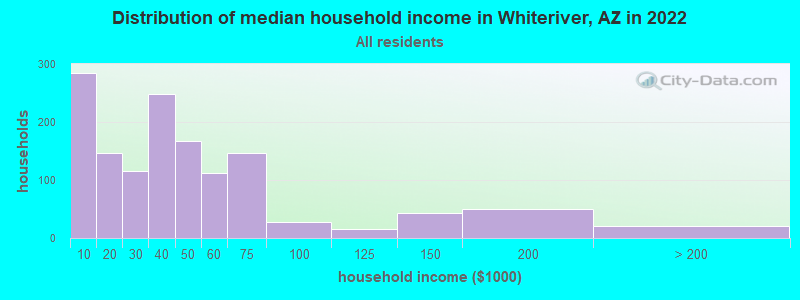
Whiteriver, AZ household income distribution

- 285Less than $10,000
- 146$10,000 to $19,999
- 116$20,000 to $29,999
- 248$30,000 to $39,999
- 167$40,000 to $49,999
- 112$50,000 to $59,999
- 147$60,000 to $74,999
- 28$75,000 to $99,999
- 15$100,000 to $124,999
- 43$125,000 to $149,999
- 50$150,000 to $199,999
- 20$200,000 or more
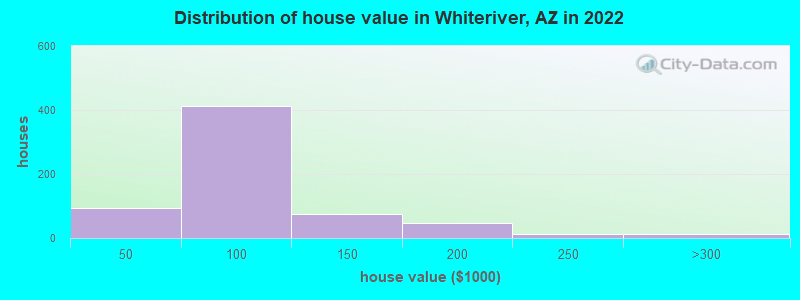
Home value of owner - occupied houses in 2022 in Whiteriver, AZ
-
- 26Less than $10,000
- 12$10,000 to $14,999
- 6$20,000 to $24,999
- 47$40,000 to $49,999
- 223$50,000 to $59,999
- 60$60,000 to $69,999
- 9$70,000 to $79,999
- 55$80,000 to $89,999
- 17$90,000 to $99,999
- 74$100,000 to $124,999
- 48$150,000 to $174,999
- 13$200,000 to $249,999
- 11$250,000 to $299,999
Rent paid by renters in 2022 in Whiteriver, AZ
-
- 239Less than $100
- 14$100 to $149
- 24$150 to $199
- 14$200 to $249
- 47$250 to $299
- 116$300 to $349
- 131$350 to $399
- 49$400 to $449
- 9$450 to $499
- 41$2,000 to $2,499
- 72No cash rent


Percentage of workers working in this county: 94.2%
Number of people working at home: 60 (5.5% of all workers)
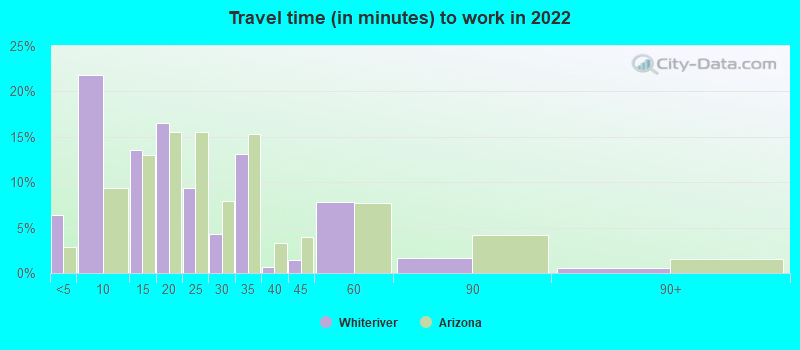
Travel time to work (commute)
- Less than 5 minutes: 45
- 5 to 9 minutes: 347
- 10 to 14 minutes: 117
- 15 to 19 minutes: 119
- 20 to 24 minutes: 32
- 25 to 29 minutes: 90
- 30 to 34 minutes: 96
- 35 to 39 minutes: 27
- 40 to 44 minutes: 0
- 45 to 59 minutes: 110
- 60 to 89 minutes: 105
- 90 or more minutes: 0
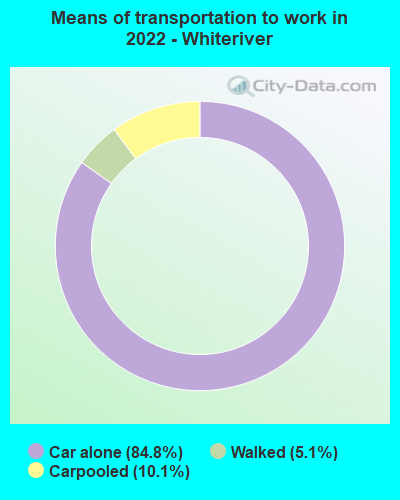
Means of transportation to work:
- Drove a car alone: 1,859 (78.0%)
- Carpooled: 231 (9.7%)
- Walked: 121 (5.1%)
- Worked at home: 60 (2.5%)

- Unemployment by race in 2022
- Unemployment rate for American Indian and Alaska Native residents
- 11.0%Males
- 4.5%Females

- Year of entry for the foreign-born population in Whiteriver, Arizona
- 52010 or later
- 02000 to 2009
- 01990 to 1999
- 01980 to 1989
- 91970 to 1979
- 0Before 1970

First ancestries reported:
- Dutch: 12 (0.3%)
- Irish: 7 (0.2%)
- Canadian: 4 (0.1%)
Most common places of birth for foreign-born residents (%):
| Whiteriver: | 41.2% (7) |
| Arizona: | 0.2% (2,223) |
| Whiteriver: | 17.6% (3) |
| Arizona: | 1.0% (8,899) |
| Whiteriver: | 5.9% (1) |
| Arizona: | 53.4% (500,086) |
Place of birth for U.S.-born residents:
- This state: 3,889
- Other state: 234
- Northeast: 31
- Midwest: 0
- South: 79
- West: 113
89.8% of Whiteriver residents lived in the same house 1 years ago.
Out of people who lived in different houses, 42.7% lived in this county.
Out of people who lived in different counties, 93.7% lived in Arizona.
| Whiteriver: | 89.8% |
| State average: | 86.0% |
Education attainment for males 25 years and older:
- No schooling: 0
- Nursery to 4th grade: 0
- 5th and 6th grade: 0
- 7th and 8th grade: 34
- 9th grade: 55
- 10th grade: 26
- 11th grade: 175
- 12th grade, no diploma: 12
- High school graduate (or equivalency): 482
- Less than 1 year of college: 16
- Some college more than 1 year, no degree: 231
- Associate degree: 24
- Bachelor's degree: 26
- Master's degree: 31
- Professional school degree: 0
- Doctorate degree: 0

Education attainment for females 25 years and older:
- No schooling: 6
- Nursery to 4th grade: 0
- 5th and 6th grade: 0
- 7th and 8th grade: 21
- 9th grade: 30
- 10th grade: 163
- 11th grade: 73
- 12th grade, no diploma: 55
- High school graduate (or equivalency): 418
- Less than 1 year of college: 10
- Some college more than 1 year, no degree: 370
- Associate degree: 70
- Bachelor's degree: 58
- Master's degree: 15
- Professional school degree: 0
- Doctorate degree: 0


Housing units in structures:
- One, detached: 1,179
- Two: 42
- 3 or 4: 38
- 10 to 19: 24
- Mobile homes: 98
Median worth of mobile homes: $11,496
Housing units lacking complete kitchen facilities in 2022: 7.9%
House/condo owner moved in on average 30 years ago
Renter moved in on average 5 years ago

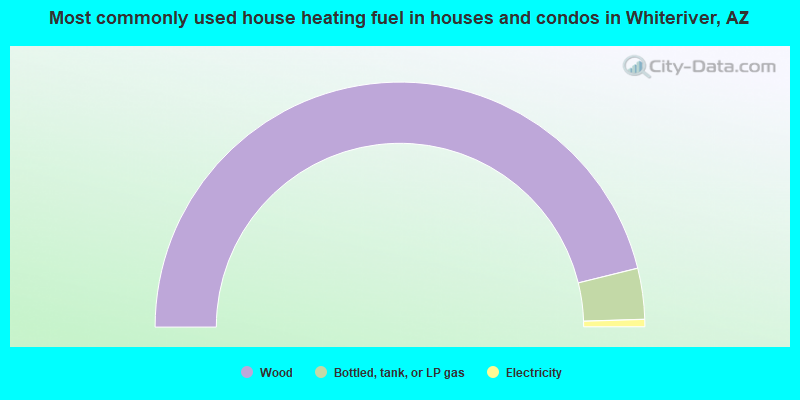
- 92.3%Wood
- 6.7%Bottled, tank, or LP gas
- 1.0%Electricity
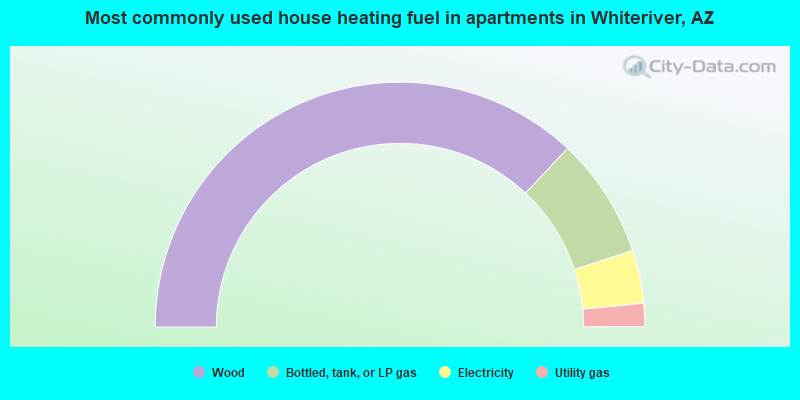
- 74.0%Wood
- 15.9%Bottled, tank, or LP gas
- 7.0%Electricity
- 3.1%Utility gas
Private vs. public school enrollment:
| Here: | 0.7% |
| Arizona: | 10.4% |
| Here: | 1.5% |
| Arizona: | 8.8% |
| Here: | 15.6% |
| Arizona: | 13.1% |


