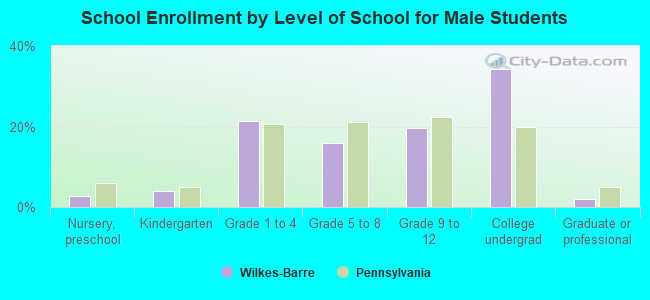
Wilkes-Barre, PA (Pennsylvania) Houses and Residents
Estimated median house or condo value in 2022: $109,283 (it was $65,500 in 2000 )
Wilkes-Barre:
$109,283Pennsylvania:
$245,500
Lower value quartile - upper value quartile: $74,971 - $153,955Mean price in 2022: Detached houses: $119,842 Here:
$119,842State:
$317,202
Townhouses or other attached units: $113,428 Here:
$113,428State:
$254,369
In 2-unit structures: $121,203 Here:
$121,203State:
$249,182
In 3-to-4-unit structures: $229,633 Here:
$229,633State:
$297,446
In 5-or-more-unit structures: $176,970 Here:
$176,970State:
$320,068
Mobile homes: $208,119 Here:
$208,119State:
$92,414
Total population: 40,814 (All urban)
Houses: 19,967 (16,509 occupied: 8,010 owner occupied, 8,729 renter occupied )
% of renters here:
52%State:
31%
Housing density: 2,915 houses/condos per square mile
Median price asked for vacant for-sale houses and condos in 2022: $67,190.
Median contract rent in 2022: $732 (lower quartile is $542, upper quartile is $951)
Median rent asked for vacant for-rent units in 2022: $505
Median gross rent in Wilkes-Barre, PA in 2022: $946
Housing units in Wilkes-Barre with a mortgage: 3,945 (456 second mortgage, 12 home equity loan, 344 both second mortgage and home equity loan )Houses without a mortgage: 137
Median household income for houses/condos with a mortgage: $76,289
Median household income for apartments without a mortgage: $55,039
Median monthly housing costs: $873
Data:
Median house or condo value ($)
Median house or condo value ($ change since 2000)
Median house or condo value ($) - White
Median house or condo value ($) - Black or African American
Median house or condo value ($) - Asian
Median house or condo value ($) - Hispanic or Latino
Median house or condo value ($) - American Indian and Alaska Native
Median house or condo value ($) - Multirace
Median house or condo value ($) - Other Race
Median price asked for mobile homes ($)
Household density (households per square mile)
Mean house or condo value by units in structure - 1, detached ($)
Mean house or condo value by units in structure - 1, attached ($)
Mean house or condo value by units in structure - 2 ($)
Mean house or condo value by units in structure by units in structure - 3 or 4 ($)
Mean house or condo value by units in structure - 5 or more ($)
Mean house or condo value by units in structure - Boat, RV, van, etc. ($)
Mean house or condo value by units in structure - Mobile home ($)
Median contract rent ($)
Median contract rent - Lower quartile ($)
Median contract rent - Upper quartile ($)
Median gross rent ($)
Urban houses (%)
Rural houses (%)
Houses occupied (%)
Houses occupied (% change since 2000)
Houses owner occupied (%)
Houses owner occupied (% change since 2000)
Houses renter occupied (%)
Houses renter occupied (% change since 2000)
Vacant housing units - For rent (%)
Vacant housing units - For rent (% change since 2000)
Vacant housing units - For sale only (%)
Vacant housing units - For sale only (% change since 2000)
Vacant housing units - Rented or sold, not occupied (%)
Vacant housing units - Rented or sold, not occupied (% change since 2000)
Vacant housing units - For seasonal, recreational, or occasional use (%)
Vacant housing units - For seasonal, recreational, or occasional use (% change since 2000)
Vacant housing units - For migrant workers (%)
Vacant housing units - For migrant workers (% change since 2000)
Vacant housing units - Other vacant (%)
Vacant housing units - Other vacant (% change since 2000)
Median monthly housing costs ($)
Median household income for houses/condos with a mortgage ($)
Median household income for houses/condos without a mortgage ($)
Median household income ($)
Median household income ($) - White
Median household income ($) - Black or African American
Median household income ($) - Asian
Median household income ($) - Hispanic or Latino
Median household income ($) - American Indian and Alaska Native
Median household income ($) - Multirace
Median household income ($) - Other Race
Mortgage status - with mortgage (%)
Mortgage status - with second mortgage (%)
Mortgage status - with home equity loan (%)
Mortgage status - with both second mortgage and home equity loan (%)
Mortgage status - without a mortgage (%)
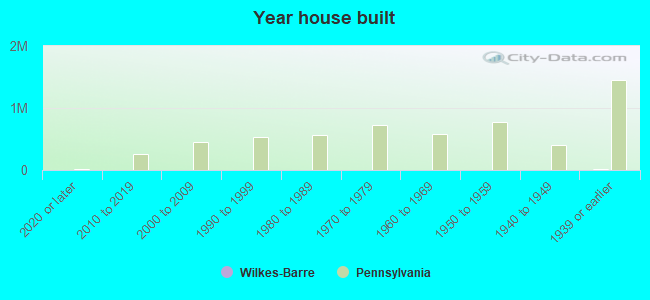
Median year house/condo built
Median year apartment built
Household type by relationship - Male householder living alone (%)
Household type by relationship - Male householder not living alone (%)
Household type by relationship - Female householder living alone (%)
Household type by relationship - Female householder not living alone (%)
Household type by relationship - Opposite-Sex spouse (%)
Household type by relationship - Same-Sex spouse (%)
Household type by relationship - Opposite-Sex unmarried partner (%)
Household type by relationship - Same-Sex unmarried partner (%)
Household type by relationship - In group quarters (%)
Size of family households - 2-person household (%)
Size of family households - 3-person household (%)
Size of family households - 4-person household (%)
Size of family households - 5-person household (%)
Size of family households - 6-person household (%)
Size of family households - 7-or-more-person household (%)
Size of nonfamily households - 1-person household (%)
Size of nonfamily households - 2-person household (%)
Size of nonfamily households - 3-person household (%)
Size of nonfamily households - 4-person household (%)
Size of nonfamily households - 5-person household (%)
Size of nonfamily households - 6-person household (%)
Size of nonfamily households - 7-or-moreperson household (%)
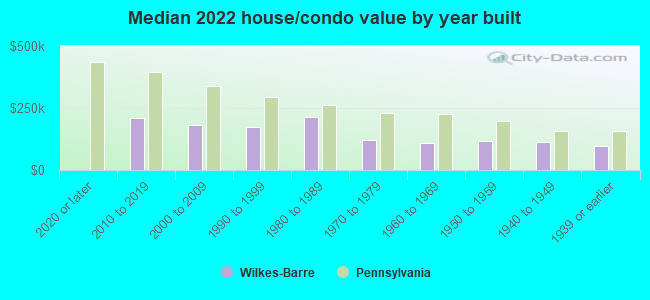
Year house built - Built 2010 or later (%)
Year house built - Built 2000 to 2009 (%)
Year house built - Built 1990 to 1999 (%)
Year house built - Built 1980 to 1989 (%)
Year house built - Built 1970 to 1979 (%)
Year house built - Built 1960 to 1969 (%)
Year house built - Built 1950 to 1959 (%)
Year house built - Built 1940 to 1949 (%)
Year house built - Built 1939 or earlier (%)
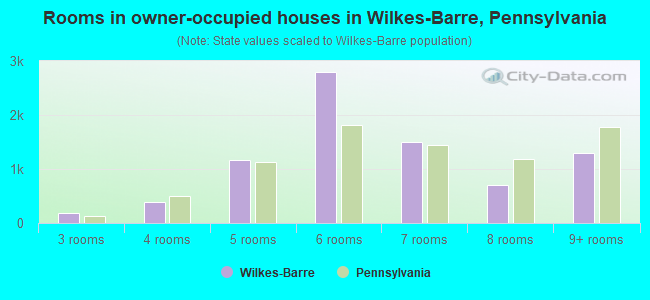
Median number of rooms in houses and condos
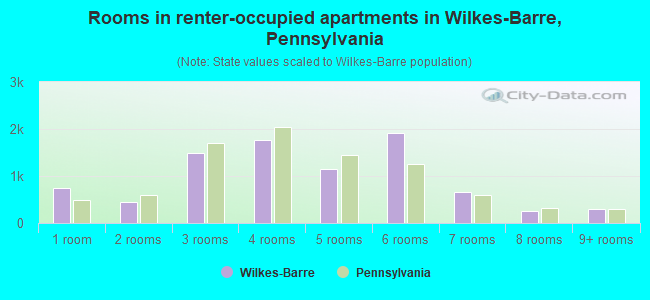
Median number of rooms in apartments
Median number of bedrooms in owner occupied houses
Mean number of bedrooms in owner occupied houses
Median number of bedrooms in renter occupied houses
Mean number of bedrooms in renter occupied houses
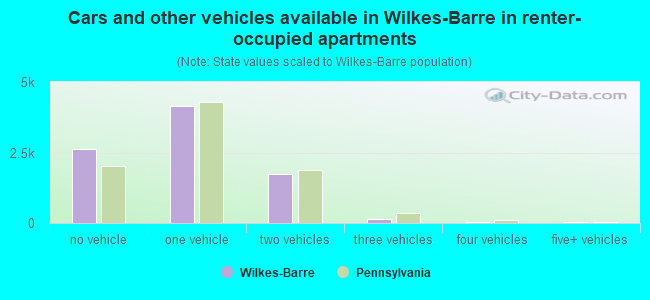
Median number of vehichles in owner occupied houses
Mean number of vehichles in owner occupied houses
Median number of vehichles in renter occupied houses
Mean number of vehichles in renter occupied houses
Rooms in owner-occupied houses - 1 room (%)
Rooms in owner-occupied houses - 2 rooms (%)
Rooms in owner-occupied houses - 3 rooms (%)
Rooms in owner-occupied houses - 4 rooms (%)
Rooms in owner-occupied houses - 5 rooms (%)
Rooms in owner-occupied houses - 6 rooms (%)
Rooms in owner-occupied houses - 7 rooms (%)
Rooms in owner-occupied houses - 8 rooms (%)
Rooms in owner-occupied houses - 9+ rooms (%)
Rooms in renter-occupied houses - 1 room (%)
Rooms in renter-occupied houses - 2 rooms (%)
Rooms in renter-occupied houses - 3 rooms (%)
Rooms in renter-occupied houses - 4 rooms (%)
Rooms in renter-occupied houses - 5 rooms (%)
Rooms in renter-occupied houses - 6 rooms (%)
Rooms in renter-occupied houses - 7 rooms (%)
Rooms in renter-occupied houses - 8 rooms (%)
Rooms in renter-occupied houses - 9+ rooms (%)
Bedrooms in owner-occupied houses - no bedrooms (%)
Bedrooms in owner-occupied houses - 1 bedroom (%)
Bedrooms in owner-occupied houses - 2 bedrooms (%)
Bedrooms in owner-occupied houses - 3 bedrooms (%)
Bedrooms in owner-occupied houses - 4 bedrooms (%)
Bedrooms in owner-occupied houses - 5+ bedrooms (%)
Bedrooms in renter-occupied houses - no bedrooms (%)
Bedrooms in renter-occupied houses - 1 bedroom (%)
Bedrooms in renter-occupied houses - 2 bedrooms (%)
Bedrooms in renter-occupied houses - 3 bedrooms (%)
Bedrooms in renter-occupied houses - 4 bedrooms (%)
Bedrooms in renter-occupied houses - 5+ bedrooms (%)
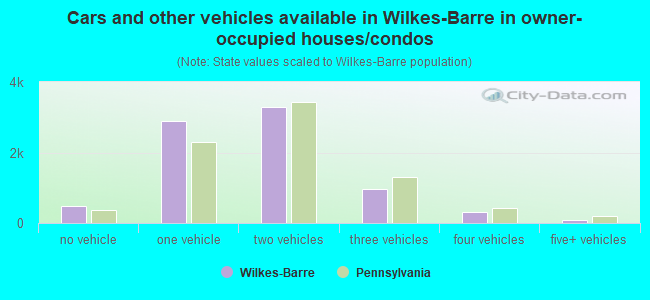
Vehicles available in owner-occupied houses - no vehicle available (%)
Vehicles available in owner-occupied houses - 1 vehicle available(%)
Vehicles available in owner-occupied houses - 2 Vehicles available (%)
Vehicles available in owner-occupied houses - 3 Vehicles available (%)
Vehicles available in owner-occupied houses - 4 Vehicles available (%)
Vehicles available in owner-occupied houses - 5+ Vehicles available (%)
Vehicles available in renter-occupied houses - no vehicle available (%)
Vehicles available in renter-occupied houses - 1 vehicle available (%)
Vehicles available in renter-occupied houses - 2 Vehicles available (%)
Vehicles available in renter-occupied houses - 3 Vehicles available (%)
Vehicles available in renter-occupied houses - 4 Vehicles available (%)
Vehicles available in renter-occupied houses - 5+ Vehicles available (%)
Housing units in structures - 1, detached (%)
Housing units in structures - 1, attached (%)
Housing units in structures - 2 (%)
Housing units in structures - 3 or 4 (%)
Housing units in structures - 5 to 9 (%)
Housing units in structures - 10 to 19 (%)
Housing units in structures - 20 to 49 (%)
Housing units in structures - 50 or more (%)
Housing units in structures - Mobile home (%)
Housing units in structures - Boat, RV, van, etc. (%)
Housing units in structures - Owners - 1, detached (%)
Housing units in structures - Owners - 1, attached (%)
Housing units in structures - Owners - 2 (%)
Housing units in structures - Owners - 3 or 4 (%)
Housing units in structures - Owners - 5 to 9 (%)
Housing units in structures - Owners - 10 to 19 (%)
Housing units in structures - Owners - 20 to 49 (%)
Housing units in structures - Owners - 50 or more (%)
Housing units in structures - Owners - Mobile home (%)
Housing units in structures - Owners - Boat, RV, van, etc. (%)
Housing units in structures - Renters - 1, detached (%)
Housing units in structures - Renters - 1, attached (%)
Housing units in structures - Renters - 2 (%)
Housing units in structures - Renters - 3 or 4 (%)
Housing units in structures - Renters - 5 to 9 (%)
Housing units in structures - Renters - 10 to 19 (%)
Housing units in structures - Renters - 20 to 49 (%)
Housing units in structures - Renters - 50 or more (%)
Housing units in structures - Renters - Mobile home (%)
Housing units in structures - Renters - Boat, RV, van, etc. (%)
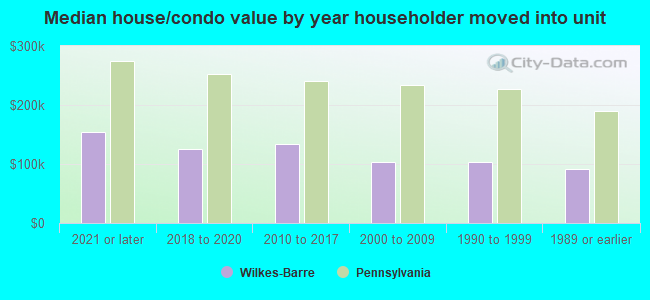
House/condo owner moved in on average (years ago)
Renter moved in on average (years ago)
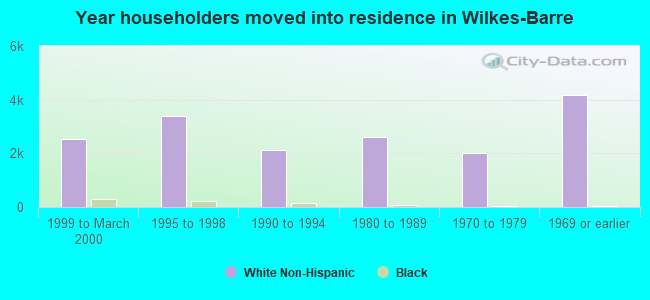
Year householder moved into unit - Moved in 1999 to March 2000 (%)
Year householder moved into unit - Moved in 1999 to March 2000 (%) - White
Year householder moved into unit - Moved in 1999 to March 2000 (%) - Black or African American
Year householder moved into unit - Moved in 1999 to March 2000 (%) - Asian
Year householder moved into unit - Moved in 1999 to March 2000 (%) - Hispanic or Latino
Year householder moved into unit - Moved in 1999 to March 2000 (%) - American Indian and Alaska Native
Year householder moved into unit - Moved in 1999 to March 2000 (%) - Multirace
Year householder moved into unit - Moved in 1999 to March 2000 (%) - Other Race
Year householder moved into unit - Moved in 1995 to 1998 (%)
Year householder moved into unit - Moved in 1995 to 1998 (%) - White
Year householder moved into unit - Moved in 1995 to 1998 (%) - Black or African American
Year householder moved into unit - Moved in 1995 to 1998 (%) - Asian
Year householder moved into unit - Moved in 1995 to 1998 (%) - Hispanic or Latino
Year householder moved into unit - Moved in 1995 to 1998 (%) - American Indian and Alaska Native
Year householder moved into unit - Moved in 1995 to 1998 (%) - Multirace
Year householder moved into unit - Moved in 1995 to 1998 (%) - Other Race
Year householder moved into unit - Moved in 1990 to 1994 (%)
Year householder moved into unit - Moved in 1990 to 1994 (%) - White
Year householder moved into unit - Moved in 1990 to 1994 (%) - Black or African American
Year householder moved into unit - Moved in 1990 to 1994 (%) - Asian
Year householder moved into unit - Moved in 1990 to 1994 (%) - Hispanic or Latino
Year householder moved into unit - Moved in 1990 to 1994 (%) - American Indian and Alaska Native
Year householder moved into unit - Moved in 1990 to 1994 (%) - Multirace
Year householder moved into unit - Moved in 1990 to 1994 (%) - Other Race
Year householder moved into unit - Moved in 1980 to 1989 (%)
Year householder moved into unit - Moved in 1980 to 1989 (%) - White
Year householder moved into unit - Moved in 1980 to 1989 (%) - Black or African American
Year householder moved into unit - Moved in 1980 to 1989 (%) - Asian
Year householder moved into unit - Moved in 1980 to 1989 (%) - Hispanic or Latino
Year householder moved into unit - Moved in 1980 to 1989 (%) - American Indian and Alaska Native
Year householder moved into unit - Moved in 1980 to 1989 (%) - Multirace
Year householder moved into unit - Moved in 1980 to 1989 (%) - Other Race
Year householder moved into unit - Moved in 1970 to 1979 (%)
Year householder moved into unit - Moved in 1970 to 1979 (%) - White
Year householder moved into unit - Moved in 1970 to 1979 (%) - Black or African American
Year householder moved into unit - Moved in 1970 to 1979 (%) - Asian
Year householder moved into unit - Moved in 1970 to 1979 (%) - Hispanic or Latino
Year householder moved into unit - Moved in 1970 to 1979 (%) - American Indian and Alaska Native
Year householder moved into unit - Moved in 1970 to 1979 (%) - Multirace
Year householder moved into unit - Moved in 1970 to 1979 (%) - Other Race
Year householder moved into unit - Moved in 1969 or earlier (%)
Year householder moved into unit - Moved in 1969 or earlier (%) - White
Year householder moved into unit - Moved in 1969 or earlier (%) - Black or African American
Year householder moved into unit - Moved in 1969 or earlier (%) - Asian
Year householder moved into unit - Moved in 1969 or earlier (%) - Hispanic or Latino
Year householder moved into unit - Moved in 1969 or earlier (%) - American Indian and Alaska Native
Year householder moved into unit - Moved in 1969 or earlier (%) - Multirace
Year householder moved into unit - Moved in 1969 or earlier (%) - Other Race
Housing units lacking complete plumbing facilities (%)
Housing units lacking complete kitchen facilities (%)
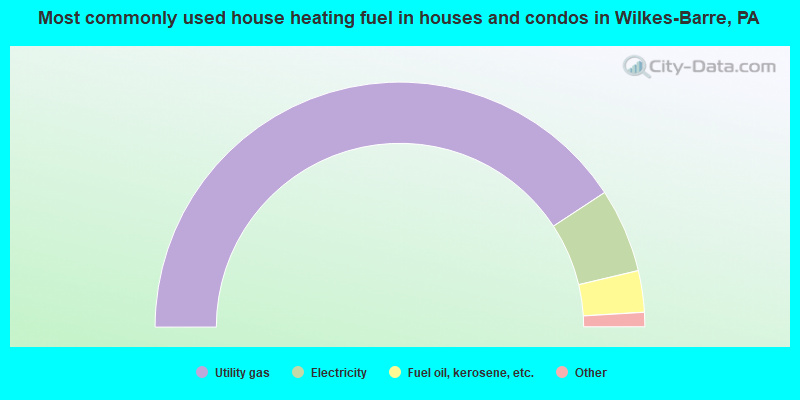
House heating fuel used in houses and condos - Utility gas (%)
House heating fuel used in houses and condos - Bottled, tank, or LP gas (%)
House heating fuel used in houses and condos - Electricity (%)
House heating fuel used in houses and condos - Fuel oil, kerosene, etc. (%)
House heating fuel used in houses and condos - Coal or coke (%)
House heating fuel used in houses and condos - Wood (%)
House heating fuel used in houses and condos - Solar energy (%)
House heating fuel used in houses and condos - Other fuel (%)
House heating fuel used in houses and condos - No fuel used (%)
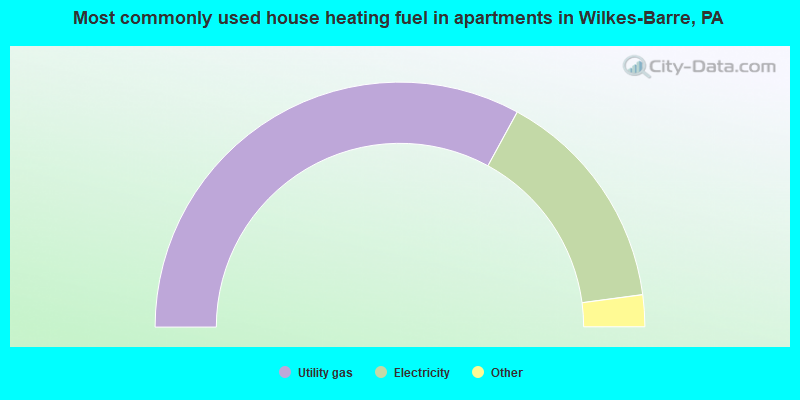
House heating fuel used in apartments - Utility gas (%)
House heating fuel used in apartments - Bottled, tank, or LP gas (%)
House heating fuel used in apartments - Electricity (%)
House heating fuel used in apartments - Fuel oil, kerosene, etc. (%)
House heating fuel used in apartments - Coal or coke (%)
House heating fuel used in apartments - Wood (%)
House heating fuel used in apartments - Solar energy (%)
House heating fuel used in apartments - Other fuel (%)
House heating fuel used in apartments - No fuel used (%)
Latest news about housing in Wilkes-Barre, PA collected exclusively by city-data.com from local newspapers, TV, and radio stations
Median year house/condo built: 1938Median year apartment built: 1964Household type by relationship:
Households: 44,254
Male householders: 7,308 (2,606 living alone ), Female householders: 9,201 (2,945 living alone )5,331 spouses (5,253 opposite-sex spouses ), 1,799 unmarried partners , (1,740 opposite-sex unmarried partners ), 12,561 children (11,885 natural , 77 adopted , 598 stepchildren ), 1,033 grandchildren , 497 brothers or sisters , 602 parents , 145 foster children , 818 other relatives , 1,410 non-relatives In group quarters: 3,544
Size of family households: 4,159 2-persons , 2,362 3-persons , 1,934 4-persons , 841 5-persons , 517 6-persons , 301 7-or-more-persons .
Size of nonfamily households: 5,354 1-person , 1,096 2-persons , 68 3-persons , 66 4-persons , 75 5-persons , 11 6-persons .
3,273 married couples with children. single-parent households (1,029 men , 4,366 women ).
75.2% of residents of Wilkes-Barre speak English at home. of residents speak Spanish at home (46% speak English very well , 22% speak English well , 22% speak English not well , 9% don't speak English at all ).of residents speak other Indo-European language at home (69% speak English very well , 20% speak English well , 10% speak English not well , 1% don't speak English at all ).of residents speak Asian or Pacific Island language at home (68% speak English very well , 21% speak English well , 11% speak English not well ).of residents speak other language at home (91% speak English very well , 9% speak English well ).
Foreign born population: 6,671 (15.1%)of them are naturalized citizens )
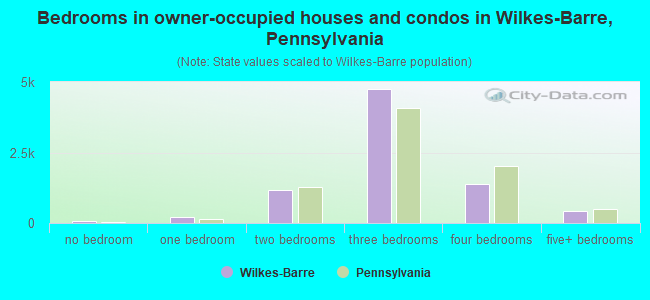
Median number of rooms in houses and condos:
Median number of rooms in apartments
Owner-occupied Renter-occupied
Rooms in owner-occupied houses in Wilkes-Barre, Pennsylvania
0 1 room 0 2 rooms 176 3 rooms 380 4 rooms 1,170 5 rooms 2,790 6 rooms 1,496 7 rooms 708 8 rooms 1,292 9+ rooms
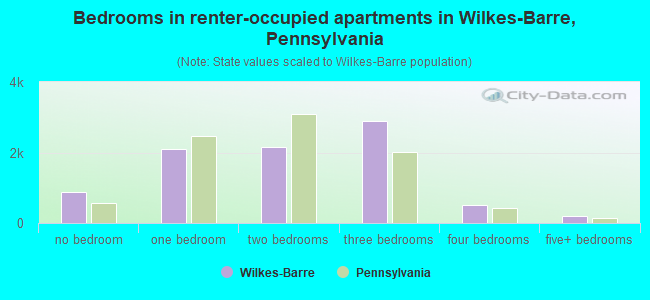
Rooms in renter-occupied apartments in Wilkes-Barre, Pennsylvania
742 1 room 451 2 rooms 1,486 3 rooms 1,759 4 rooms 1,158 5 rooms 1,913 6 rooms 655 7 rooms 265 8 rooms 300 9+ rooms
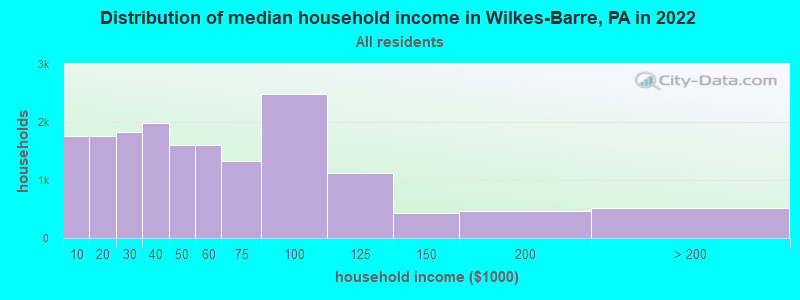
Wilkes-Barre, PA household income distribution 1,754 Less than $10,0001,765 $10,000 to $19,9991,836 $20,000 to $29,9991,975 $30,000 to $39,9991,596 $40,000 to $49,9991,611 $50,000 to $59,9991,320 $60,000 to $74,9992,477 $75,000 to $99,9991,123 $100,000 to $124,999437 $125,000 to $149,999458 $150,000 to $199,999520 $200,000 or more
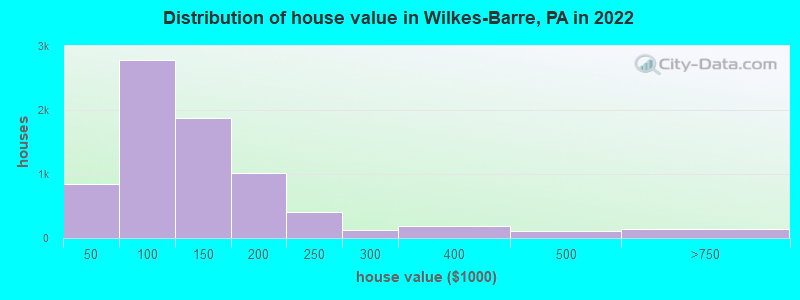
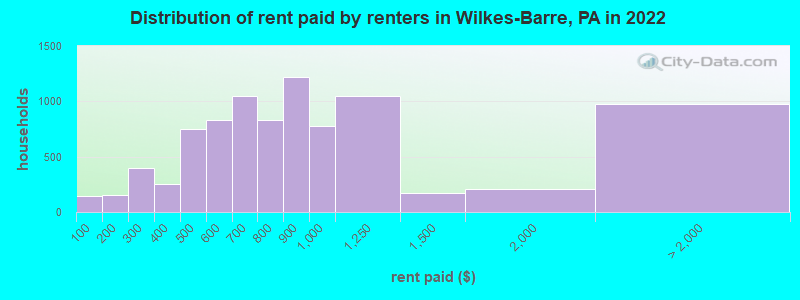
Home value of owner - occupied houses in 2022 in Wilkes-Barre, PA 179 Less than $10,00025 $10,000 to $14,99964 $15,000 to $19,99925 $20,000 to $24,99933 $25,000 to $29,99999 $30,000 to $34,999175 $35,000 to $39,999244 $40,000 to $49,999249 $50,000 to $59,999628 $60,000 to $69,999738 $70,000 to $79,999482 $80,000 to $89,999442 $90,000 to $99,9991,326 $100,000 to $124,999542 $125,000 to $149,999503 $150,000 to $174,999509 $175,000 to $199,999408 $200,000 to $249,999125 $250,000 to $299,999192 $300,000 to $399,999107 $400,000 to $499,999134 $500,000 to $749,999Rent paid by renters in 2022 in Wilkes-Barre, PA 141 Less than $100153 $100 to $149203 $200 to $249196 $250 to $29998 $300 to $349152 $350 to $399235 $400 to $449513 $450 to $499337 $500 to $549495 $550 to $599611 $600 to $649434 $650 to $699523 $700 to $749309 $750 to $7991,224 $800 to $899779 $900 to $9991,051 $1,000 to $1,249172 $1,250 to $1,499205 $1,500 to $1,99910 $2,000 to $2,49916 $2,500 to $2,99974 $3,500 or more872 No cash rent
Percentage of workers working in this county: 89.7%Number of people working at home: 1,372 (7.3% of all workers )
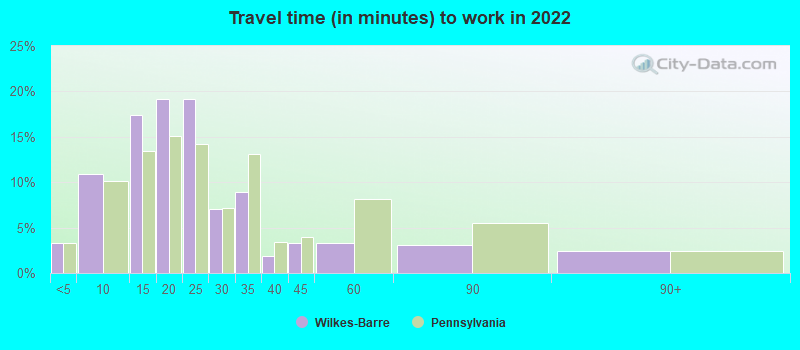
Travel time to work (commute)
Less than 5 minutes: 8865 to 9 minutes: 2,56110 to 14 minutes: 3,47615 to 19 minutes: 3,52620 to 24 minutes: 2,78625 to 29 minutes: 82730 to 34 minutes: 1,27235 to 39 minutes: 30940 to 44 minutes: 9945 to 59 minutes: 49560 to 89 minutes: 52690 or more minutes: 461
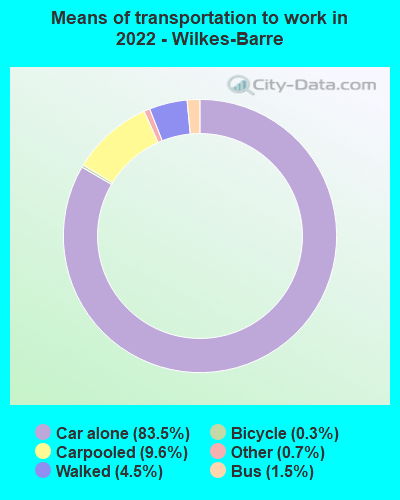
Means of transportation to work:
Drove a car alone: 19,320 (77.7%)Carpooled: 2,355 (9.5%)Bus : 315 (1.3%)Subway or elevated rail : 4 (0.0%)Taxi: 184 (0.7%)Bicycle: 84 (0.3%)Walked: 987 (4.0%)Worked at home: 1,372 (5.5%)
Unemployment by race in 2022
Unemployment rate for White non-Hispanic residents 4.1% Males4.5% FemalesUnemployment rate for Black residents 10.1% Males8.4% FemalesUnemployment rate for Asian residents 48.2% FemalesUnemployment rate for other race residents 13.7% Males4.5% FemalesUnemployment rate for two or more race residents 8.5% Males11.4% FemalesUnemployment rate for Hispanic or Latino residents 16.9% Males7.0% Females
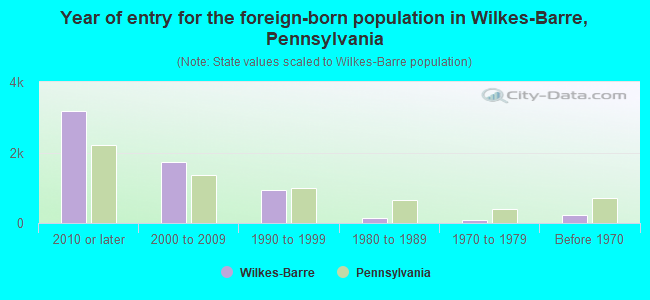
Year of entry for the foreign-born population in Wilkes-Barre, Pennsylvania
3,177 2010 or later 1,735 2000 to 2009 949 1990 to 1999 153 1980 to 1989 74 1970 to 1979 233 Before 1970
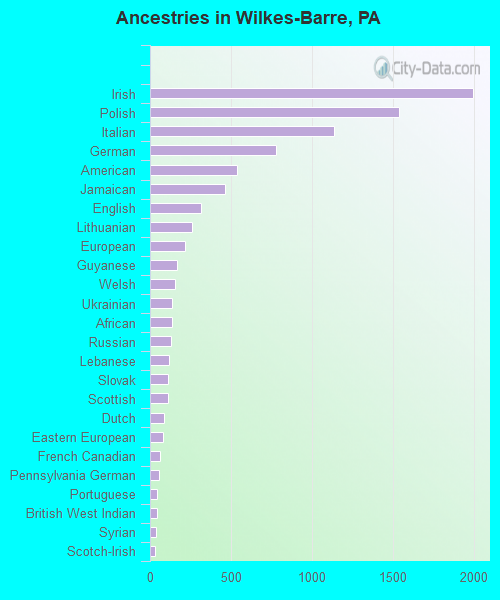
First ancestries reported:
Irish: 1,994 (10.4%)
Polish: 1,538 (8.1%)
Italian: 1,138 (6.0%)
German: 781 (4.1%)
American: 536 (2.8%)
Jamaican: 465 (2.4%)
English: 315 (1.6%)
Lithuanian: 260 (1.4%)
European: 218 (1.1%)
Guyanese: 164 (0.9%)
Welsh: 156 (0.8%)
Ukrainian: 136 (0.7%)
African: 134 (0.7%)
Russian: 128 (0.7%)
Lebanese: 115 (0.6%)
Slovak: 112 (0.6%)
Scottish: 110 (0.6%)
Dutch: 89 (0.5%)
Eastern European: 78 (0.4%)
French Canadian: 61 (0.3%)
Pennsylvania German: 57 (0.3%)
Portuguese: 44 (0.2%)
British West Indian: 43 (0.2%)
Syrian: 38 (0.2%)
Scotch-Irish: 31 (0.2%)
Austrian: 29 (0.2%)
Greek: 29 (0.2%)
Kenyan: 23 (0.1%)
Scandinavian: 21 (0.1%)
Slovene: 20 (0.1%)
Ethiopian: 19 (0.10%)
Arab: 15 (0.08%)
Czech: 10 (0.05%)
Belgian: 8 (0.04%)
Norwegian: 7 (0.04%)
Swedish: 7 (0.04%)
Czechoslovakian: 6 (0.03%)
Iranian: 5 (0.03%)
British: 4 (0.02%)
Hungarian: 4 (0.02%)
Brazilian: 3 (0.02%)
Ghanaian: 3 (0.02%)
Trinidadian and Tobagonian: 3 (0.02%)
Yugoslavian: 2 (0.01%) Most common places of birth for foreign-born residents (%): Dominican Republic Wilkes-Barre:
57.8% (3,832)Pennsylvania:
9.2% (86,544)
Mexico Wilkes-Barre:
13.9% (920)Pennsylvania:
5.8% (54,190)
Dominica Wilkes-Barre:
3.9% (260)Pennsylvania:
0.3% (2,729)
Ecuador Wilkes-Barre:
3.9% (257)Pennsylvania:
1.1% (10,035)
Jamaica Wilkes-Barre:
3.8% (251)Pennsylvania:
2.4% (22,612)
Colombia Wilkes-Barre:
2.9% (191)Pennsylvania:
1.5% (13,823)
Spain Wilkes-Barre:
2.8% (186)Pennsylvania:
0.3% (2,635)
Philippines Wilkes-Barre:
2.1% (139)Pennsylvania:
2.2% (21,039)
Africa, n.e.c. Wilkes-Barre:
2.0% (130)Pennsylvania:
0.6% (5,479)
Vietnam Wilkes-Barre:
1.6% (109)Pennsylvania:
3.3% (31,542)
Guyana Wilkes-Barre:
1.6% (107)Pennsylvania:
0.5% (4,519)
Ukraine Wilkes-Barre:
1.6% (106)Pennsylvania:
2.1% (19,841)
Place of birth for U.S.-born residents:
This state: 24,150Other state: 12,372Northeast: 9,289Midwest: 422South: 2,085West: 597 79.2% of Wilkes-Barre residents lived in the same house 1 years ago.
Out of people who lived in different houses, 30.1% lived in this county.
Out of people who lived in different counties, 37.0% lived in Pennsylvania.
Wilkes-Barre:
79.2%State average:
89.3%
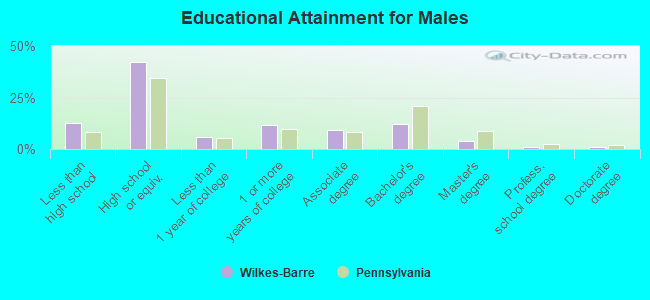
Education attainment for males 25 years and older:
No schooling: 296Nursery to 4th grade: 595th and 6th grade: 897th and 8th grade: 2649th grade: 8910th grade: 31311th grade: 20812th grade, no diploma: 416High school graduate (or equivalency): 5,901Less than 1 year of college: 839Some college more than 1 year, no degree: 1,658Associate degree: 1,322Bachelor's degree: 1,726Master's degree: 519Professional school degree: 145Doctorate degree: 157
Education attainment for females 25 years and older:
No schooling: 623Nursery to 4th grade: 1245th and 6th grade: 947th and 8th grade: 1849th grade: 14010th grade: 27811th grade: 19112th grade, no diploma: 432High school graduate (or equivalency): 5,351Less than 1 year of college: 925Some college more than 1 year, no degree: 1,634Associate degree: 1,501Bachelor's degree: 2,048Master's degree: 661Professional school degree: 90Doctorate degree: 47
Housing units in structures:
One, detached: 10,210One, attached: 2,710Two: 1,4173 or 4: 1,8675 to 9: 83610 to 19: 50020 to 49: 69850 or more: 1,648Mobile homes: 79Housing units lacking complete plumbing facilities in 2022: 3.4%Housing units lacking complete kitchen facilities in 2022: 3.7%House/condo owner moved in on average 15 years ago
Renter moved in on average 2 years ago
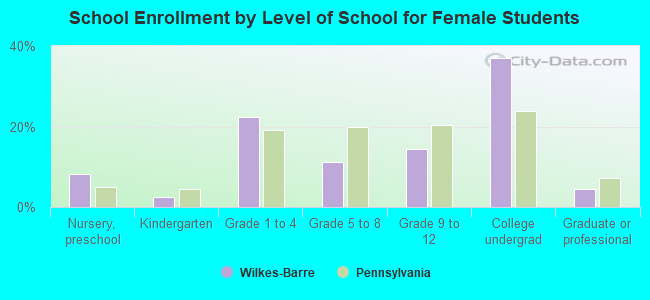
Private vs. public school enrollment:
Students in private schools in grades 1 to 8 (elementary and middle school): 514 Here:
12.8%Pennsylvania:
15.7%
Students in private schools in grades 9 to 12 (high school): 136 Here:
7.1%Pennsylvania:
13.4%
Students in private undergraduate colleges: 2,717 Here:
65.5%Pennsylvania:
39.8%