Williamsburg, VA (Virginia) Houses and Residents
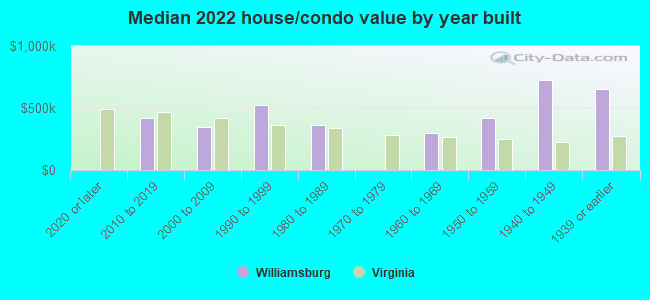
| Williamsburg: | $414,991 |
| Virginia: | $365,700 |
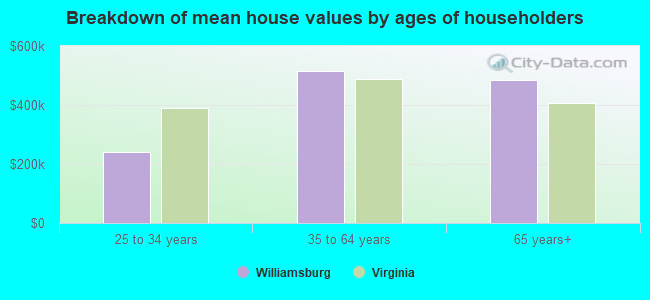
Mean price in 2022:
Detached houses: $631,234
Here: $631,234 State: $472,865 Townhouses or other attached units: $376,471
Here: $376,471 State: $457,437 In 2-unit structures: $244,920
Here: $244,920 State: $396,289 In 3-to-4-unit structures: $262,854
Here: $262,854 State: $252,346 In 5-or-more-unit structures: $170,075
Here: $170,075 State: $382,551
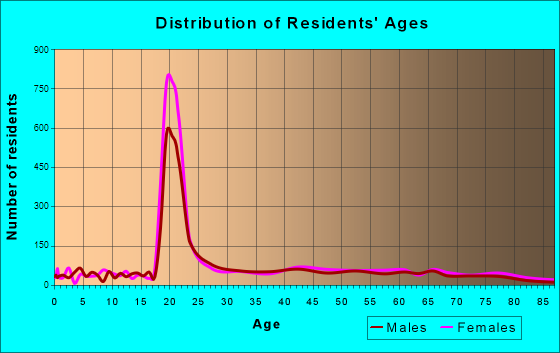
Total population: 14,691 (Urban population: 11,998, Rural population: 0)
Houses: 5,826 (4,962 occupied: 2,552 owner occupied, 2,464 renter occupied)
| % of renters here: | 49% |
| State: | 33% |
Housing density: 682 houses/condos per square mile
Median price asked for vacant for-sale houses and condos in 2022: $642,602.
Median contract rent in 2022: $1,180 (lower quartile is $946, upper quartile is $1,424)
Median rent asked for vacant for-rent units in 2022: $1,499
Median gross rent in Williamsburg, VA in 2022: $1,274
Housing units in Williamsburg with a mortgage: 1,497 (87 second mortgage, 0 home equity loan, 85 both second mortgage and home equity loan)
Houses without a mortgage: 39
Median household income for houses/condos with a mortgage: $116,962
Median household income for apartments without a mortgage: $101,096
Median monthly housing costs: $1,195
Compare current foreclosures in Williamsburg, VA:
| Photo | Address | Area | Beds / Baths | Price | Details |
|---|---|---|---|---|---|

|
#1
Trafalgar Ct
Williamsburg, VA 23185
|
2,774 sq. feet
|
2 baths 4 beds |
show details | |

|
#2
Algonquin Trl
Williamsburg, VA 23185
|
1,650 sq. feet
|
2 baths 3 beds |
show details | |

|
#3
Algonquin Trl
Williamsburg, VA 23185
|
1,384 sq. feet
|
2 baths 3 beds |
show details | |

|
#4
Allyson Dr
Williamsburg, VA 23188
|
1,273 sq. feet
|
2 baths 3 beds |
show details | |

|
#5
Drew Rd
Williamsburg, VA 23185
|
1,158 sq. feet
|
1 baths 3 beds |
show details | |

|
#6
Blockade Reach
Williamsburg, VA 23185
|
2,379 sq. feet
|
2 baths 3 beds |
show details | |

|
#7
Merchant Man Ct
Williamsburg, VA 23185
|
4,344 sq. feet
|
4 baths 6 beds |
show details | |

|
#8
Wetherburn Ln
Williamsburg, VA 23188
|
2,816 sq. feet
|
3 baths 4 beds |
show details | |

|
#9
Rockingham Dr
Williamsburg, VA 23188
|
2,749 sq. feet
|
2 baths 4 beds |
show details | |

|
#10
Springfield Dr
Williamsburg, VA 23185
|
1,748 sq. feet
|
1 baths 3 beds |
show details |
| Photo | Address | Area | Beds / Baths | Price | Details |
|---|---|---|---|---|---|

|
#11
Musket Dr
Williamsburg, VA 23185
|
1,592 sq. feet
|
2 baths 3 beds |
show details | |

|
#12
Carters Neck Rd
Williamsburg, VA 23188
|
2,308 sq. feet
|
2 baths 4 beds |
show details | |

|
#13
Skiffes Creek Cir
Williamsburg, VA 23185
|
1,430 sq. feet
|
2 baths 3 beds |
show details | |

|
#14
Workington
Williamsburg, VA 23188
|
3,474 sq. feet
|
3 baths 4 beds |
show details | |

|
#15
London Company Way
Williamsburg, VA 23185
|
1,210 sq. feet
|
1 baths 3 beds |
show details | |

|
#16
Fox Hollow Road
Williamsburg, VA 23188
|
1,066 sq. feet
|
2 baths 3 beds |
show details | |

|
#17
Burnham Rd
Williamsburg, VA 23185
|
1,048 sq. feet
|
1 baths 3 beds |
show details | |

|
#18
Chestnut Hill Ct
Williamsburg, VA 23185
|
1,566 sq. feet
|
2 baths 3 beds |
show details | |

|
#19
Debra Dr
Williamsburg, VA 23188
|
1,182 sq. feet
|
1 baths 3 beds |
show details | |

|
#20
Jackson St
Williamsburg, VA 23185
|
1,904 sq. feet
|
2 baths 3 beds |
show details |
| Photo | Address | Area | Beds / Baths | Price | Details |
|---|---|---|---|---|---|

|
#21
Callahan Dr
Williamsburg, VA 23185
|
1,518 sq. feet
|
2 baths 3 beds |
show details | |

|
#22
Fiddlers Ridge Pkwy
Williamsburg, VA 23185
|
2,254 sq. feet
|
2 baths 4 beds |
show details | |

|
#23
Magruder Ave
Williamsburg, VA 23185
|
1,158 sq. feet
|
2 baths 3 beds |
show details | |

|
#24
Beacon Hill Dr
Williamsburg, VA 23188
|
1,984 sq. feet
|
1 baths 3 beds |
show details | |

|
#25
Peacepipe Pl
Williamsburg, VA 23185
|
1,454 sq. feet
|
2 baths 3 beds |
show details | |

|
#26
Burwell Ct
Williamsburg, VA 23185
|
3,998 sq. feet
|
3 baths 4 beds |
show details | |

|
#27
Red Berkshire
Williamsburg, VA 23188
|
2,901 sq. feet
|
2 baths 3 beds |
show details | |

|
#28
Drew Rd
Williamsburg, VA 23185
|
1,216 sq. feet
|
1 baths 1 beds |
show details | |

|
#29
Queensbury Ln
Williamsburg, VA 23185
|
2,178 sq. feet
|
2 baths 4 beds |
show details | |

|
#30
Colonial Ave
Williamsburg, VA 23185
|
2,446 sq. feet
|
2 baths 4 beds |
show details |
| Photo | Address | Area | Beds / Baths | Price | Details |
|---|---|---|---|---|---|

|
#31
Sand Hill Rd
Williamsburg, VA 23188
|
1,622 sq. feet
|
2 baths 3 beds |
show details | |

|
#32
Queensberry Lane
Williamsburg, VA 23185
|
2,178 sq. feet
|
2 baths 4 beds |
show details | |

|
#33
Mattaponi Trl
Williamsburg, VA 23188
|
1,500 sq. feet
|
2 baths 3 beds |
show details | |

|
#34
Hickory Hills Dr
Williamsburg, VA 23185
|
1,042 sq. feet
|
2 baths 3 beds |
show details | |

|
#35
Skiffes Creek Cir
Williamsburg, VA 23185
|
1,200 sq. feet
|
1 baths 3 beds |
show details | |

|
#36
E Tazewells Way
Williamsburg, VA 23185
|
1,820 sq. feet
|
2 baths 3 beds |
show details | |

|
#37
Skiffes Creek Cir
Williamsburg, VA 23185
|
1,200 sq. feet
|
1 baths - beds |
show details | |

|
#38
John Tyler Hwy
Williamsburg, VA 23185
|
480 sq. feet
|
1 baths - beds |
show details | |

|
#39
Prosperity Ct
Williamsburg, VA 23188
|
- sq. feet
|
- baths - beds |
show details | |

|
#40
Summit Loop
Williamsburg, VA 23188
|
- sq. feet
|
- baths - beds |
show details |
| Photo | Address | Area | Beds / Baths | Price | Details |
|---|---|---|---|---|---|

|
#41
Riverview Rd
Williamsburg, VA 23188
|
- sq. feet
|
- baths - beds |
show details | |

|
#42
Saint Johns Ct
Williamsburg, VA 23185
|
- sq. feet
|
- baths - beds |
show details | |

|
#43
Queens Creek Rd
Williamsburg, VA 23185
|
- sq. feet
|
- baths - beds |
show details | |

|
#44
Merrimac Trl Apt 35d
Williamsburg, VA 23185
|
- sq. feet
|
- baths - beds |
show details | |

|
#45
Musket Dr
Williamsburg, VA 23185
|
- sq. feet
|
- baths - beds |
show details | |

|
#46
Cluster Way
Williamsburg, VA 23188
|
- sq. feet
|
- baths - beds |
show details | |

|
#47
Jan Rae Cir
Williamsburg, VA 23185
|
- sq. feet
|
- baths - beds |
show details | |

|
#48
Neck O Land Rd
Williamsburg, VA 23185
|
- sq. feet
|
- baths - beds |
show details | |

|
#49
Cooley Rd
Williamsburg, VA 23188
|
- sq. feet
|
- baths - beds |
show details | |

|
Check over 1 million property listings on Foreclosure.com!
|
browse all offers | |||

Latest news about housing in Williamsburg, VA collected exclusively by city-data.com from local newspapers, TV, and radio stations


Median year apartment built: 1981
Household type by relationship:
Households: 15,592- Male householders: 2,516 (906 living alone), Female householders: 2,399 (966 living alone)
1,903 spouses (1,868 opposite-sex spouses), 210 unmarried partners, (173 opposite-sex unmarried partners), 2,155 children (2,051 natural, 69 adopted, 34 stepchildren), 213 grandchildren, 62 brothers or sisters, 97 parents, 0 foster children, 80 other relatives, 1,057 non-relatives
- In group quarters: 4,895
Size of family households: 1,272 2-persons, 716 3-persons, 386 4-persons, 83 5-persons, 29 6-persons.
Size of nonfamily households: 1,926 1-person, 404 2-persons, 85 3-persons, 110 4-persons, 6 5-persons, 9 7-or-more-persons.
958 married couples with children.
426 single-parent households (28 men, 398 women).
85.1% of residents of Williamsburg speak English at home.
4.2% of residents speak Spanish at home (64% speak English very well, 10% speak English well, 14% speak English not well, 12% don't speak English at all).
4.5% of residents speak other Indo-European language at home (89% speak English very well, 11% speak English well).
4.1% of residents speak Asian or Pacific Island language at home (90% speak English very well, 3% speak English well, 6% speak English not well).
1.8% of residents speak other language at home (91% speak English very well, 7% speak English well, 1% speak English not well).
Foreign born population: 1,325 (8.5%)
(47.9% of them are naturalized citizens)
| Here: | 6.9 |
| State: | 7.0 |
| Here: | 4.2 |
| State: | 4.3 |
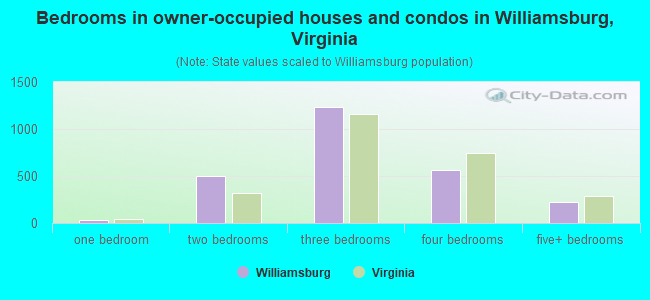
- Bedrooms in owner-occupied houses and condos in Williamsburg, Virginia
- 6no bedroom
- 371 bedroom
- 5012 bedrooms
- 1,2293 bedrooms
- 5594 bedrooms
- 2205+ bedrooms
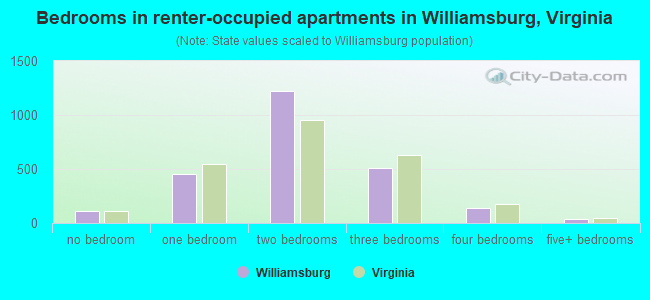
- Bedrooms in renter-occupied apartments in Williamsburg, Virginia
- 108no bedroom
- 4501 bedroom
- 1,2252 bedrooms
- 5093 bedrooms
- 1364 bedrooms
- 375+ bedrooms
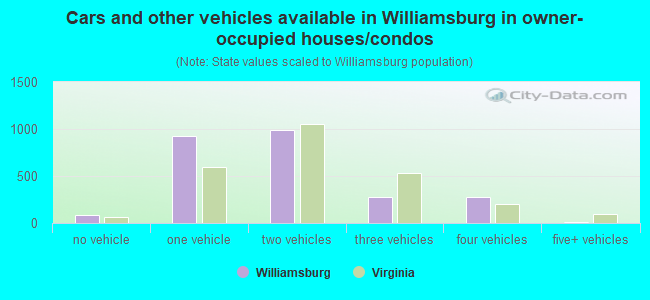
- Cars and other vehicles available in Williamsburg in owner-occupied houses/condos
- 80no vehicle
- 9231 vehicle
- 9892 vehicles
- 2753 vehicles
- 2764 vehicles
- 95+ vehicles
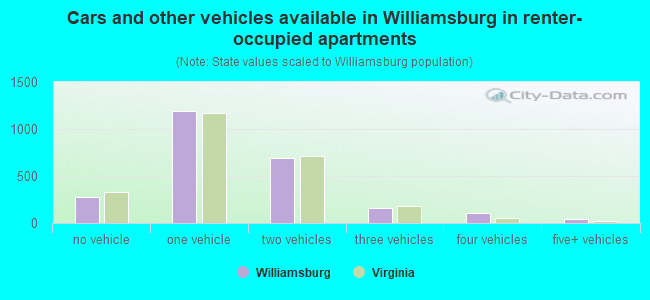
- Cars and other vehicles available in Williamsburg in renter-occupied apartments
- 275no vehicle
- 1,1881 vehicle
- 6932 vehicles
- 1633 vehicles
- 1044 vehicles
- 415+ vehicles
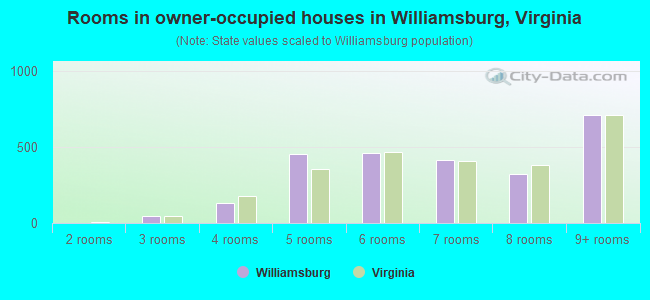
- Rooms in owner-occupied houses in Williamsburg, Virginia
- 61 room
- 02 rooms
- 473 rooms
- 1324 rooms
- 4555 rooms
- 4616 rooms
- 4177 rooms
- 3238 rooms
- 7119+ rooms
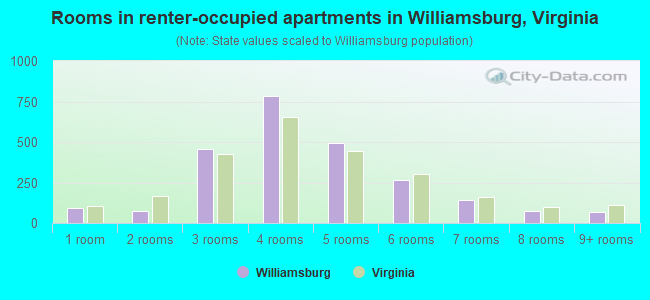
- Rooms in renter-occupied apartments in Williamsburg, Virginia
- 951 room
- 772 rooms
- 4553 rooms
- 7874 rooms
- 4935 rooms
- 2656 rooms
- 1457 rooms
- 778 rooms
- 709+ rooms
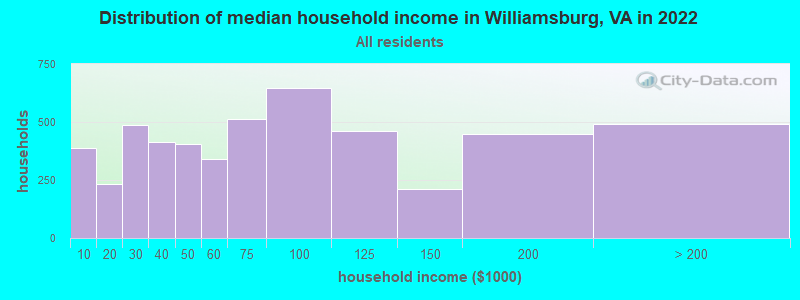
Williamsburg, VA household income distribution

- 387Less than $10,000
- 234$10,000 to $19,999
- 488$20,000 to $29,999
- 412$30,000 to $39,999
- 406$40,000 to $49,999
- 339$50,000 to $59,999
- 514$60,000 to $74,999
- 647$75,000 to $99,999
- 462$100,000 to $124,999
- 212$125,000 to $149,999
- 447$150,000 to $199,999
- 490$200,000 or more
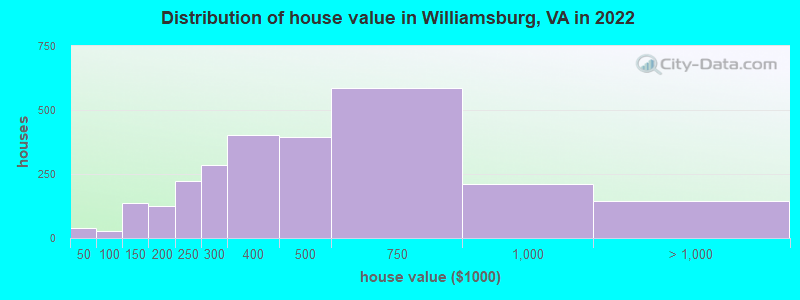
Home value of owner - occupied houses in 2022 in Williamsburg, VA
-
- 39Less than $10,000
- 29$90,000 to $99,999
- 63$100,000 to $124,999
- 74$125,000 to $149,999
- 55$150,000 to $174,999
- 70$175,000 to $199,999
- 224$200,000 to $249,999
- 283$250,000 to $299,999
- 404$300,000 to $399,999
- 393$400,000 to $499,999
- 584$500,000 to $749,999
- 212$750,000 to $999,999
- 122$1,000,000 to $1,499,999
- 21$2,000,000 or more
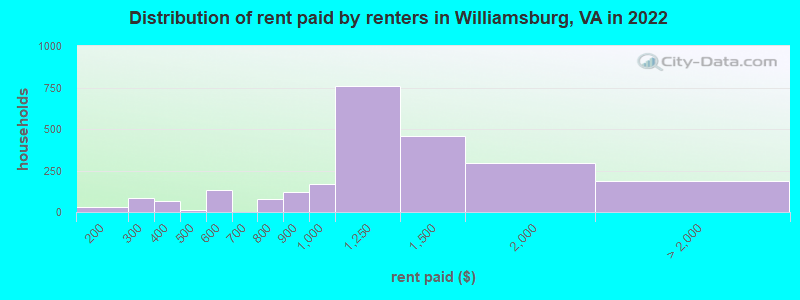
Rent paid by renters in 2022 in Williamsburg, VA
-
- 27$100 to $149
- 84$200 to $249
- 67$300 to $349
- 13$400 to $449
- 58$500 to $549
- 76$550 to $599
- 79$700 to $749
- 118$800 to $899
- 167$900 to $999
- 758$1,000 to $1,249
- 456$1,250 to $1,499
- 296$1,500 to $1,999
- 114$2,000 to $2,499
- 7$2,500 to $2,999
- 38$3,000 to $3,499
- 11$3,500 or more
- 15No cash rent
Percentage of workers working in this county: 55.8%
Number of people working at home: 1,281 (19.6% of all workers)
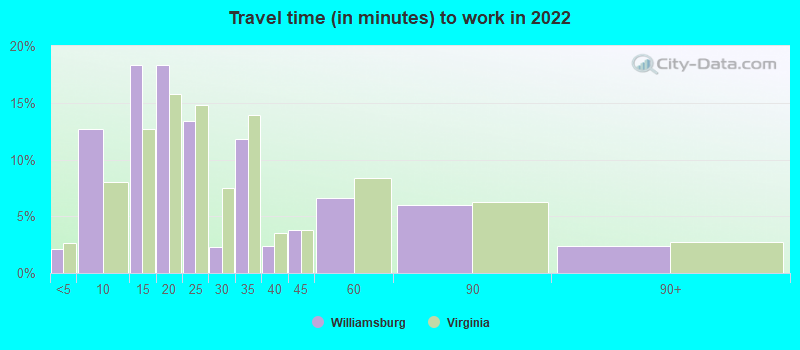
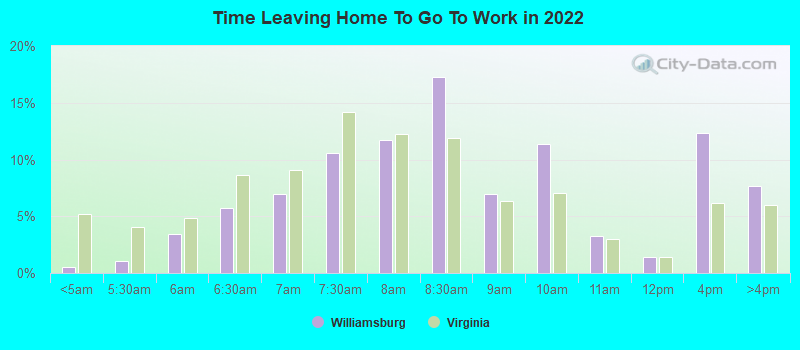
Travel time to work (commute)
- Less than 5 minutes: 221
- 5 to 9 minutes: 1,123
- 10 to 14 minutes: 1,161
- 15 to 19 minutes: 1,127
- 20 to 24 minutes: 542
- 25 to 29 minutes: 118
- 30 to 34 minutes: 374
- 35 to 39 minutes: 258
- 40 to 44 minutes: 94
- 45 to 59 minutes: 140
- 60 to 89 minutes: 184
- 90 or more minutes: 8
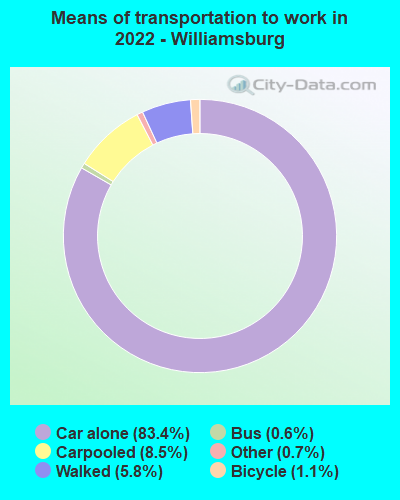
Means of transportation to work:
- Drove a car alone: 10,647 (74.0%)
- Carpooled: 1,098 (7.6%)
- Bus: 50 (0.3%)
- Taxi: 115 (0.8%)
- Bicycle: 136 (0.9%)
- Walked: 791 (5.5%)
- Worked at home: 1,281 (8.9%)
- Unemployment by race in 2022
- Unemployment rate for White non-Hispanic residents
- 1.0%Males
- 3.8%Females
- Unemployment rate for Black residents
- 3.6%Males
- 16.8%Females
- Unemployment rate for Asian residents
- 11.9%Males
- 18.6%Females
- Unemployment rate for other race residents
- 22.6%Females
- Unemployment rate for two or more race residents
- 12.3%Males
- Unemployment rate for Hispanic or Latino residents
- 6.4%Males
- 2.5%Females
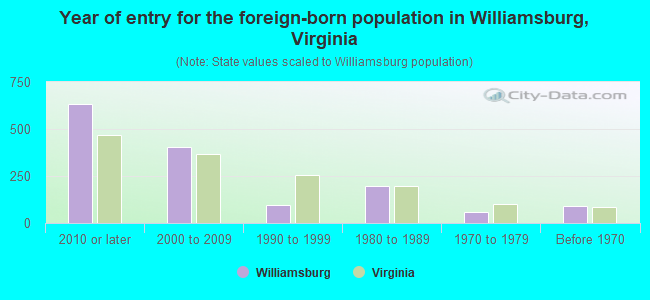
- Year of entry for the foreign-born population in Williamsburg, Virginia
- 6332010 or later
- 4032000 to 2009
- 941990 to 1999
- 1951980 to 1989
- 581970 to 1979
- 89Before 1970
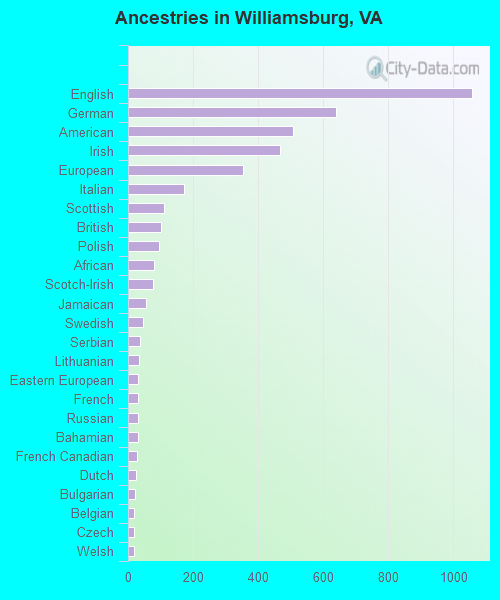
First ancestries reported:
- English: 1,057 (13.8%)
- German: 640 (8.3%)
- American: 508 (6.6%)
- Irish: 468 (6.1%)
- European: 353 (4.6%)
- Italian: 171 (2.2%)
- Scottish: 111 (1.4%)
- British: 101 (1.3%)
- Polish: 94 (1.2%)
- African: 81 (1.1%)
- Scotch-Irish: 76 (1.0%)
- Jamaican: 56 (0.7%)
- Swedish: 45 (0.6%)
- Serbian: 36 (0.5%)
- Lithuanian: 33 (0.4%)
- Eastern European: 32 (0.4%)
- French: 32 (0.4%)
- Russian: 30 (0.4%)
- Bahamian: 30 (0.4%)
- French Canadian: 28 (0.4%)
- Dutch: 24 (0.3%)
- Bulgarian: 21 (0.3%)
- Belgian: 19 (0.2%)
- Czech: 19 (0.2%)
- Welsh: 18 (0.2%)
- Lebanese: 17 (0.2%)
- Greek: 16 (0.2%)
- Ukrainian: 16 (0.2%)
- Australian: 14 (0.2%)
- Hungarian: 14 (0.2%)
- Sudanese: 13 (0.2%)
- Norwegian: 9 (0.1%)
- Danish: 8 (0.1%)
- Scandinavian: 7 (0.09%)
- New Zealander: 6 (0.08%)
- Finnish: 5 (0.07%)
Most common places of birth for foreign-born residents (%):
| Williamsburg: | 16.2% (215) |
| Virginia: | 9.9% (107,534) |
| Williamsburg: | 16.1% (213) |
| Virginia: | 3.9% (42,989) |
| Williamsburg: | 7.5% (100) |
| Virginia: | 0.9% (9,695) |
| Williamsburg: | 6.9% (92) |
| Virginia: | 9.0% (97,830) |
| Williamsburg: | 4.3% (57) |
| Virginia: | 4.9% (52,857) |
| Williamsburg: | 4.1% (54) |
| Virginia: | 1.0% (10,734) |
| Williamsburg: | 3.4% (45) |
| Virginia: | 0.3% (2,740) |
| Williamsburg: | 3.3% (44) |
| Virginia: | 0.8% (8,186) |
| Williamsburg: | 2.9% (39) |
| Virginia: | 0.2% (1,786) |
| Williamsburg: | 2.8% (37) |
| Virginia: | 0.0% (269) |
| Williamsburg: | 2.6% (34) |
| Virginia: | 0.2% (2,350) |
| Williamsburg: | 2.4% (32) |
| Virginia: | 4.8% (52,629) |
| Williamsburg: | 2.0% (27) |
| Virginia: | 0.8% (8,513) |
| Williamsburg: | 2.0% (27) |
| Virginia: | 0.2% (2,246) |
| Williamsburg: | 1.9% (25) |
| Virginia: | 1.3% (14,417) |
| Williamsburg: | 1.9% (25) |
| Virginia: | 0.1% (1,246) |
| Williamsburg: | 1.7% (23) |
| Virginia: | 0.4% (4,196) |
| Williamsburg: | 1.7% (23) |
| Virginia: | 0.4% (4,715) |
| Williamsburg: | 1.6% (21) |
| Virginia: | 2.4% (25,722) |
Place of birth for U.S.-born residents:
- This state: 6,495
- Other state: 7,357
- Northeast: 3,151
- Midwest: 1,049
- South: 2,228
- West: 936
70.7% of Williamsburg residents lived in the same house 1 years ago.
Out of people who lived in different houses, 14.0% lived in this county.
Out of people who lived in different counties, 58.6% lived in Virginia.
| Williamsburg: | 70.7% |
| State average: | 86.6% |
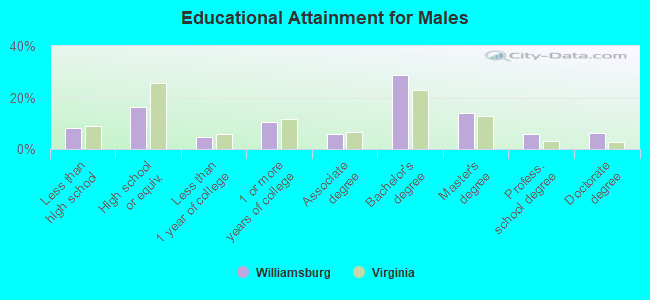
Education attainment for males 25 years and older:
- No schooling: 94
- Nursery to 4th grade: 0
- 5th and 6th grade: 38
- 7th and 8th grade: 5
- 9th grade: 20
- 10th grade: 57
- 11th grade: 76
- 12th grade, no diploma: 15
- High school graduate (or equivalency): 600
- Less than 1 year of college: 170
- Some college more than 1 year, no degree: 383
- Associate degree: 214
- Bachelor's degree: 1,061
- Master's degree: 512
- Professional school degree: 213
- Doctorate degree: 222
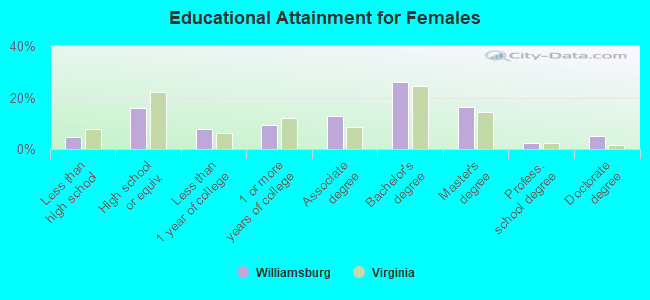
Education attainment for females 25 years and older:
- No schooling: 12
- Nursery to 4th grade: 10
- 5th and 6th grade: 25
- 7th and 8th grade: 0
- 9th grade: 21
- 10th grade: 71
- 11th grade: 16
- 12th grade, no diploma: 31
- High school graduate (or equivalency): 658
- Less than 1 year of college: 323
- Some college more than 1 year, no degree: 378
- Associate degree: 521
- Bachelor's degree: 1,073
- Master's degree: 663
- Professional school degree: 92
- Doctorate degree: 211
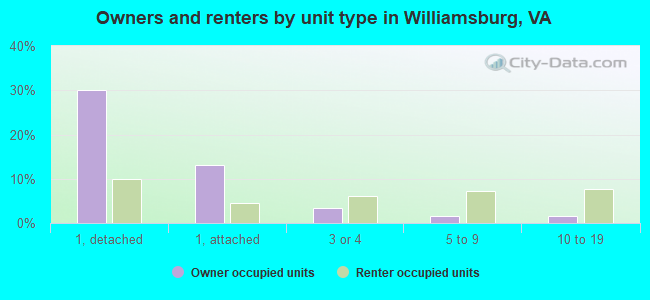
Housing units in structures:
- One, detached: 2,403
- One, attached: 827
- Two: 366
- 3 or 4: 432
- 5 to 9: 710
- 10 to 19: 519
- 20 to 49: 371
- 50 or more: 186
- Mobile homes: 10
Housing units lacking complete kitchen facilities in 2022: 0.8%
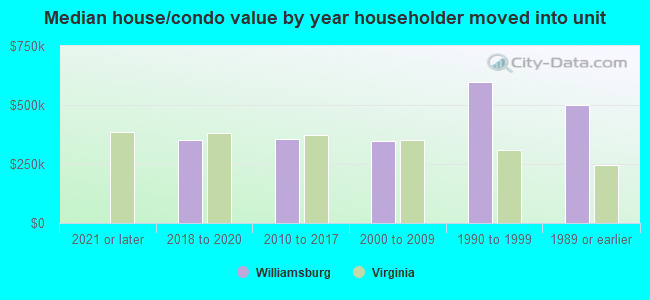
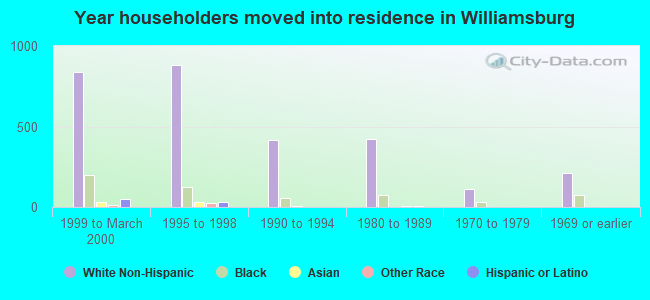
House/condo owner moved in on average 10 years ago
Renter moved in on average 1 years ago
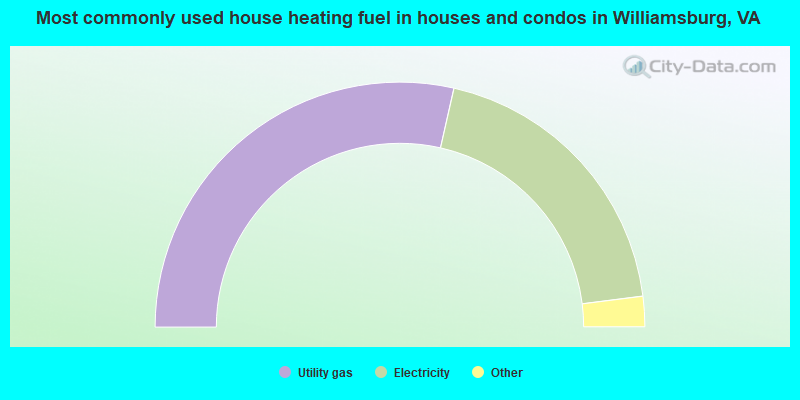
- 57.1%Utility gas
- 38.9%Electricity
- 3.4%Fuel oil, kerosene, etc.
- 0.6%Bottled, tank, or LP gas
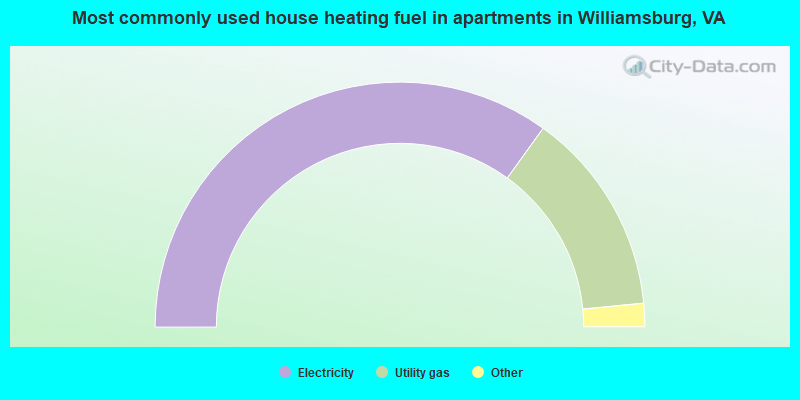
- 69.9%Electricity
- 27.0%Utility gas
- 1.3%No fuel used
- 0.6%Other fuel
- 0.6%Bottled, tank, or LP gas
- 0.5%Fuel oil, kerosene, etc.
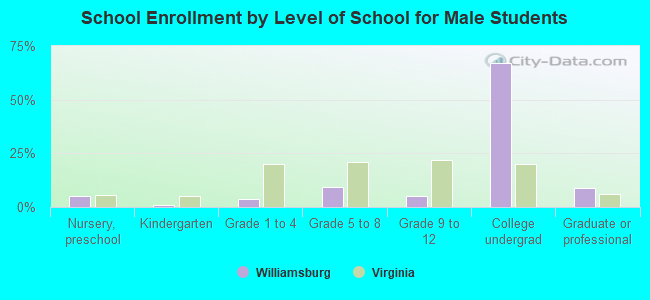
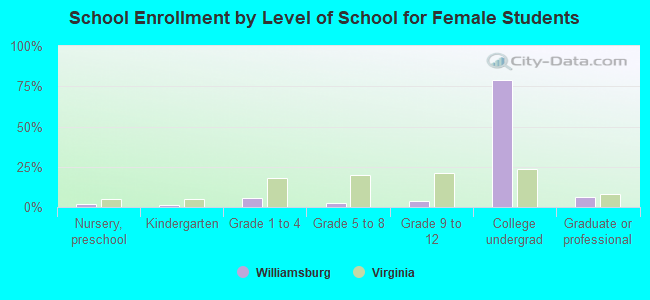
Private vs. public school enrollment:
| Here: | 20.6% |
| Virginia: | 13.2% |
| Here: | 4.7% |
| Virginia: | 10.2% |
| Here: | 2.4% |
| Virginia: | 18.7% |