Wilmette, IL (Illinois) Houses and Residents
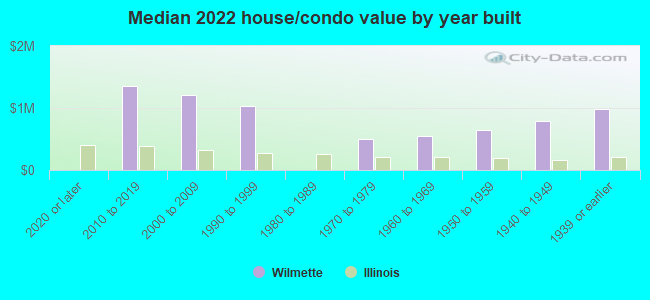
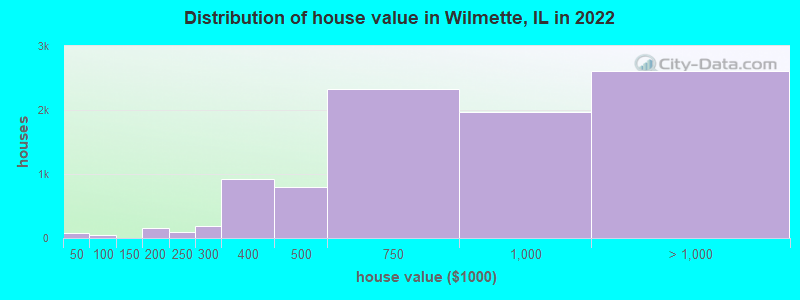
Estimated median house or condo value in 2022: $791,727 (it was $424,800 in 2000 )
Wilmette:
$791,727Illinois:
$251,600
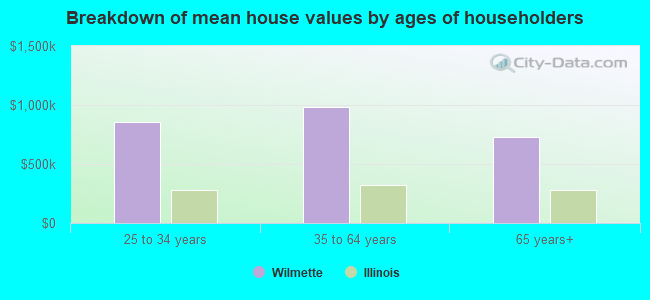
Lower value quartile - upper value quartile: $533,306 - $1,127,449Mean price in 2022: Detached houses: $946,371 Here:
$946,371State:
$310,164
Townhouses or other attached units: $483,771 Here:
$483,771State:
$286,230
In 2-unit structures: $407,556 Here:
$407,556State:
$299,638
In 3-to-4-unit structures: $292,212 Here:
$292,212State:
$330,907
In 5-or-more-unit structures: $510,470 Here:
$510,470State:
$318,887
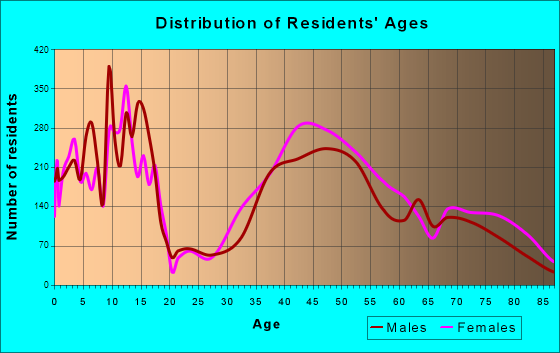
Total population: 27,446 (All urban)
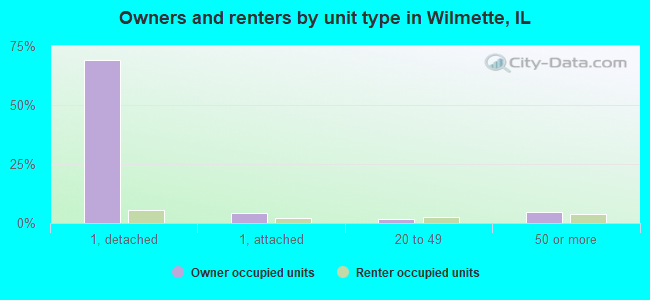
Houses: 10,834 (10,442 occupied: 9,270 owner occupied, 1,350 renter occupied )
% of renters here:
13%State:
33%
Housing density: 2,012 houses/condos per square mile
Median price asked for vacant for-sale houses and condos in 2022: $681,513.
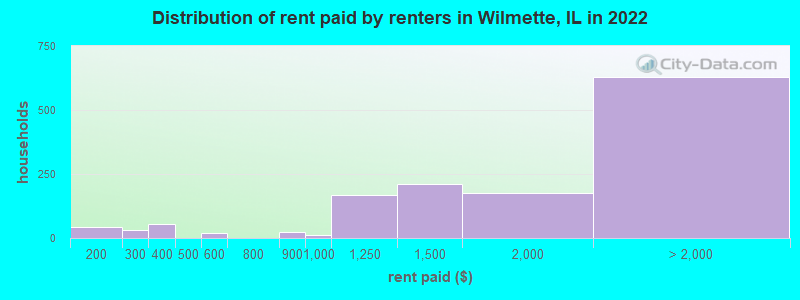
Median contract rent in 2022: $1,625 (lower quartile is $1,189, upper quartile is over $2,000)
Median rent asked for vacant for-rent units in 2022: $1,786
Median gross rent in Wilmette, IL in 2022: $1,909
Housing units in Wilmette with a mortgage: 5,667 (724 second mortgage, 46 home equity loan, 631 both second mortgage and home equity loan )Houses without a mortgage: 189
Median household income for houses/condos with a mortgage: $239,328
Median household income for apartments without a mortgage: $145,468
Median monthly housing costs: $2,899
Data:
Median house or condo value ($)
Median house or condo value ($ change since 2000)
Median house or condo value ($) - White
Median house or condo value ($) - Black or African American
Median house or condo value ($) - Asian
Median house or condo value ($) - Hispanic or Latino
Median house or condo value ($) - American Indian and Alaska Native
Median house or condo value ($) - Multirace
Median house or condo value ($) - Other Race
Median price asked for mobile homes ($)
Household density (households per square mile)
Mean house or condo value by units in structure - 1, detached ($)
Mean house or condo value by units in structure - 1, attached ($)
Mean house or condo value by units in structure - 2 ($)
Mean house or condo value by units in structure by units in structure - 3 or 4 ($)
Mean house or condo value by units in structure - 5 or more ($)
Mean house or condo value by units in structure - Boat, RV, van, etc. ($)
Mean house or condo value by units in structure - Mobile home ($)
Median contract rent ($)
Median contract rent - Lower quartile ($)
Median contract rent - Upper quartile ($)
Median gross rent ($)
Urban houses (%)
Rural houses (%)
Houses occupied (%)
Houses occupied (% change since 2000)
Houses owner occupied (%)
Houses owner occupied (% change since 2000)
Houses renter occupied (%)
Houses renter occupied (% change since 2000)
Vacant housing units - For rent (%)
Vacant housing units - For rent (% change since 2000)
Vacant housing units - For sale only (%)
Vacant housing units - For sale only (% change since 2000)
Vacant housing units - Rented or sold, not occupied (%)
Vacant housing units - Rented or sold, not occupied (% change since 2000)
Vacant housing units - For seasonal, recreational, or occasional use (%)
Vacant housing units - For seasonal, recreational, or occasional use (% change since 2000)
Vacant housing units - For migrant workers (%)
Vacant housing units - For migrant workers (% change since 2000)
Vacant housing units - Other vacant (%)
Vacant housing units - Other vacant (% change since 2000)
Median monthly housing costs ($)
Median household income for houses/condos with a mortgage ($)
Median household income for houses/condos without a mortgage ($)
Median household income ($)
Median household income ($) - White
Median household income ($) - Black or African American
Median household income ($) - Asian
Median household income ($) - Hispanic or Latino
Median household income ($) - American Indian and Alaska Native
Median household income ($) - Multirace
Median household income ($) - Other Race
Mortgage status - with mortgage (%)
Mortgage status - with second mortgage (%)
Mortgage status - with home equity loan (%)
Mortgage status - with both second mortgage and home equity loan (%)
Mortgage status - without a mortgage (%)
Median year house/condo built
Median year apartment built
Household type by relationship - Male householder living alone (%)
Household type by relationship - Male householder not living alone (%)
Household type by relationship - Female householder living alone (%)
Household type by relationship - Female householder not living alone (%)
Household type by relationship - Opposite-Sex spouse (%)
Household type by relationship - Same-Sex spouse (%)
Household type by relationship - Opposite-Sex unmarried partner (%)
Household type by relationship - Same-Sex unmarried partner (%)
Household type by relationship - In group quarters (%)
Size of family households - 2-person household (%)
Size of family households - 3-person household (%)
Size of family households - 4-person household (%)
Size of family households - 5-person household (%)
Size of family households - 6-person household (%)
Size of family households - 7-or-more-person household (%)
Size of nonfamily households - 1-person household (%)
Size of nonfamily households - 2-person household (%)
Size of nonfamily households - 3-person household (%)
Size of nonfamily households - 4-person household (%)
Size of nonfamily households - 5-person household (%)
Size of nonfamily households - 6-person household (%)
Size of nonfamily households - 7-or-moreperson household (%)
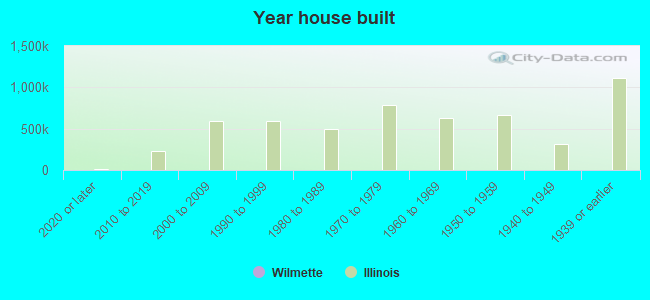
Year house built - Built 2010 or later (%)
Year house built - Built 2000 to 2009 (%)
Year house built - Built 1990 to 1999 (%)
Year house built - Built 1980 to 1989 (%)
Year house built - Built 1970 to 1979 (%)
Year house built - Built 1960 to 1969 (%)
Year house built - Built 1950 to 1959 (%)
Year house built - Built 1940 to 1949 (%)
Year house built - Built 1939 or earlier (%)
Median number of rooms in houses and condos
Median number of rooms in apartments
Median number of bedrooms in owner occupied houses
Mean number of bedrooms in owner occupied houses
Median number of bedrooms in renter occupied houses
Mean number of bedrooms in renter occupied houses
Median number of vehichles in owner occupied houses
Mean number of vehichles in owner occupied houses
Median number of vehichles in renter occupied houses
Mean number of vehichles in renter occupied houses
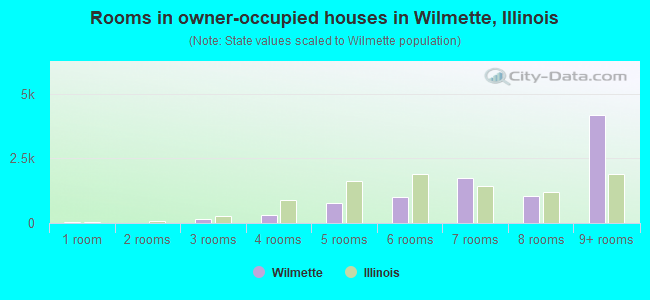
Rooms in owner-occupied houses - 1 room (%)
Rooms in owner-occupied houses - 2 rooms (%)
Rooms in owner-occupied houses - 3 rooms (%)
Rooms in owner-occupied houses - 4 rooms (%)
Rooms in owner-occupied houses - 5 rooms (%)
Rooms in owner-occupied houses - 6 rooms (%)
Rooms in owner-occupied houses - 7 rooms (%)
Rooms in owner-occupied houses - 8 rooms (%)
Rooms in owner-occupied houses - 9+ rooms (%)
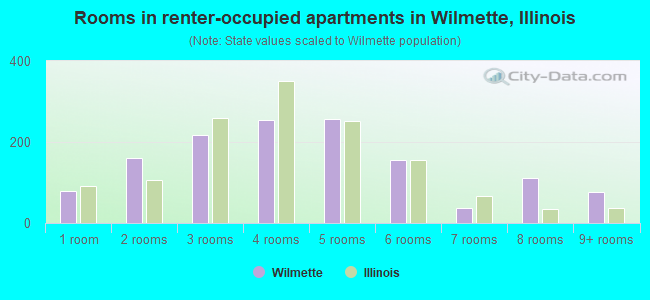
Rooms in renter-occupied houses - 1 room (%)
Rooms in renter-occupied houses - 2 rooms (%)
Rooms in renter-occupied houses - 3 rooms (%)
Rooms in renter-occupied houses - 4 rooms (%)
Rooms in renter-occupied houses - 5 rooms (%)
Rooms in renter-occupied houses - 6 rooms (%)
Rooms in renter-occupied houses - 7 rooms (%)
Rooms in renter-occupied houses - 8 rooms (%)
Rooms in renter-occupied houses - 9+ rooms (%)
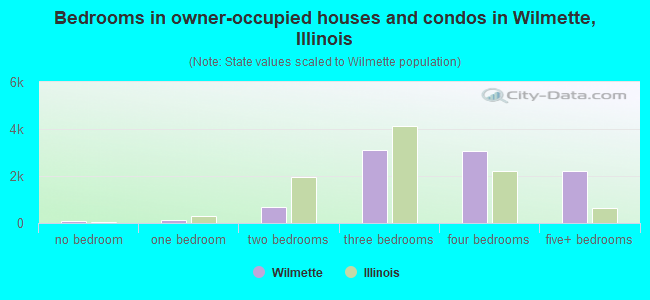
Bedrooms in owner-occupied houses - no bedrooms (%)
Bedrooms in owner-occupied houses - 1 bedroom (%)
Bedrooms in owner-occupied houses - 2 bedrooms (%)
Bedrooms in owner-occupied houses - 3 bedrooms (%)
Bedrooms in owner-occupied houses - 4 bedrooms (%)
Bedrooms in owner-occupied houses - 5+ bedrooms (%)
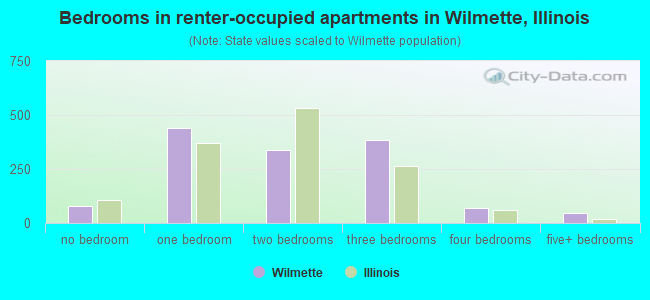
Bedrooms in renter-occupied houses - no bedrooms (%)
Bedrooms in renter-occupied houses - 1 bedroom (%)
Bedrooms in renter-occupied houses - 2 bedrooms (%)
Bedrooms in renter-occupied houses - 3 bedrooms (%)
Bedrooms in renter-occupied houses - 4 bedrooms (%)
Bedrooms in renter-occupied houses - 5+ bedrooms (%)
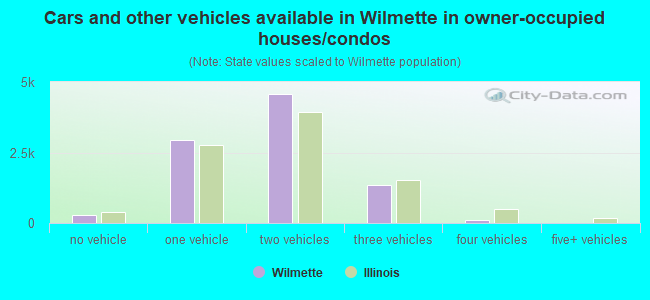
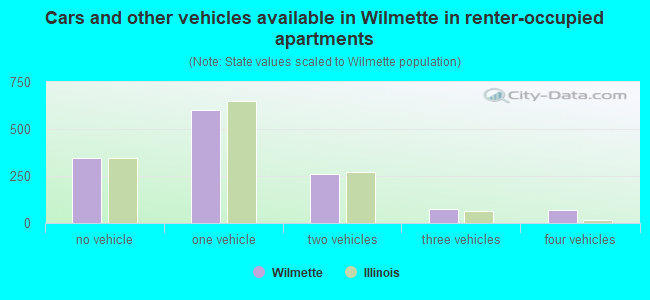
Vehicles available in owner-occupied houses - no vehicle available (%)
Vehicles available in owner-occupied houses - 1 vehicle available(%)
Vehicles available in owner-occupied houses - 2 Vehicles available (%)
Vehicles available in owner-occupied houses - 3 Vehicles available (%)
Vehicles available in owner-occupied houses - 4 Vehicles available (%)
Vehicles available in owner-occupied houses - 5+ Vehicles available (%)
Vehicles available in renter-occupied houses - no vehicle available (%)
Vehicles available in renter-occupied houses - 1 vehicle available (%)
Vehicles available in renter-occupied houses - 2 Vehicles available (%)
Vehicles available in renter-occupied houses - 3 Vehicles available (%)
Vehicles available in renter-occupied houses - 4 Vehicles available (%)
Vehicles available in renter-occupied houses - 5+ Vehicles available (%)
Housing units in structures - 1, detached (%)
Housing units in structures - 1, attached (%)
Housing units in structures - 2 (%)
Housing units in structures - 3 or 4 (%)
Housing units in structures - 5 to 9 (%)
Housing units in structures - 10 to 19 (%)
Housing units in structures - 20 to 49 (%)
Housing units in structures - 50 or more (%)
Housing units in structures - Mobile home (%)
Housing units in structures - Boat, RV, van, etc. (%)
Housing units in structures - Owners - 1, detached (%)
Housing units in structures - Owners - 1, attached (%)
Housing units in structures - Owners - 2 (%)
Housing units in structures - Owners - 3 or 4 (%)
Housing units in structures - Owners - 5 to 9 (%)
Housing units in structures - Owners - 10 to 19 (%)
Housing units in structures - Owners - 20 to 49 (%)
Housing units in structures - Owners - 50 or more (%)
Housing units in structures - Owners - Mobile home (%)
Housing units in structures - Owners - Boat, RV, van, etc. (%)
Housing units in structures - Renters - 1, detached (%)
Housing units in structures - Renters - 1, attached (%)
Housing units in structures - Renters - 2 (%)
Housing units in structures - Renters - 3 or 4 (%)
Housing units in structures - Renters - 5 to 9 (%)
Housing units in structures - Renters - 10 to 19 (%)
Housing units in structures - Renters - 20 to 49 (%)
Housing units in structures - Renters - 50 or more (%)
Housing units in structures - Renters - Mobile home (%)
Housing units in structures - Renters - Boat, RV, van, etc. (%)
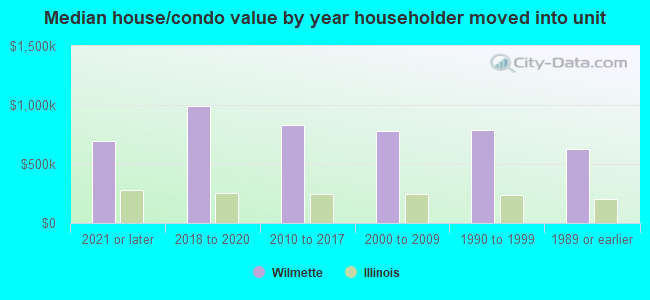
House/condo owner moved in on average (years ago)
Renter moved in on average (years ago)
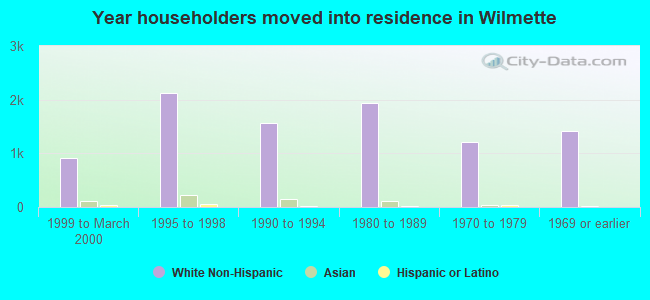
Year householder moved into unit - Moved in 1999 to March 2000 (%)
Year householder moved into unit - Moved in 1999 to March 2000 (%) - White
Year householder moved into unit - Moved in 1999 to March 2000 (%) - Black or African American
Year householder moved into unit - Moved in 1999 to March 2000 (%) - Asian
Year householder moved into unit - Moved in 1999 to March 2000 (%) - Hispanic or Latino
Year householder moved into unit - Moved in 1999 to March 2000 (%) - American Indian and Alaska Native
Year householder moved into unit - Moved in 1999 to March 2000 (%) - Multirace
Year householder moved into unit - Moved in 1999 to March 2000 (%) - Other Race
Year householder moved into unit - Moved in 1995 to 1998 (%)
Year householder moved into unit - Moved in 1995 to 1998 (%) - White
Year householder moved into unit - Moved in 1995 to 1998 (%) - Black or African American
Year householder moved into unit - Moved in 1995 to 1998 (%) - Asian
Year householder moved into unit - Moved in 1995 to 1998 (%) - Hispanic or Latino
Year householder moved into unit - Moved in 1995 to 1998 (%) - American Indian and Alaska Native
Year householder moved into unit - Moved in 1995 to 1998 (%) - Multirace
Year householder moved into unit - Moved in 1995 to 1998 (%) - Other Race
Year householder moved into unit - Moved in 1990 to 1994 (%)
Year householder moved into unit - Moved in 1990 to 1994 (%) - White
Year householder moved into unit - Moved in 1990 to 1994 (%) - Black or African American
Year householder moved into unit - Moved in 1990 to 1994 (%) - Asian
Year householder moved into unit - Moved in 1990 to 1994 (%) - Hispanic or Latino
Year householder moved into unit - Moved in 1990 to 1994 (%) - American Indian and Alaska Native
Year householder moved into unit - Moved in 1990 to 1994 (%) - Multirace
Year householder moved into unit - Moved in 1990 to 1994 (%) - Other Race
Year householder moved into unit - Moved in 1980 to 1989 (%)
Year householder moved into unit - Moved in 1980 to 1989 (%) - White
Year householder moved into unit - Moved in 1980 to 1989 (%) - Black or African American
Year householder moved into unit - Moved in 1980 to 1989 (%) - Asian
Year householder moved into unit - Moved in 1980 to 1989 (%) - Hispanic or Latino
Year householder moved into unit - Moved in 1980 to 1989 (%) - American Indian and Alaska Native
Year householder moved into unit - Moved in 1980 to 1989 (%) - Multirace
Year householder moved into unit - Moved in 1980 to 1989 (%) - Other Race
Year householder moved into unit - Moved in 1970 to 1979 (%)
Year householder moved into unit - Moved in 1970 to 1979 (%) - White
Year householder moved into unit - Moved in 1970 to 1979 (%) - Black or African American
Year householder moved into unit - Moved in 1970 to 1979 (%) - Asian
Year householder moved into unit - Moved in 1970 to 1979 (%) - Hispanic or Latino
Year householder moved into unit - Moved in 1970 to 1979 (%) - American Indian and Alaska Native
Year householder moved into unit - Moved in 1970 to 1979 (%) - Multirace
Year householder moved into unit - Moved in 1970 to 1979 (%) - Other Race
Year householder moved into unit - Moved in 1969 or earlier (%)
Year householder moved into unit - Moved in 1969 or earlier (%) - White
Year householder moved into unit - Moved in 1969 or earlier (%) - Black or African American
Year householder moved into unit - Moved in 1969 or earlier (%) - Asian
Year householder moved into unit - Moved in 1969 or earlier (%) - Hispanic or Latino
Year householder moved into unit - Moved in 1969 or earlier (%) - American Indian and Alaska Native
Year householder moved into unit - Moved in 1969 or earlier (%) - Multirace
Year householder moved into unit - Moved in 1969 or earlier (%) - Other Race
Housing units lacking complete plumbing facilities (%)
Housing units lacking complete kitchen facilities (%)
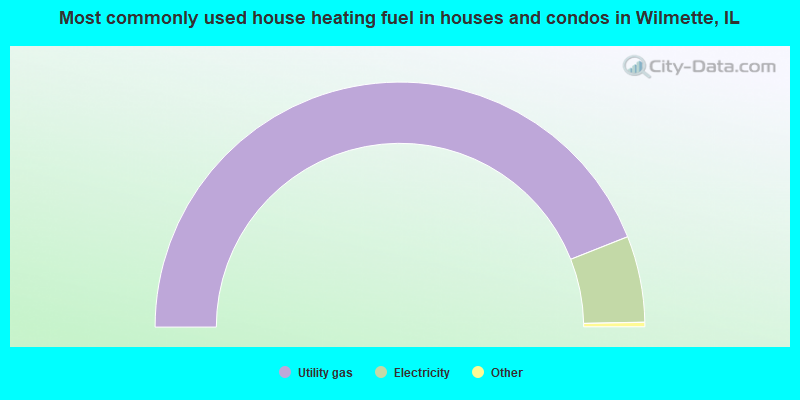
House heating fuel used in houses and condos - Utility gas (%)
House heating fuel used in houses and condos - Bottled, tank, or LP gas (%)
House heating fuel used in houses and condos - Electricity (%)
House heating fuel used in houses and condos - Fuel oil, kerosene, etc. (%)
House heating fuel used in houses and condos - Coal or coke (%)
House heating fuel used in houses and condos - Wood (%)
House heating fuel used in houses and condos - Solar energy (%)
House heating fuel used in houses and condos - Other fuel (%)
House heating fuel used in houses and condos - No fuel used (%)
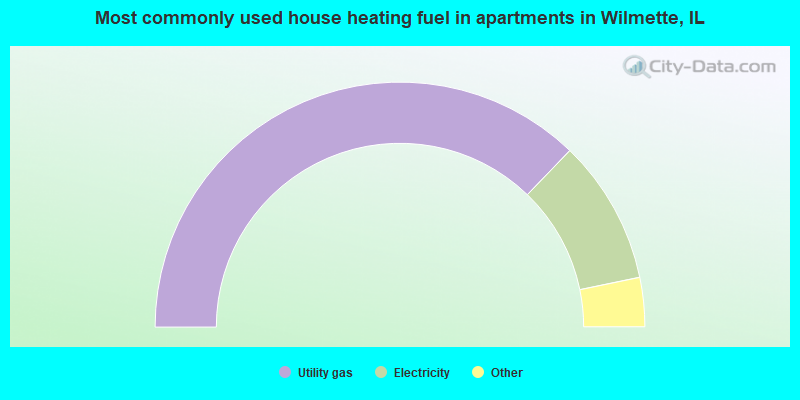
House heating fuel used in apartments - Utility gas (%)
House heating fuel used in apartments - Bottled, tank, or LP gas (%)
House heating fuel used in apartments - Electricity (%)
House heating fuel used in apartments - Fuel oil, kerosene, etc. (%)
House heating fuel used in apartments - Coal or coke (%)
House heating fuel used in apartments - Wood (%)
House heating fuel used in apartments - Solar energy (%)
House heating fuel used in apartments - Other fuel (%)
House heating fuel used in apartments - No fuel used (%)
Latest news about housing in Wilmette, IL collected exclusively by city-data.com from local newspapers, TV, and radio stations
Median year house/condo built: 1955Median year apartment built: 1962Household type by relationship:
Households: 27,183
Male householders: 5,572 (873 living alone ), Female householders: 4,594 (1,685 living alone )6,732 spouses (6,709 opposite-sex spouses ), 152 unmarried partners , (152 opposite-sex unmarried partners ), 9,491 children (9,214 natural , 126 adopted , 150 stepchildren ), 91 grandchildren , 50 brothers or sisters , 130 parents , 7 foster children , 134 other relatives , 116 non-relatives In group quarters: 108
Size of family households: 2,973 2-persons , 1,558 3-persons , 2,073 4-persons , 822 5-persons , 143 6-persons , 39 7-or-more-persons .
Size of nonfamily households: 2,748 1-person , 155 2-persons , 6 3-persons , 6 4-persons .
6,747 married couples with children. single-parent households (282 men , 335 women ).
80.8% of residents of Wilmette speak English at home. of residents speak Spanish at home (95% speak English very well , 2% speak English well , 3% speak English not well ).of residents speak other Indo-European language at home (79% speak English very well , 15% speak English well , 6% speak English not well ).of residents speak Asian or Pacific Island language at home (55% speak English very well , 35% speak English well , 6% speak English not well , 4% don't speak English at all ).of residents speak other language at home (100% speak English very well ).
Foreign born population: 4,221 (15.5%)of them are naturalized citizens )
Median number of rooms in houses and condos:
Median number of rooms in apartments
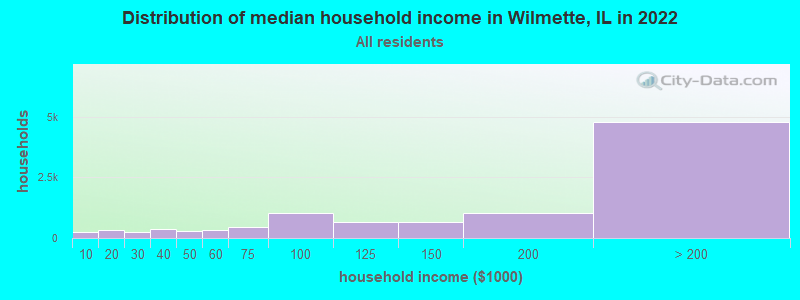
Wilmette, IL household income distribution 228 Less than $10,000333 $10,000 to $19,999246 $20,000 to $29,999385 $30,000 to $39,999279 $40,000 to $49,999347 $50,000 to $59,999439 $60,000 to $74,9991,028 $75,000 to $99,999671 $100,000 to $124,999665 $125,000 to $149,9991,033 $150,000 to $199,9994,779 $200,000 or more
Home value of owner - occupied houses in 2022 in Wilmette, IL 61 Less than $10,00021 $30,000 to $34,9996 $50,000 to $59,99922 $60,000 to $69,9999 $80,000 to $89,9998 $90,000 to $99,999109 $150,000 to $174,99944 $175,000 to $199,99998 $200,000 to $249,999184 $250,000 to $299,999923 $300,000 to $399,999799 $400,000 to $499,9992,334 $500,000 to $749,9991,962 $750,000 to $999,9991,716 $1,000,000 to $1,499,999416 $1,500,000 to $1,999,999471 $2,000,000 or moreRent paid by renters in 2022 in Wilmette, IL 33 $100 to $14911 $150 to $19933 $200 to $2498 $300 to $34946 $350 to $39920 $500 to $54923 $800 to $89910 $900 to $999166 $1,000 to $1,249210 $1,250 to $1,499174 $1,500 to $1,99990 $2,000 to $2,499184 $2,500 to $2,99937 $3,000 to $3,499200 $3,500 or more117 No cash rent
Percentage of workers working in this county: 91.3%Number of people working at home: 4,763 (39.6% of all workers )
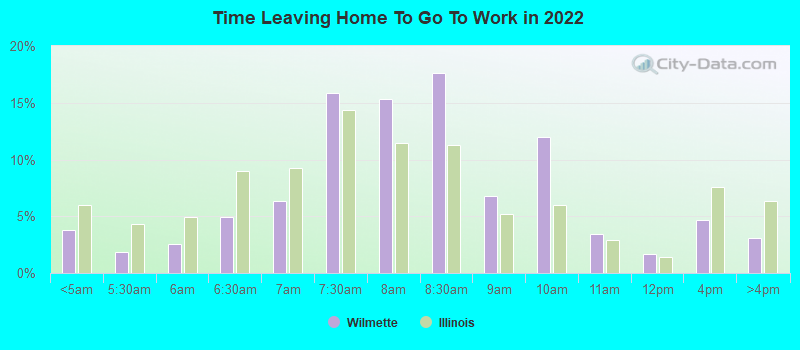
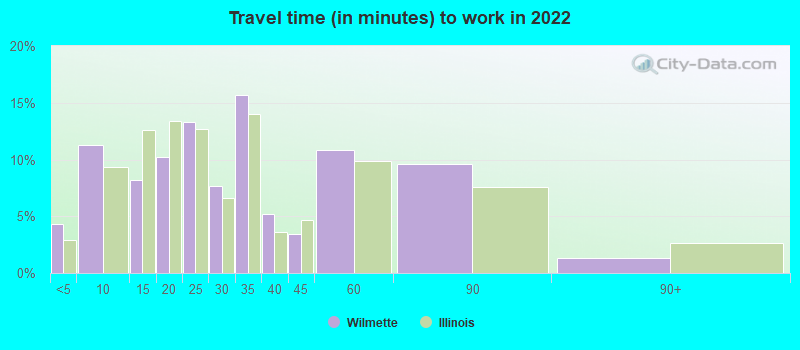
Travel time to work (commute)
Less than 5 minutes: 2225 to 9 minutes: 88410 to 14 minutes: 86415 to 19 minutes: 73120 to 24 minutes: 55525 to 29 minutes: 30930 to 34 minutes: 1,00835 to 39 minutes: 32840 to 44 minutes: 46045 to 59 minutes: 1,18260 to 89 minutes: 1,14390 or more minutes: 324
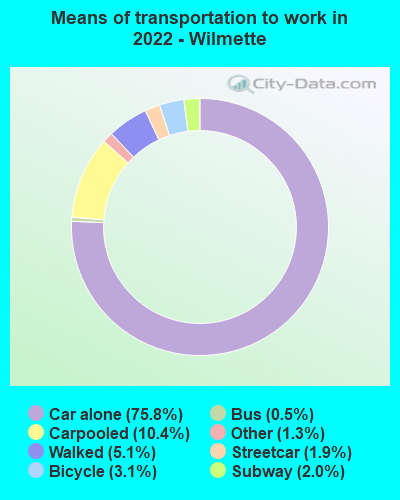
Means of transportation to work:
Drove a car alone: 4,805 (47.9%)Carpooled: 702 (7.0%)Bus : 31 (0.3%)Subway or elevated rail : 90 (0.9%)Long-distance train or commuter rail : 87 (0.9%)Taxi: 81 (0.8%)Bicycle: 208 (2.1%)Walked: 330 (3.3%)Worked at home: 4,763 (47.5%)
Unemployment by race in 2022
Unemployment rate for White non-Hispanic residents 2.1% Males4.7% FemalesUnemployment rate for Asian residents 3.4% Males2.0% FemalesUnemployment rate for two or more race residents 6.4% FemalesUnemployment rate for Hispanic or Latino residents 10.1% Females
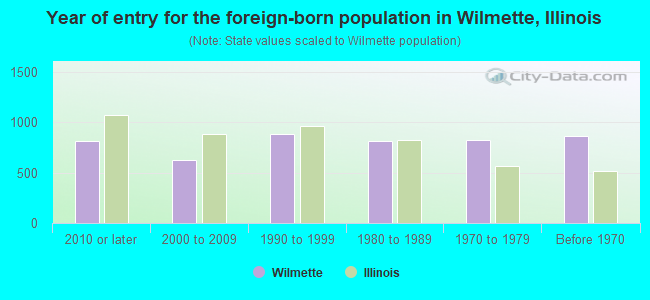
Year of entry for the foreign-born population in Wilmette, Illinois
813 2010 or later 626 2000 to 2009 885 1990 to 1999 814 1980 to 1989 819 1970 to 1979 857 Before 1970
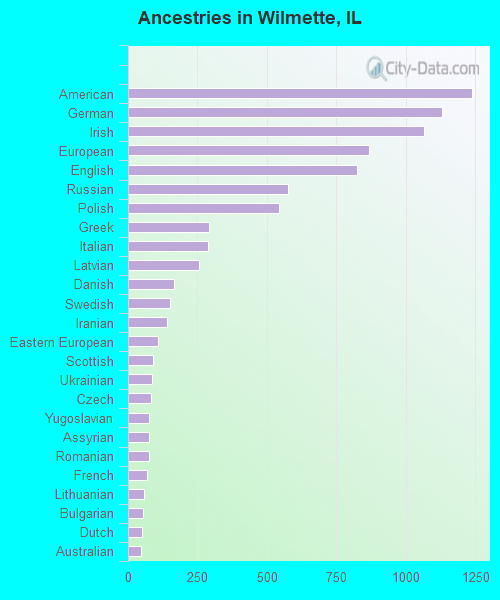
First ancestries reported:
American: 1,237 (9.8%)
German: 1,130 (9.0%)
Irish: 1,065 (8.5%)
European: 866 (6.9%)
English: 825 (6.5%)
Russian: 574 (4.6%)
Polish: 542 (4.3%)
Greek: 293 (2.3%)
Italian: 288 (2.3%)
Latvian: 256 (2.0%)
Danish: 164 (1.3%)
Swedish: 152 (1.2%)
Iranian: 141 (1.1%)
Eastern European: 107 (0.8%)
Scottish: 91 (0.7%)
Ukrainian: 87 (0.7%)
Czech: 84 (0.7%)
Yugoslavian: 76 (0.6%)
Assyrian: 75 (0.6%)
Romanian: 74 (0.6%)
French: 67 (0.5%)
Lithuanian: 59 (0.5%)
Bulgarian: 55 (0.4%)
Dutch: 50 (0.4%)
Australian: 45 (0.4%)
Serbian: 42 (0.3%)
Syrian: 39 (0.3%)
Welsh: 39 (0.3%)
Canadian: 38 (0.3%)
Turkish: 38 (0.3%)
British: 36 (0.3%)
Afghan: 31 (0.2%)
French Canadian: 30 (0.2%)
Northern European: 29 (0.2%)
Croatian: 24 (0.2%)
Hungarian: 22 (0.2%)
Slovak: 22 (0.2%)
Belgian: 20 (0.2%)
Swiss: 19 (0.2%)
Scotch-Irish: 19 (0.2%)
Lebanese: 18 (0.1%)
Scandinavian: 13 (0.1%)
Albanian: 12 (0.10%)
Armenian: 12 (0.10%)
Israeli: 12 (0.10%)
Haitian: 11 (0.09%)
Slovene: 10 (0.08%)
Iraqi: 8 (0.06%)
Austrian: 8 (0.06%)
Norwegian: 7 (0.06%)
Slavic: 7 (0.06%)
Finnish: 6 (0.05%)
Egyptian: 5 (0.04%)
Macedonian: 1 (0.01%)
Most common places of birth for foreign-born residents (%): China, excluding Hong Kong and Taiwan Wilmette:
13.3% (563)Illinois:
4.1% (74,364)
Korea Wilmette:
9.8% (413)Illinois:
2.2% (40,393)
Taiwan Wilmette:
9.2% (390)Illinois:
0.5% (8,235)
Poland Wilmette:
5.0% (209)Illinois:
6.9% (124,474)
Philippines Wilmette:
4.8% (204)Illinois:
5.2% (93,003)
Canada Wilmette:
4.0% (168)Illinois:
1.1% (19,306)
Ukraine Wilmette:
3.8% (162)Illinois:
1.6% (29,316)
Russia Wilmette:
3.6% (153)Illinois:
0.9% (16,308)
India Wilmette:
3.3% (139)Illinois:
9.2% (166,409)
Latvia Wilmette:
3.2% (135)Illinois:
0.1% (1,568)
Iran Wilmette:
3.0% (128)Illinois:
0.4% (6,922)
Bangladesh Wilmette:
2.5% (106)Illinois:
0.2% (2,731)
Pakistan Wilmette:
2.3% (96)Illinois:
1.6% (29,519)
France Wilmette:
2.0% (84)Illinois:
0.3% (5,895)
Germany Wilmette:
1.8% (75)Illinois:
1.0% (18,753)
Mexico Wilmette:
1.7% (73)Illinois:
34.7% (626,958)
Colombia Wilmette:
1.6% (68)Illinois:
0.9% (16,553)
Romania Wilmette:
1.6% (67)Illinois:
0.8% (14,736)
Place of birth for U.S.-born residents:
This state: 14,865Other state: 7,731Northeast: 2,271Midwest: 3,441South: 1,189West: 937 89.8% of Wilmette residents lived in the same house 1 years ago.
Out of people who lived in different houses, 41.6% lived in this county.
Out of people who lived in different counties, 38.9% lived in Illinois.
Wilmette:
89.8%State average:
88.3%
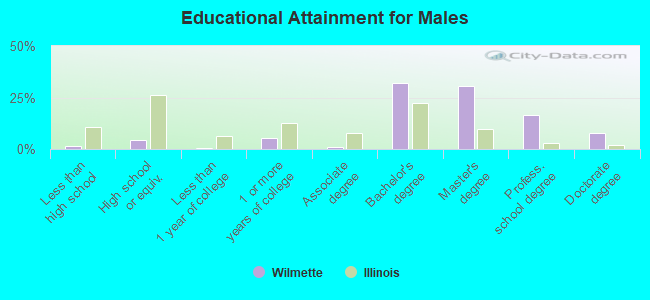
Education attainment for males 25 years and older:
No schooling: 9Nursery to 4th grade: 05th and 6th grade: 07th and 8th grade: 119th grade: 1110th grade: 1011th grade: 3612th grade, no diploma: 54High school graduate (or equivalency): 380Less than 1 year of college: 50Some college more than 1 year, no degree: 460Associate degree: 103Bachelor's degree: 2,842Master's degree: 2,698Professional school degree: 1,447Doctorate degree: 693
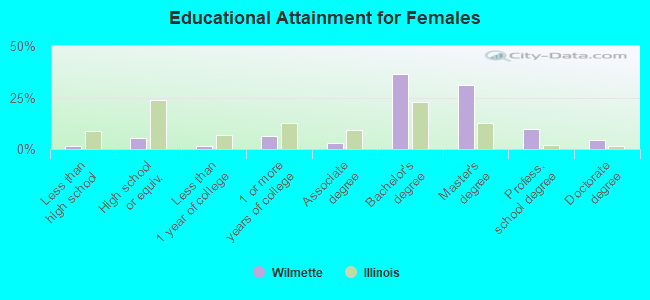
Education attainment for females 25 years and older:
No schooling: 54Nursery to 4th grade: 95th and 6th grade: 57th and 8th grade: 59th grade: 010th grade: 511th grade: 3012th grade, no diploma: 52High school graduate (or equivalency): 544Less than 1 year of college: 158Some college more than 1 year, no degree: 635Associate degree: 297Bachelor's degree: 3,557Master's degree: 3,049Professional school degree: 934Doctorate degree: 432
Housing units in structures:
One, detached: 8,490One, attached: 503Two: 153 or 4: 1255 to 9: 15210 to 19: 16620 to 49: 50150 or more: 869Mobile homes: 11Housing units lacking complete plumbing facilities in 2022: 0.1%Housing units lacking complete kitchen facilities in 2022: 0.4%House/condo owner moved in on average 13 years ago
Renter moved in on average 3 years ago
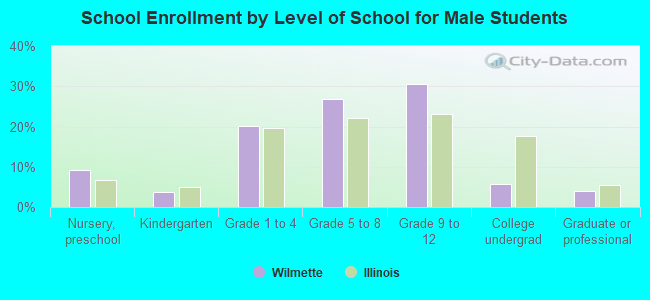
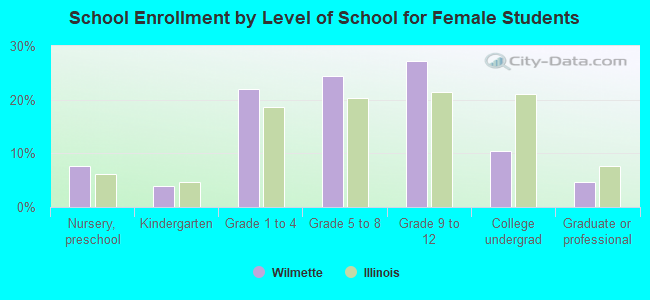
Private vs. public school enrollment:
Students in private schools in grades 1 to 8 (elementary and middle school): 561 Students in private schools in grades 9 to 12 (high school): 256 Students in private undergraduate colleges: 272