Winter Haven, FL (Florida) Houses and Residents
| Winter Haven: | $273,825 |
| Florida: | $354,100 |
Mean price in 2022:
Detached houses: $289,671
Here: $289,671 State: $500,941 Townhouses or other attached units: $192,397
Here: $192,397 State: $370,869 In 2-unit structures: $89,927
Here: $89,927 State: $423,188 In 3-to-4-unit structures: $111,022
Here: $111,022 State: $309,944 In 5-or-more-unit structures: $103,901
Here: $103,901 State: $447,145 Mobile homes: $110,610
Here: $110,610 State: $113,202
Total population: 36,371 (Urban population: 25,508, Rural population: 436 (all nonfarm))
Houses: 23,618 (19,956 occupied: 13,057 owner occupied, 7,659 renter occupied)
| % of renters here: | 37% |
| State: | 33% |
Housing density: 1,336 houses/condos per square mile
Median price asked for vacant for-sale houses and condos in 2022: $291,834.
Median contract rent in 2022: $949 (lower quartile is $775, upper quartile is $1,284)
Median rent asked for vacant for-rent units in 2022: $967
Median gross rent in Winter Haven, FL in 2022: $1,126
Housing units in Winter Haven with a mortgage: 8,232 (711 second mortgage, 36 home equity loan, 478 both second mortgage and home equity loan)
Houses without a mortgage: 137
Median household income for houses/condos with a mortgage: $74,546
Median household income for apartments without a mortgage: $58,632
Median monthly housing costs: $1,161
Compare current foreclosures in Winter Haven, FL:
| Photo | Address | Area | Beds / Baths | Price | Details |
|---|---|---|---|---|---|

|
#1
Meadow Ln NE
Winter Haven, FL 33881
|
1,392 sq. feet
|
2 baths 3 beds |
$389,950
|
show details |

|
#2
Galloway Ter
Winter Haven, FL 33881
|
1,507 sq. feet
|
2 baths 3 beds |
show details | |

|
#3
Lake Region Blvd S
Winter Haven, FL 33881
|
1,637 sq. feet
|
2 baths 4 beds |
show details | |

|
#4
High St
Winter Haven, FL 33880
|
1,396 sq. feet
|
2 baths 3 beds |
show details | |

|
#5
Kings Pond Ave
Winter Haven, FL 33880
|
990 sq. feet
|
2 baths 2 beds |
show details | |

|
#6
Whispering Trails Blvd
Winter Haven, FL 33884
|
2,203 sq. feet
|
3 baths 4 beds |
show details | |

|
#7
Lake Thomas Dr
Winter Haven, FL 33880
|
1,556 sq. feet
|
2 baths 4 beds |
show details | |

|
#8
Lake Dexter Blvd
Winter Haven, FL 33884
|
1,131 sq. feet
|
2 baths 2 beds |
show details | |

|
#9
Lake Eloise Pointe Dr
Winter Haven, FL 33880
|
1,645 sq. feet
|
2 baths 3 beds |
show details | |

|
#10
Tyler Rd
Winter Haven, FL 33884
|
1,343 sq. feet
|
2 baths 3 beds |
show details |
| Photo | Address | Area | Beds / Baths | Price | Details |
|---|---|---|---|---|---|

|
#11
Hurst Rd
Winter Haven, FL 33880
|
1,332 sq. feet
|
2 baths 3 beds |
show details | |

|
#12
Whispering Trails St
Winter Haven, FL 33884
|
1,303 sq. feet
|
2 baths 3 beds |
show details | |

|
#13
Avenue B NW
Winter Haven, FL 33880
|
1,037 sq. feet
|
1 baths 3 beds |
show details | |

|
#14
Greenleaf Blvd
Winter Haven, FL 33884
|
1,617 sq. feet
|
2 baths 3 beds |
show details | |

|
#15
Killearn Blvd
Winter Haven, FL 33880
|
1,321 sq. feet
|
2 baths 3 beds |
show details | |

|
#16
Fish Hawk Dr
Winter Haven, FL 33884
|
3,920 sq. feet
|
4 baths 5 beds |
show details | |

|
#17
Whispering Trails Pl
Winter Haven, FL 33884
|
1,303 sq. feet
|
2 baths 3 beds |
show details | |

|
#18
Mandolin Ct
Winter Haven, FL 33884
|
2,855 sq. feet
|
3 baths 5 beds |
show details | |

|
#19
Dayton Dr
Winter Haven, FL 33884
|
2,109 sq. feet
|
2 baths 3 beds |
show details | |

|
#20
Terranova St
Winter Haven, FL 33884
|
2,178 sq. feet
|
2 baths 4 beds |
show details |
| Photo | Address | Area | Beds / Baths | Price | Details |
|---|---|---|---|---|---|

|
#21
Edgewater Cir
Winter Haven, FL 33880
|
2,067 sq. feet
|
3 baths 2 beds |
show details | |

|
#22
Lake Ned Rd
Winter Haven, FL 33884
|
1,993 sq. feet
|
2 baths 3 beds |
show details | |

|
#23
Gretna Ln
Winter Haven, FL 33880
|
1,250 sq. feet
|
2 baths 3 beds |
show details | |

|
#24
Lake Daisy Dr
Winter Haven, FL 33884
|
2,492 sq. feet
|
2 baths 3 beds |
show details | |

|
#25
Haines Trl
Winter Haven, FL 33881
|
1,844 sq. feet
|
2 baths 3 beds |
show details | |

|
#26
Nottingham SW
Winter Haven, FL 33880
|
1,504 sq. feet
|
2 baths 3 beds |
show details | |

|
#27
Varner Dr SW
Winter Haven, FL 33880
|
1,008 sq. feet
|
2 baths 3 beds |
show details | |

|
#28
Majesty Loop
Winter Haven, FL 33880
|
1,251 sq. feet
|
2 baths 3 beds |
show details | |

|
#29
7th Jpv St
Winter Haven, FL 33880
|
1,674 sq. feet
|
2 baths 3 beds |
show details | |

|
#30
Sand Ln
Winter Haven, FL 33880
|
1,057 sq. feet
|
1 baths 3 beds |
show details |
| Photo | Address | Area | Beds / Baths | Price | Details |
|---|---|---|---|---|---|

|
#31
Mandolin Ct
Winter Haven, FL 33884
|
2,055 sq. feet
|
2 baths 3 beds |
show details | |

|
#32
Homewood Ct
Winter Haven, FL 33880
|
2,512 sq. feet
|
2 baths 3 beds |
show details | |

|
#33
Reddicks Cir
Winter Haven, FL 33884
|
2,020 sq. feet
|
2 baths 3 beds |
show details | |

|
#34
Live Oak Dr
Winter Haven, FL 33880
|
1,905 sq. feet
|
2 baths 3 beds |
show details | |

|
#35
Reflections Loop E
Winter Haven, FL 33884
|
2,054 sq. feet
|
2 baths 3 beds |
show details | |

|
#36
Sand Pine Trl
Winter Haven, FL 33880
|
1,012 sq. feet
|
2 baths 2 beds |
show details | |

|
#37
Nicklaus Dr
Winter Haven, FL 33884
|
1,332 sq. feet
|
2 baths 2 beds |
show details | |

|
#38
Raleigh Dr
Winter Haven, FL 33884
|
1,719 sq. feet
|
2 baths 2 beds |
show details | |

|
#39
Berkshire Dr
Winter Haven, FL 33884
|
2,841 sq. feet
|
3 baths 3 beds |
show details | |

|
#40
Meadow Dr NE
Winter Haven, FL 33881
|
2,094 sq. feet
|
2 baths 3 beds |
show details |
| Photo | Address | Area | Beds / Baths | Price | Details |
|---|---|---|---|---|---|

|
#41
Talamone Dr
Winter Haven, FL 33884
|
2,546 sq. feet
|
3 baths 4 beds |
show details | |

|
#42
Adriel Ave
Winter Haven, FL 33880
|
1,268 sq. feet
|
2 baths 3 beds |
show details | |

|
#43
Lake Daisy Cir
Winter Haven, FL 33884
|
1,774 sq. feet
|
2 baths 3 beds |
show details | |

|
#44
Avenue C SW
Winter Haven, FL 33880
|
900 sq. feet
|
1 baths - beds |
show details | |

|
#45
E Lake Hartridge Dr
Winter Haven, FL 33881
|
1,839 sq. feet
|
2 baths - beds |
show details | |

|
#46
21st St NW
Winter Haven, FL 33881
|
2,292 sq. feet
|
4 baths - beds |
show details | |

|
#47
3rd St NW
Winter Haven, FL 33881
|
864 sq. feet
|
1 baths - beds |
show details | |

|
#48
Avenue F SE
Winter Haven, FL 33880
|
1,404 sq. feet
|
1 baths - beds |
show details | |

|
#49
4th St NW
Winter Haven, FL 33881
|
912 sq. feet
|
1 baths - beds |
show details | |

|
Check over 1 million property listings on Foreclosure.com!
|
browse all offers | |||


Median year apartment built: 1980
Household type by relationship:
Households: 54,307- Male householders: 8,916 (2,186 living alone), Female householders: 11,127 (3,304 living alone)
8,943 spouses (8,674 opposite-sex spouses), 1,572 unmarried partners, (1,549 opposite-sex unmarried partners), 15,132 children (14,189 natural, 385 adopted, 558 stepchildren), 1,368 grandchildren, 1,103 brothers or sisters, 1,602 parents, 0 foster children, 2,372 other relatives, 1,326 non-relatives
- In group quarters: 842
Size of family households: 6,416 2-persons, 2,681 3-persons, 1,940 4-persons, 1,281 5-persons, 706 6-persons, 496 7-or-more-persons.
Size of nonfamily households: 5,966 1-person, 1,100 2-persons, 32 3-persons, 157 4-persons.
6,200 married couples with children.
3,631 single-parent households (698 men, 2,933 women).
73.7% of residents of Winter Haven speak English at home.
17.9% of residents speak Spanish at home (54% speak English very well, 22% speak English well, 21% speak English not well, 3% don't speak English at all).
6.5% of residents speak other Indo-European language at home (66% speak English very well, 10% speak English well, 20% speak English not well, 5% don't speak English at all).
1.0% of residents speak Asian or Pacific Island language at home (62% speak English very well, 20% speak English well, 18% speak English not well).
0.7% of residents speak other language at home (100% speak English very well).
Foreign born population: 5,651 (10.4%)
(46.5% of them are naturalized citizens)
| Here: | 6.1 |
| State: | 5.9 |
| Here: | 4.6 |
| State: | 4.2 |

- Bedrooms in owner-occupied houses and condos in Winter Haven, Florida
- 12no bedroom
- 2011 bedroom
- 3,6042 bedrooms
- 5,5723 bedrooms
- 3,3464 bedrooms
- 3225+ bedrooms

- Bedrooms in renter-occupied apartments in Winter Haven, Florida
- 265no bedroom
- 1,6921 bedroom
- 3,1992 bedrooms
- 1,9503 bedrooms
- 4814 bedrooms
- 725+ bedrooms

- Cars and other vehicles available in Winter Haven in owner-occupied houses/condos
- 354no vehicle
- 4,8121 vehicle
- 5,5392 vehicles
- 1,6133 vehicles
- 5304 vehicles
- 2105+ vehicles

- Cars and other vehicles available in Winter Haven in renter-occupied apartments
- 1,411no vehicle
- 3,6571 vehicle
- 2,0932 vehicles
- 4063 vehicles
- 944 vehicles
- 05+ vehicles

- Rooms in owner-occupied houses in Winter Haven, Florida
- 121 room
- 302 rooms
- 2693 rooms
- 1,3954 rooms
- 3,1135 rooms
- 3,5986 rooms
- 2,1287 rooms
- 1,2768 rooms
- 1,2379+ rooms

- Rooms in renter-occupied apartments in Winter Haven, Florida
- 2191 room
- 2142 rooms
- 9403 rooms
- 1,8834 rooms
- 2,6075 rooms
- 1,3926 rooms
- 1957 rooms
- 948 rooms
- 1179+ rooms


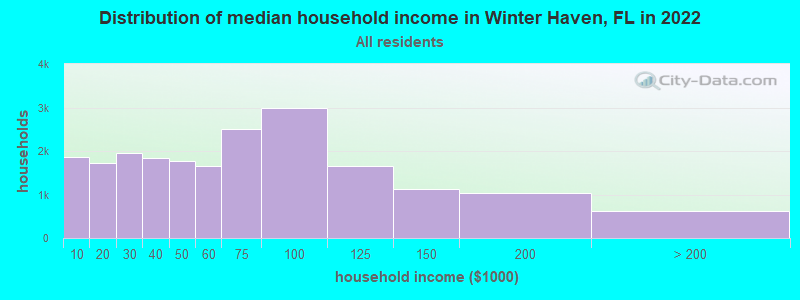
Winter Haven, FL household income distribution

- 1,867Less than $10,000
- 1,719$10,000 to $19,999
- 1,960$20,000 to $29,999
- 1,836$30,000 to $39,999
- 1,772$40,000 to $49,999
- 1,663$50,000 to $59,999
- 2,517$60,000 to $74,999
- 2,984$75,000 to $99,999
- 1,650$100,000 to $124,999
- 1,123$125,000 to $149,999
- 1,044$150,000 to $199,999
- 625$200,000 or more
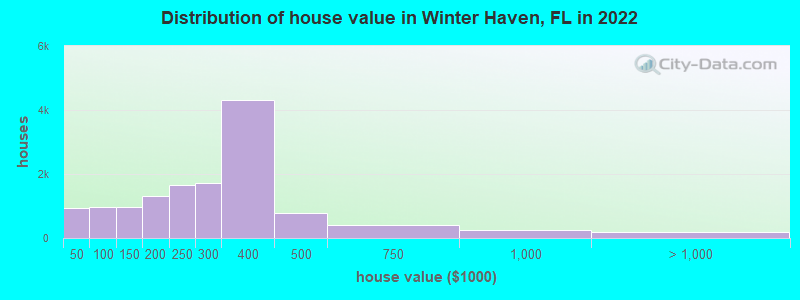
Home value of owner - occupied houses in 2022 in Winter Haven, FL
-
- 206Less than $10,000
- 97$10,000 to $14,999
- 79$15,000 to $19,999
- 67$20,000 to $24,999
- 108$25,000 to $29,999
- 150$30,000 to $34,999
- 100$35,000 to $39,999
- 112$40,000 to $49,999
- 170$50,000 to $59,999
- 51$60,000 to $69,999
- 139$70,000 to $79,999
- 90$80,000 to $89,999
- 419$90,000 to $99,999
- 602$100,000 to $124,999
- 366$125,000 to $149,999
- 685$150,000 to $174,999
- 627$175,000 to $199,999
- 1,660$200,000 to $249,999
- 1,726$250,000 to $299,999
- 4,298$300,000 to $399,999
- 770$400,000 to $499,999
- 406$500,000 to $749,999
- 247$750,000 to $999,999
- 77$1,000,000 to $1,499,999
- 80$1,500,000 to $1,999,999
- 15$2,000,000 or more
Rent paid by renters in 2022 in Winter Haven, FL
-
- 41$100 to $149
- 44$150 to $199
- 60$200 to $249
- 143$250 to $299
- 109$300 to $349
- 111$350 to $399
- 35$400 to $449
- 79$450 to $499
- 72$500 to $549
- 161$550 to $599
- 322$600 to $649
- 77$650 to $699
- 527$700 to $749
- 85$750 to $799
- 1,281$800 to $899
- 430$900 to $999
- 1,445$1,000 to $1,249
- 950$1,250 to $1,499
- 724$1,500 to $1,999
- 121$2,000 to $2,499
- 21$2,500 to $2,999
- 461No cash rent


Percentage of workers working in this county: 86.0%
Number of people working at home: 2,731 (11.7% of all workers)
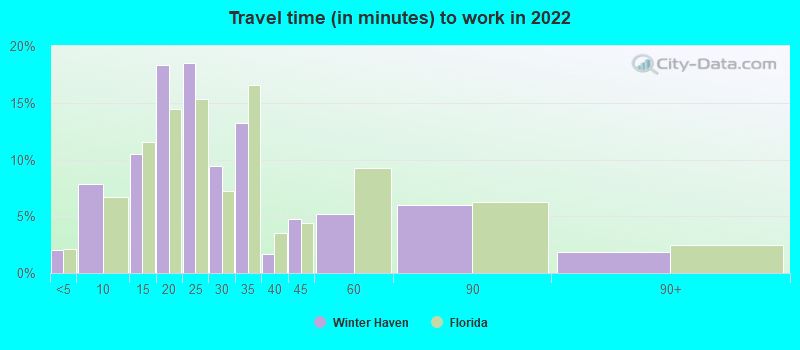
Travel time to work (commute)
- Less than 5 minutes: 531
- 5 to 9 minutes: 2,275
- 10 to 14 minutes: 1,491
- 15 to 19 minutes: 3,486
- 20 to 24 minutes: 3,089
- 25 to 29 minutes: 1,300
- 30 to 34 minutes: 2,296
- 35 to 39 minutes: 674
- 40 to 44 minutes: 1,270
- 45 to 59 minutes: 1,839
- 60 to 89 minutes: 1,466
- 90 or more minutes: 698
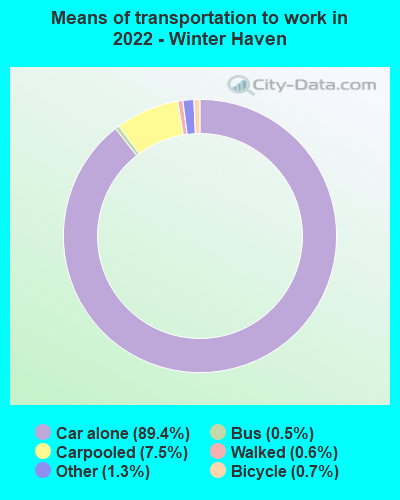
Means of transportation to work:
- Drove a car alone: 29,441 (81.7%)
- Carpooled: 2,094 (5.8%)
- Bus: 70 (0.2%)
- Ferryboat: 12 (0.0%)
- Taxi: 465 (1.3%)
- Bicycle: 293 (0.8%)
- Walked: 254 (0.7%)
- Worked at home: 2,731 (7.6%)

- Unemployment by race in 2022
- Unemployment rate for White non-Hispanic residents
- 1.2%Males
- 2.4%Females
- Unemployment rate for Black residents
- 3.7%Males
- 4.3%Females
- Unemployment rate for Asian residents
- 14.1%Males
- 3.9%Females
- Unemployment rate for other race residents
- 9.0%Females
- Unemployment rate for two or more race residents
- 2.7%Males
- 17.9%Females
- Unemployment rate for Hispanic or Latino residents
- 1.9%Males
- 13.0%Females

- Year of entry for the foreign-born population in Winter Haven, Florida
- 2,7912010 or later
- 1,1112000 to 2009
- 7321990 to 1999
- 4311980 to 1989
- 1681970 to 1979
- 324Before 1970
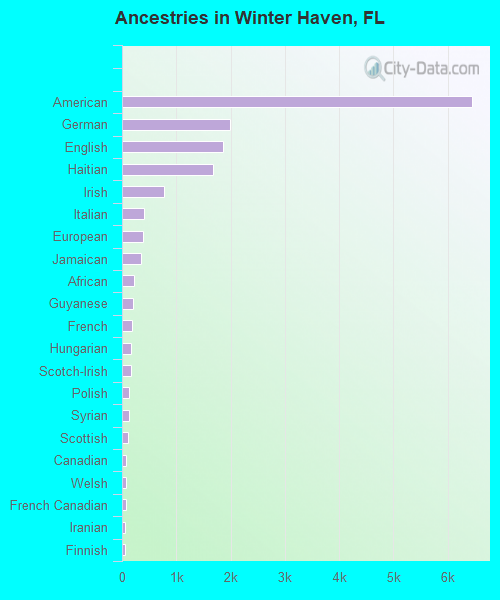
First ancestries reported:
- American: 6,437 (21.2%)
- German: 1,993 (6.6%)
- English: 1,867 (6.1%)
- Haitian: 1,670 (5.5%)
- Irish: 782 (2.6%)
- Italian: 397 (1.3%)
- European: 389 (1.3%)
- Jamaican: 344 (1.1%)
- African: 216 (0.7%)
- Guyanese: 194 (0.6%)
- French: 175 (0.6%)
- Hungarian: 168 (0.6%)
- Scotch-Irish: 165 (0.5%)
- Polish: 133 (0.4%)
- Syrian: 121 (0.4%)
- Scottish: 114 (0.4%)
- Canadian: 77 (0.3%)
- Welsh: 72 (0.2%)
- French Canadian: 67 (0.2%)
- Iranian: 61 (0.2%)
- Finnish: 59 (0.2%)
- Czech: 48 (0.2%)
- Eastern European: 48 (0.2%)
- Swedish: 47 (0.2%)
- Norwegian: 46 (0.2%)
- West Indian: 44 (0.1%)
- Trinidadian and Tobagonian: 41 (0.1%)
- Dutch: 40 (0.1%)
- Czechoslovakian: 35 (0.1%)
- Maltese: 32 (0.1%)
- British: 31 (0.1%)
- Ghanaian: 29 (0.10%)
- Ukrainian: 29 (0.10%)
- Slovak: 23 (0.08%)
- Northern European: 23 (0.08%)
- Cape Verdean: 22 (0.07%)
- Croatian: 14 (0.05%)
- Portuguese: 13 (0.04%)
- Scandinavian: 13 (0.04%)
- Assyrian: 13 (0.04%)
- Lebanese: 13 (0.04%)
- Barbadian: 13 (0.04%)
- Palestinian: 12 (0.04%)
- Pennsylvania German: 10 (0.03%)
- Russian: 10 (0.03%)
- Greek: 7 (0.02%)
- Ethiopian: 4 (0.01%)
Most common places of birth for foreign-born residents (%):
| Winter Haven: | 27.7% (1,338) |
| Florida: | 7.5% (342,375) |
| Winter Haven: | 10.9% (527) |
| Florida: | 5.6% (257,152) |
| Winter Haven: | 9.5% (460) |
| Florida: | 22.0% (1,006,576) |
| Winter Haven: | 9.1% (439) |
| Florida: | 5.0% (227,319) |
| Winter Haven: | 6.1% (296) |
| Florida: | 2.1% (94,349) |
| Winter Haven: | 4.5% (219) |
| Florida: | 0.7% (33,556) |
| Winter Haven: | 3.6% (174) |
| Florida: | 2.4% (109,132) |
| Winter Haven: | 3.4% (165) |
| Florida: | 1.8% (84,403) |
| Winter Haven: | 2.3% (109) |
| Florida: | 1.3% (60,604) |
| Winter Haven: | 2.0% (97) |
| Florida: | 5.7% (262,042) |
| Winter Haven: | 1.8% (87) |
| Florida: | 1.1% (49,838) |
| Winter Haven: | 1.7% (80) |
| Florida: | 6.5% (298,669) |
| Winter Haven: | 1.6% (78) |
| Florida: | 1.2% (54,585) |
Place of birth for U.S.-born residents:
- This state: 22,423
- Other state: 20,921
- Northeast: 8,081
- Midwest: 5,766
- South: 5,358
- West: 1,730
85.4% of Winter Haven residents lived in the same house 1 years ago.
Out of people who lived in different houses, 32.1% lived in this county.
Out of people who lived in different counties, 31.4% lived in Florida.
| Winter Haven: | 85.4% |
| State average: | 86.3% |
Education attainment for males 25 years and older:
- No schooling: 376
- Nursery to 4th grade: 173
- 5th and 6th grade: 271
- 7th and 8th grade: 80
- 9th grade: 208
- 10th grade: 142
- 11th grade: 151
- 12th grade, no diploma: 413
- High school graduate (or equivalency): 6,621
- Less than 1 year of college: 1,237
- Some college more than 1 year, no degree: 3,236
- Associate degree: 1,510
- Bachelor's degree: 2,380
- Master's degree: 786
- Professional school degree: 267
- Doctorate degree: 140

Education attainment for females 25 years and older:
- No schooling: 377
- Nursery to 4th grade: 46
- 5th and 6th grade: 264
- 7th and 8th grade: 277
- 9th grade: 314
- 10th grade: 342
- 11th grade: 368
- 12th grade, no diploma: 239
- High school graduate (or equivalency): 7,122
- Less than 1 year of college: 1,348
- Some college more than 1 year, no degree: 2,782
- Associate degree: 2,012
- Bachelor's degree: 2,950
- Master's degree: 906
- Professional school degree: 241
- Doctorate degree: 80


Housing units in structures:
- One, detached: 15,018
- One, attached: 774
- Two: 663
- 3 or 4: 1,621
- 5 to 9: 1,160
- 10 to 19: 827
- 20 to 49: 593
- 50 or more: 1,417
- Mobile homes: 1,541
Median worth of mobile homes: $62,555
Housing units lacking complete kitchen facilities in 2022: 1.0%
House/condo owner moved in on average 7 years ago
Renter moved in on average 2 years ago

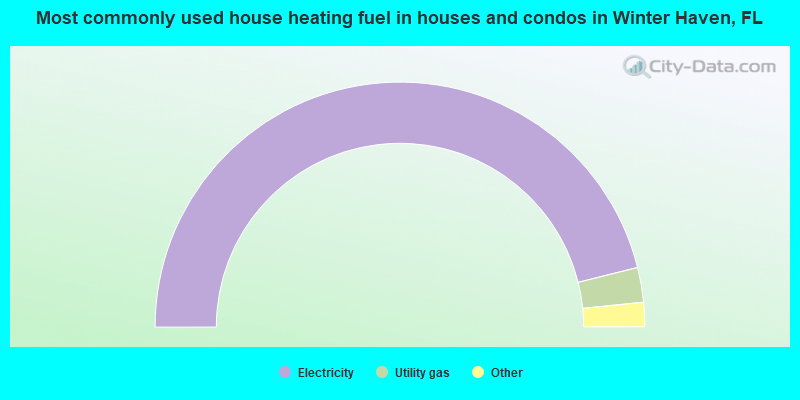
- 92.2%Electricity
- 4.6%Utility gas
- 2.0%No fuel used
- 0.6%Bottled, tank, or LP gas
- 0.6%Solar energy
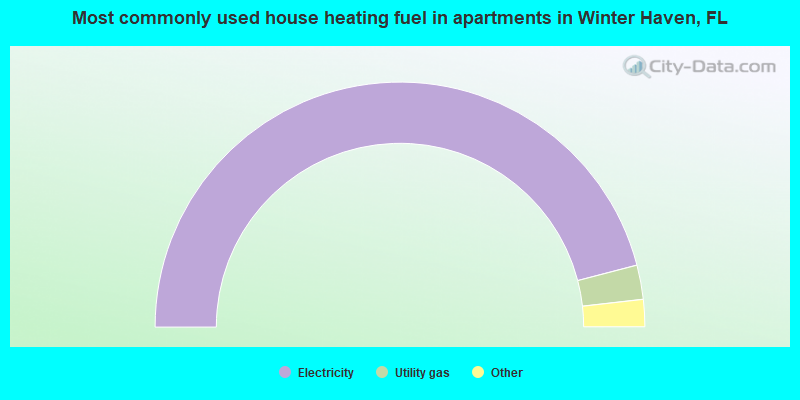
- 91.8%Electricity
- 4.5%Utility gas
- 2.3%No fuel used
- 1.1%Bottled, tank, or LP gas
- 0.2%Other fuel
Private vs. public school enrollment:
| Here: | 13.4% |
| Florida: | 15.8% |
| Here: | 12.5% |
| Florida: | 12.9% |
| Here: | 16.3% |
| Florida: | 23.6% |


