Winton, CA (California) Houses and Residents
| Winton: | $303,335 |
| California: | $715,900 |
Mean price in 2022:
Detached houses: $246,162
Here: $246,162 State: $988,808 Mobile homes: $94,767
Here: $94,767 State: $184,506
Total population: 10,613 (Urban population: 8,657, Rural population: 75 (23 farm, 52 nonfarm))
Houses: 3,424 (3,360 occupied: 2,011 owner occupied, 1,460 renter occupied)
| % of renters here: | 42% |
| State: | 44% |
Housing density: 1,192 houses/condos per square mile
Median price asked for vacant for-sale houses and condos in 2022: $3,637,566.
Median contract rent in 2022: $782 (lower quartile is $707, upper quartile is $901)
Median rent asked for vacant for-rent units in 2022: $1,644
Median gross rent in Winton, CA in 2022: $971
Housing units in Winton with a mortgage: 1,546 (6 second mortgage, 0 home equity loan, 5 both second mortgage and home equity loan)
Houses without a mortgage: 22
Median household income for houses/condos with a mortgage: $78,251
Median household income for apartments without a mortgage: $48,801
Median monthly housing costs: $1,087
Compare current foreclosures near Winton, CA:
| Photo | Address | Area | Beds / Baths | Price | Details |
|---|---|---|---|---|---|

|
#1
Arlene Dr
Winton, CA 95388
|
1,369 sq. feet
|
2 baths 3 beds |
show details | |

|
#2
Myrtle Ave
Winton, CA 95388
|
1,110 sq. feet
|
2 baths 3 beds |
show details | |

|
#3
Tokay Cir
Winton, CA 95388
|
1,248 sq. feet
|
2 baths 3 beds |
show details | |

|
#4
Grove Ave
Winton, CA 95388
|
- sq. feet
|
- baths - beds |
show details | |

|
#5
Antonio St
Winton, CA 95388
|
- sq. feet
|
- baths - beds |
show details | |

|
#6
Wren Dr
Winton, CA 95388
|
- sq. feet
|
- baths - beds |
show details | |

|
#7
Gertrude Ave
Winton, CA 95388
|
- sq. feet
|
- baths - beds |
show details | |

|
#8
American Ave
Hilmar, CA 95324
|
1,518 sq. feet
|
2 baths 3 beds |
show details | |

|
#9
7th St
Livingston, CA 95334
|
1,385 sq. feet
|
2 baths 3 beds |
show details | |

|
#10
Silkwood Ct
Delhi, CA 95315
|
1,118 sq. feet
|
2 baths 3 beds |
show details |
| Photo | Address | Area | Beds / Baths | Price | Details |
|---|---|---|---|---|---|

|
#11
E Grove Ave
Atwater, CA 95301
|
- sq. feet
|
2 baths 3 beds |
show details | |

|
#12
Harp Ct
Merced, CA 95341
|
- sq. feet
|
2 baths 4 beds |
show details | |

|
#13
Orchard Ln
Merced, CA 95340
|
701 sq. feet
|
1 baths 2 beds |
show details | |

|
#14
Topaz Cir
Hilmar, CA 95324
|
1,386 sq. feet
|
2 baths 3 beds |
show details | |

|
#15
Marguerite St
Atwater, CA 95301
|
1,059 sq. feet
|
1 baths 2 beds |
show details | |

|
#16
Bright Ct
Merced, CA 95348
|
1,406 sq. feet
|
2 baths 4 beds |
show details | |

|
#17
Trigger Ln
Livingston, CA 95334
|
2,814 sq. feet
|
3 baths 4 beds |
show details | |

|
#18
Pedras Rd
Turlock, CA 95382
|
1,684 sq. feet
|
1 baths 3 beds |
show details | |

|
#19
Hammatt Ave
Livingston, CA 95334
|
1,518 sq. feet
|
2 baths 3 beds |
show details | |

|
#20
Marian Ct
Merced, CA 95341
|
- sq. feet
|
2 baths 4 beds |
show details |
| Photo | Address | Area | Beds / Baths | Price | Details |
|---|---|---|---|---|---|

|
#21
Shady Ln Apt 1022
Turlock, CA 95382
|
1,136 sq. feet
|
2 baths 2 beds |
show details | |

|
#22
San Pablo Ave
Merced, CA 95348
|
1,901 sq. feet
|
2 baths 3 beds |
show details | |

|
#23
W 22nd St
Merced, CA 95340
|
955 sq. feet
|
1 baths 3 beds |
show details | |

|
#24
Myers Ln
Delhi, CA 95315
|
1,313 sq. feet
|
2 baths 4 beds |
show details | |

|
#25
Mckee Rd
Merced, CA 95340
|
1,740 sq. feet
|
1 baths 3 beds |
show details | |

|
#26
E 20th St
Merced, CA 95340
|
1,025 sq. feet
|
1 baths 2 beds |
show details | |

|
#27
Las Brisas Ct
Merced, CA 95341
|
1,313 sq. feet
|
2 baths 3 beds |
show details | |

|
#28
Occidental Ct
Merced, CA 95348
|
1,120 sq. feet
|
2 baths 3 beds |
show details | |

|
#29
Green St
Merced, CA 95340
|
1,264 sq. feet
|
2 baths 3 beds |
show details | |

|
#30
La Purisima St
Merced, CA 95341
|
1,277 sq. feet
|
2 baths 4 beds |
show details |
| Photo | Address | Area | Beds / Baths | Price | Details |
|---|---|---|---|---|---|

|
#31
El Camino Real
Merced, CA 95340
|
1,757 sq. feet
|
2 baths 3 beds |
show details | |

|
#32
Stonewall Ct
Delhi, CA 95315
|
901 sq. feet
|
2 baths 2 beds |
show details | |

|
#33
W 23rd St
Merced, CA 95340
|
996 sq. feet
|
1 baths 2 beds |
show details | |

|
#34
W 12th St
Merced, CA 95341
|
1,142 sq. feet
|
1 baths 2 beds |
show details | |

|
#35
E Alexander Ave
Merced, CA 95340
|
2,152 sq. feet
|
2 baths 3 beds |
show details | |

|
#36
August Ave
Delhi, CA 95315
|
1,530 sq. feet
|
2 baths 3 beds |
show details | |

|
#37
Casual Ct
Merced, CA 95340
|
2,036 sq. feet
|
2 baths 4 beds |
show details | |

|
#38
Emerson Ct
Delhi, CA 95315
|
1,973 sq. feet
|
2 baths 4 beds |
show details | |

|
#39
El Portal Dr
Merced, CA 95340
|
2,410 sq. feet
|
3 baths 4 beds |
show details | |

|
#40
6th St
Delhi, CA 95315
|
938 sq. feet
|
1 baths 2 beds |
show details |
| Photo | Address | Area | Beds / Baths | Price | Details |
|---|---|---|---|---|---|

|
#41
Swan Ct
Merced, CA 95340
|
1,823 sq. feet
|
2 baths 3 beds |
show details | |

|
#42
Swan Ct
Merced, CA 95340
|
1,434 sq. feet
|
2 baths 3 beds |
show details | |

|
#43
Gove Rd
Merced, CA 95341
|
560 sq. feet
|
1 baths 2 beds |
show details | |

|
#44
Cherokee Ave
Merced, CA 95340
|
1,706 sq. feet
|
2 baths 4 beds |
show details | |

|
#45
Wren Ct
Merced, CA 95340
|
1,621 sq. feet
|
2 baths 3 beds |
show details | |

|
#46
W Childs Ave
Merced, CA 95341
|
1,236 sq. feet
|
2 baths 3 beds |
show details | |

|
#47
Orchid Ln
Delhi, CA 95315
|
1,107 sq. feet
|
2 baths 3 beds |
show details | |

|
#48
Summit Way
Delhi, CA 95315
|
1,471 sq. feet
|
2 baths 4 beds |
show details | |

|
#49
Summit Ct
Delhi, CA 95315
|
1,176 sq. feet
|
1 baths 2 beds |
show details | |

|
Check over 1 million property listings on Foreclosure.com!
|
browse all offers | |||

Latest news about housing in Winton, CA collected exclusively by city-data.com from local newspapers, TV, and radio stations

 | Is it good to buy a house/ towny in Hayward? (11 replies) |
| Considering buying a place in hayward (6 replies) |
| California real state...the investors are back. (67 replies) |
| Sketchiest looking street in San Francisco? (42 replies) |
| Longwood- Winton Grove neighborhood in Hayward (0 replies) |
| Alameda to San Mateo (7 replies) |

Median year apartment built: 1980
Household type by relationship:
Households: 12,313- Male householders: 1,761 (415 living alone), Female householders: 1,598 (253 living alone)
1,558 spouses (1,558 opposite-sex spouses), 500 unmarried partners, (500 opposite-sex unmarried partners), 5,132 children (4,880 natural, 35 adopted, 215 stepchildren), 503 grandchildren, 283 brothers or sisters, 264 parents, 0 foster children, 461 other relatives, 249 non-relatives
Size of family households: 600 2-persons, 504 3-persons, 490 4-persons, 629 5-persons, 153 6-persons, 224 7-or-more-persons.
Size of nonfamily households: 686 1-person, 122 2-persons, 43 3-persons, 6 4-persons.
2,077 married couples with children.
1,536 single-parent households (829 men, 707 women).
25.6% of residents of Winton speak English at home.
72.6% of residents speak Spanish at home (62% speak English very well, 11% speak English well, 8% speak English not well, 19% don't speak English at all).
1.0% of residents speak other Indo-European language at home (38% speak English very well, 22% speak English well, 39% don't speak English at all).
2.4% of residents speak Asian or Pacific Island language at home (63% speak English very well, 11% speak English well, 4% speak English not well, 23% don't speak English at all).
0.1% of residents speak other language at home (100% speak English very well).
Foreign born population: 3,879 (31.5%)
(32.4% of them are naturalized citizens)
| Here: | 5.8 |
| State: | 6.0 |
| Here: | 4.2 |
| State: | 3.9 |

- Bedrooms in owner-occupied houses and condos in Winton, California
- 0no bedroom
- 01 bedroom
- 1682 bedrooms
- 1,1913 bedrooms
- 6044 bedrooms
- 495+ bedrooms

- Bedrooms in renter-occupied apartments in Winton, California
- 45no bedroom
- 2551 bedroom
- 5312 bedrooms
- 5393 bedrooms
- 914 bedrooms
- 05+ bedrooms

- Cars and other vehicles available in Winton in owner-occupied houses/condos
- 154no vehicle
- 2191 vehicle
- 1,0372 vehicles
- 3053 vehicles
- 2054 vehicles
- 925+ vehicles

- Cars and other vehicles available in Winton in renter-occupied apartments
- 23no vehicle
- 6211 vehicle
- 4532 vehicles
- 2713 vehicles
- 814 vehicles
- 125+ vehicles

- Rooms in owner-occupied houses in Winton, California
- 01 room
- 02 rooms
- 353 rooms
- 1864 rooms
- 4535 rooms
- 8536 rooms
- 3127 rooms
- 878 rooms
- 859+ rooms

- Rooms in renter-occupied apartments in Winton, California
- 451 room
- 1282 rooms
- 1943 rooms
- 4714 rooms
- 2815 rooms
- 2056 rooms
- 1367 rooms
- 08 rooms
- 09+ rooms


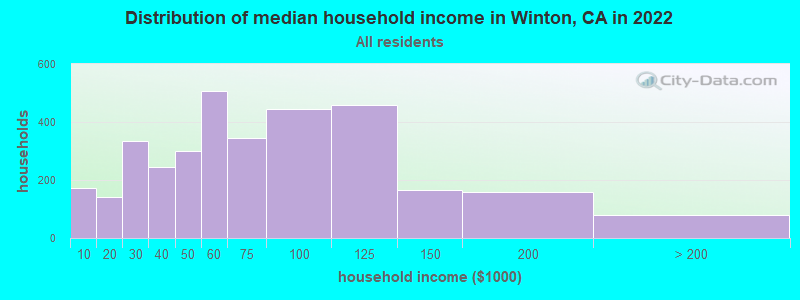
Winton, CA household income distribution

- 173Less than $10,000
- 140$10,000 to $19,999
- 334$20,000 to $29,999
- 245$30,000 to $39,999
- 299$40,000 to $49,999
- 507$50,000 to $59,999
- 346$60,000 to $74,999
- 446$75,000 to $99,999
- 458$100,000 to $124,999
- 164$125,000 to $149,999
- 159$150,000 to $199,999
- 81$200,000 or more
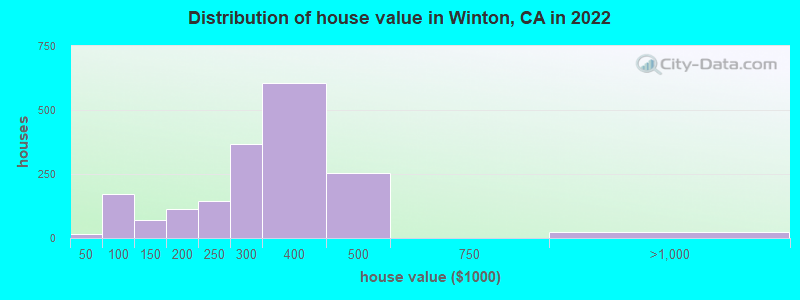
Home value of owner - occupied houses in 2022 in Winton, CA
-
- 6$15,000 to $19,999
- 10$40,000 to $49,999
- 142$50,000 to $59,999
- 9$60,000 to $69,999
- 8$70,000 to $79,999
- 45$100,000 to $124,999
- 25$125,000 to $149,999
- 56$150,000 to $174,999
- 55$175,000 to $199,999
- 146$200,000 to $249,999
- 369$250,000 to $299,999
- 604$300,000 to $399,999
- 254$400,000 to $499,999
- 24$750,000 to $999,999
Rent paid by renters in 2022 in Winton, CA
-
- 13$450 to $499
- 64$500 to $549
- 61$550 to $599
- 75$600 to $649
- 46$650 to $699
- 221$700 to $749
- 154$750 to $799
- 202$800 to $899
- 276$900 to $999
- 92$1,000 to $1,249
- 14$1,250 to $1,499
- 19$1,500 to $1,999
- 54$2,500 to $2,999
- 67No cash rent


Percentage of workers working in this county: 71.4%
Number of people working at home: 87 (1.9% of all workers)
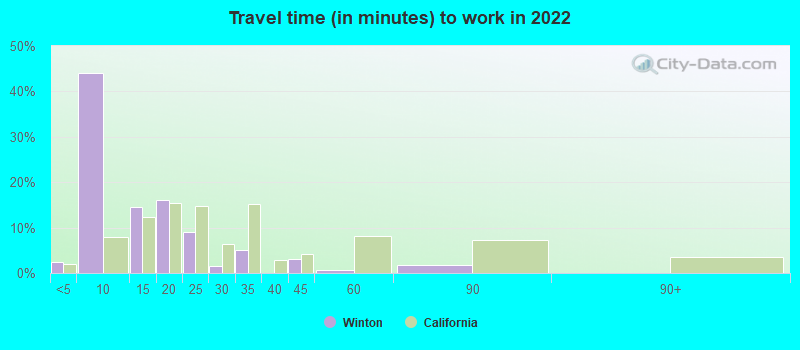
Travel time to work (commute)
- Less than 5 minutes: 64
- 5 to 9 minutes: 534
- 10 to 14 minutes: 620
- 15 to 19 minutes: 732
- 20 to 24 minutes: 661
- 25 to 29 minutes: 227
- 30 to 34 minutes: 682
- 35 to 39 minutes: 242
- 40 to 44 minutes: 29
- 45 to 59 minutes: 297
- 60 to 89 minutes: 238
- 90 or more minutes: 157
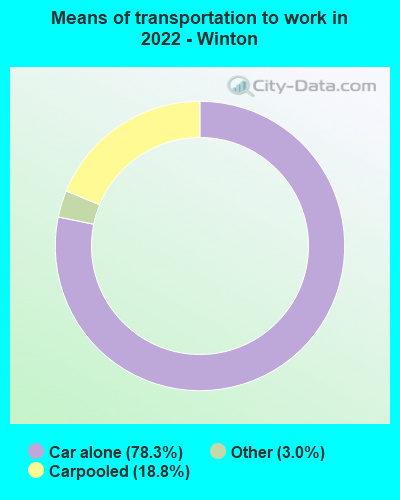
Means of transportation to work:
- Drove a car alone: 627 (67.8%)
- Carpooled: 232 (25.1%)
- Taxi: 25 (2.7%)
- Worked at home: 87 (9.4%)

- Unemployment by race in 2022
- Unemployment rate for White non-Hispanic residents
- 7.1%Males
- 0.8%Females
- Unemployment rate for other race residents
- 9.0%Males
- 19.8%Females
- Unemployment rate for two or more race residents
- 7.5%Males
- 8.7%Females
- Unemployment rate for Hispanic or Latino residents
- 8.9%Males
- 16.1%Females

- Year of entry for the foreign-born population in Winton, California
- 6872010 or later
- 9662000 to 2009
- 1,1011990 to 1999
- 1,4111980 to 1989
- 5441970 to 1979
- 202Before 1970

First ancestries reported:
- Portuguese: 222 (2.3%)
- German: 87 (0.9%)
- Irish: 66 (0.7%)
- English: 64 (0.7%)
- African: 45 (0.5%)
- Dutch: 33 (0.3%)
- Italian: 30 (0.3%)
- American: 21 (0.2%)
- Scottish: 15 (0.2%)
- French: 13 (0.1%)
- European: 11 (0.1%)
- Hungarian: 10 (0.1%)
- British: 7 (0.07%)
- French Canadian: 6 (0.06%)
Most common places of birth for foreign-born residents (%):
| Winton: | 87.7% (3,569) |
| California: | 37.2% (3,881,193) |
| Winton: | 1.9% (79) |
| California: | 0.2% (25,462) |
| Winton: | 1.9% (78) |
| California: | 0.1% (8,659) |
| Winton: | 1.8% (74) |
| California: | 7.8% (818,297) |
Place of birth for U.S.-born residents:
- This state: 7,707
- Other state: 564
- Northeast: 57
- Midwest: 164
- South: 155
- West: 188
91.6% of Winton residents lived in the same house 1 years ago.
Out of people who lived in different houses, 42.7% lived in this county.
Out of people who lived in different counties, 66.8% lived in California.
| Winton: | 91.6% |
| State average: | 88.9% |
Education attainment for males 25 years and older:
- No schooling: 222
- Nursery to 4th grade: 257
- 5th and 6th grade: 289
- 7th and 8th grade: 90
- 9th grade: 167
- 10th grade: 56
- 11th grade: 41
- 12th grade, no diploma: 93
- High school graduate (or equivalency): 1,249
- Less than 1 year of college: 158
- Some college more than 1 year, no degree: 612
- Associate degree: 246
- Bachelor's degree: 122
- Master's degree: 13
- Professional school degree: 19
- Doctorate degree: 0

Education attainment for females 25 years and older:
- No schooling: 187
- Nursery to 4th grade: 179
- 5th and 6th grade: 281
- 7th and 8th grade: 77
- 9th grade: 90
- 10th grade: 146
- 11th grade: 89
- 12th grade, no diploma: 144
- High school graduate (or equivalency): 988
- Less than 1 year of college: 77
- Some college more than 1 year, no degree: 671
- Associate degree: 106
- Bachelor's degree: 148
- Master's degree: 0
- Professional school degree: 55
- Doctorate degree: 0


Housing units in structures:
- One, detached: 2,593
- One, attached: 7
- Two: 228
- 3 or 4: 152
- 5 to 9: 198
- 10 to 19: 61
- Mobile homes: 166
- Boats, RVs, vans, etc.: 17
Median worth of mobile homes: $65,741
Housing units lacking complete kitchen facilities in 2022: 0.5%
House/condo owner moved in on average 10 years ago
Renter moved in on average 4 years ago

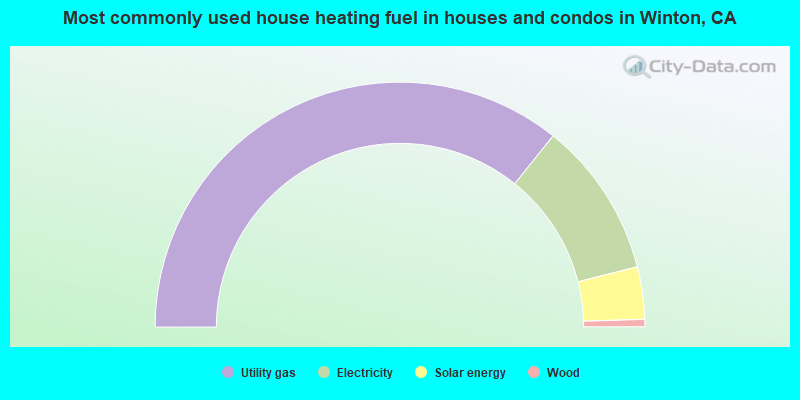
- 71.5%Utility gas
- 20.6%Electricity
- 6.9%Solar energy
- 1.0%Wood
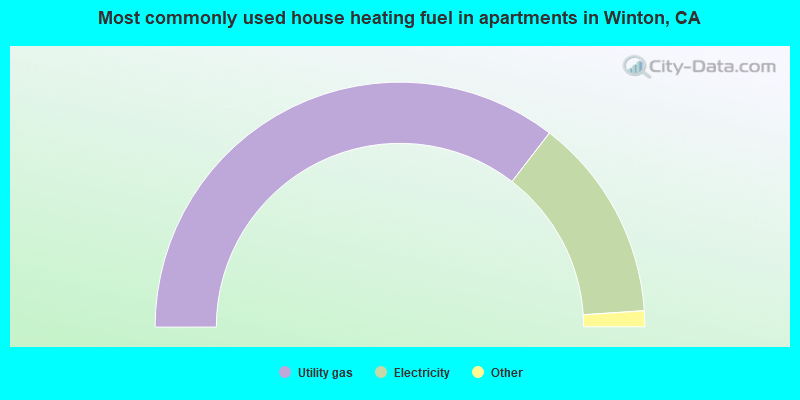
- 70.9%Utility gas
- 27.0%Electricity
- 1.2%No fuel used
- 0.8%Solar energy
Private vs. public school enrollment:
| Here: | 2.6% |
| California: | 10.5% |
| Here: | 0.0% |
| California: | 8.5% |
| Here: | 10.7% |
| California: | 15.9% |


