Jump to a detailed profile or search site with Google Custom Search

Woodside, CA (California) Houses and Residents

Estimated median house or condo value in 2022: over $2,201,486 (it was over $1,000,000 in 2000)
Woodside:

over $2,201,486
California:

$715,900
Lower value quartile - upper value quartile: Over $2,079,290 - Over $2,000,001

Mean price in 2022:

Detached houses: $5,501,955
Here:

$5,501,955
State:

$988,808

Townhouses or other attached units: $9,178,189
Here:

$9,178,189
State:

$838,546

Total population: 5,531 (Urban population: 3,898, Rural population: 1,355 (10 farm, 1,345 nonfarm))

Houses: 1,946 (1,715 occupied: 1,409 owner occupied, 272 renter occupied)

% of renters here:

16%
State:

44%

Housing density: 165 houses/condos per square mile

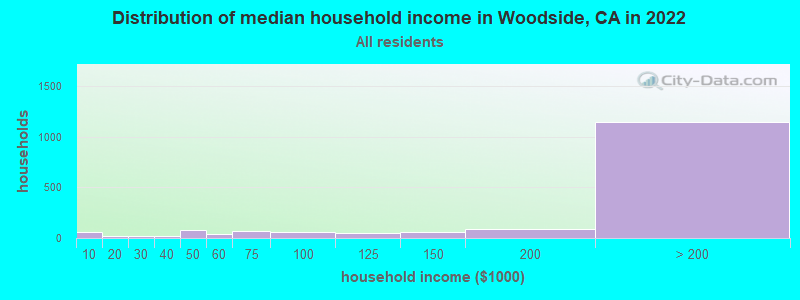
Median price asked for vacant for-sale houses and condos in 2022: $6,471,116.

Median contract rent in 2022: over $2,000


Median rent asked for vacant for-rent units in 2022: $3,499


Median gross rent in Woodside, CA in 2022: over $2,000

Housing units in Woodside with a mortgage: 825 (109 second mortgage, 0 home equity loan, 105 both second mortgage and home equity loan)
Houses without a mortgage: 5

Median household income for houses/condos with a mortgage: $258,196

Median household income for apartments without a mortgage: $244,299

Median monthly housing costs: $3,819

Compare current foreclosures near Woodside, CA:

Check out more offers near Woodside, CA.
Powered by Foreclosure.com

Settings
X
Data:
Loading data...
Based on 2000-2022 data
Loading data...

123
Hide US histogram

Latest news about housing in Woodside, CA collected exclusively by city-data.com from local newspapers, TV, and radio stations

Woodside, California Age and Sex of Residents
Median year house/condo built: 1965

Median year apartment built: 1962

Household type by relationship:

Households: 5,081
  • Male householders: 809 (81 living alone), Female householders: 830 (115 living alone)
  • 1,230 spouses (1,201 opposite-sex spouses), 97 unmarried partners, (97 opposite-sex unmarried partners), 1,713 children (1,691 natural, 21 adopted, 0 stepchildren), 15 grandchildren, 22 brothers or sisters, 62 parents, 0 foster children, 92 other relatives, 206 non-relatives

Size of family households: 523 2-persons, 367 3-persons, 295 4-persons, 110 5-persons, 28 6-persons, 11 7-or-more-persons.

Size of nonfamily households: 221 1-person, 56 2-persons, 21 3-persons, 10 5-persons.

962 married couples with children.
143 single-parent households (46 men, 97 women).

86.0% of residents of Woodside speak English at home.
2.6% of residents speak Spanish at home (100% speak English very well).
8.5% of residents speak other Indo-European language at home (86% speak English very well, 2% speak English well, 12% speak English not well).
3.5% of residents speak Asian or Pacific Island language at home (58% speak English very well, 42% speak English well).
0.2% of residents speak other language at home (82% speak English very well, 18% speak English well).

Foreign born population: 751 (14.8%)
(63.6% of them are naturalized citizens)

Median number of rooms in houses and condos:
Here:

8.0
State:

6.0

Median number of rooms in apartments
Here:

4.5
State:

3.9

Owner-occupied Renter-occupied
Bedrooms in owner-occupied houses and condos in Woodside, California
  • Bedrooms in owner-occupied houses and condos in Woodside, California
  • 0no bedroom
  • 31 bedroom
  • 1162 bedrooms
  • 3843 bedrooms
  • 6754 bedrooms
  • 2315+ bedrooms
Bedrooms in renter-occupied apartments in Woodside, California
  • Bedrooms in renter-occupied apartments in Woodside, California
  • 0no bedroom
  • 611 bedroom
  • 932 bedrooms
  • 713 bedrooms
  • 424 bedrooms
  • 55+ bedrooms
Owner-occupied Renter-occupied
Cars and other vehicles available in Woodside in owner-occupied houses/condos
  • Cars and other vehicles available in Woodside in owner-occupied houses/condos
  • 15no vehicle
  • 891 vehicle
  • 4812 vehicles
  • 4083 vehicles
  • 2524 vehicles
  • 1655+ vehicles
Cars and other vehicles available in Woodside in renter-occupied apartments
  • Cars and other vehicles available in Woodside in renter-occupied apartments
  • 2no vehicle
  • 1081 vehicle
  • 1182 vehicles
  • 273 vehicles
  • 74 vehicles
  • 115+ vehicles
Owner-occupied Renter-occupied
Rooms in owner-occupied houses in Woodside, California
  • Rooms in owner-occupied houses in Woodside, California
  • 01 room
  • 02 rooms
  • 83 rooms
  • 194 rooms
  • 1865 rooms
  • 1736 rooms
  • 1887 rooms
  • 3158 rooms
  • 5209+ rooms
Rooms in renter-occupied apartments in Woodside, California
  • Rooms in renter-occupied apartments in Woodside, California
  • 01 room
  • 392 rooms
  • 03 rooms
  • 914 rooms
  • 445 rooms
  • 336 rooms
  • 177 rooms
  • 68 rooms
  • 449+ rooms
Year house built
Median 2022 house/condo value by year built
Median house/condo value by year householder moved into unit
Breakdown of mean house values by ages of householders
  • Woodside, CA household income distribution

  • Distribution of median household income in Woodside, CA in 2022
  • 58Less than $10,000
  • 20$10,000 to $19,999
  • 15$20,000 to $29,999
  • 16$30,000 to $39,999
  • 77$40,000 to $49,999
  • 38$50,000 to $59,999
  • 66$60,000 to $74,999
  • 56$75,000 to $99,999
  • 47$100,000 to $124,999
  • 56$125,000 to $149,999
  • 88$150,000 to $199,999
  • 1,147$200,000 or more
  • Home value of owner - occupied houses in 2022 in Woodside, CA

  • Distribution of house value in Woodside, CA in 2022
  • 18Less than $10,000
  • 3$10,000 to $14,999
  • 2$300,000 to $399,999
  • 4$500,000 to $749,999
  • 1$750,000 to $999,999
  • 67$1,000,000 to $1,499,999
  • 42$1,500,000 to $1,999,999
  • 1,455$2,000,000 or more
  • Rent paid by renters in 2022 in Woodside, CA

  • Distribution of rent paid by renters in Woodside, CA in 2022
  • 1$100 to $149
  • 2$1,250 to $1,499
  • 26$1,500 to $1,999
  • 27$2,000 to $2,499
  • 32$2,500 to $2,999
  • 26$3,000 to $3,499
  • 84$3,500 or more
  • 72No cash rent
Time Leaving Home To Go To Work in 2022

Percentage of workers working in this county: 71.6%
Number of people working at home: 832 (36.4% of all workers)

Travel time (in minutes) to work in 2022

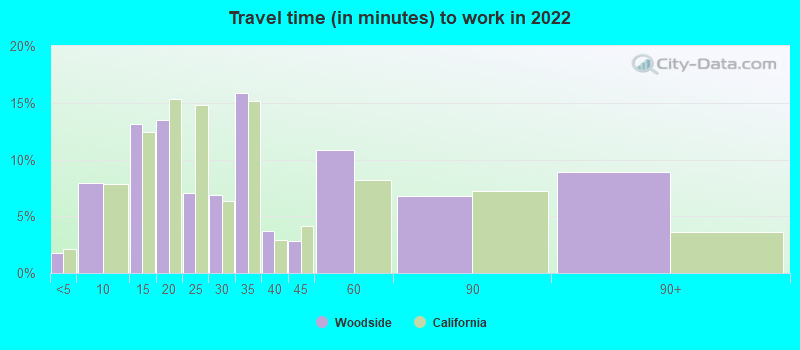
Travel time to work (commute)

  • Less than 5 minutes: 56
  • 5 to 9 minutes: 99
  • 10 to 14 minutes: 132
  • 15 to 19 minutes: 275
  • 20 to 24 minutes: 306
  • 25 to 29 minutes: 179
  • 30 to 34 minutes: 271
  • 35 to 39 minutes: 37
  • 40 to 44 minutes: 38
  • 45 to 59 minutes: 76
  • 60 to 89 minutes: 55
  • 90 or more minutes: 12
Means of transportation to work in 2022 - Woodside

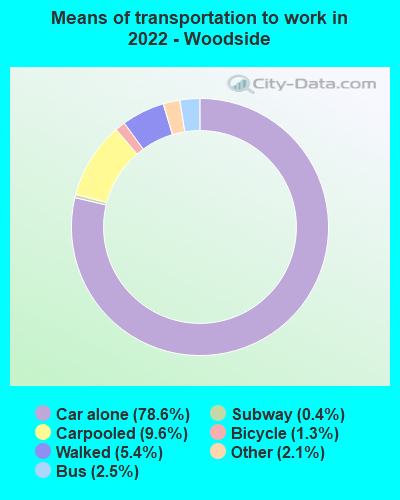
Means of transportation to work:

  • Drove a car alone: 1,333 (54.0%)
  • Carpooled: 178 (7.2%)
  • Bus: 37 (1.5%)
  • Long-distance train or commuter rail: 7 (0.3%)
  • Taxi: 29 (1.2%)
  • Bicycle: 25 (1.0%)
  • Walked: 102 (4.1%)
  • Worked at home: 832 (33.7%)
Class of Workers in 2022
  • Unemployment by race in 2022
  • Unemployment rate for White non-Hispanic residents
  • 3.2%Males
  • 5.9%Females
  • Unemployment rate for two or more race residents
  • 3.4%Males
Year of entry for the foreign-born population in Woodside, California
  • Year of entry for the foreign-born population in Woodside, California
  • 1032010 or later
  • 1332000 to 2009
  • 1461990 to 1999
  • 1691980 to 1989
  • 1321970 to 1979
  • 157Before 1970
Ancestries in Woodside, CA

First ancestries reported:

  • American: 222 (10.5%)
  • English: 216 (10.2%)
  • German: 183 (8.7%)
  • Italian: 143 (6.8%)
  • European: 136 (6.4%)
  • Iranian: 94 (4.5%)
  • Irish: 88 (4.2%)
  • Russian: 70 (3.3%)
  • Northern European: 68 (3.2%)
  • Swedish: 46 (2.2%)
  • French: 37 (1.8%)
  • Eastern European: 34 (1.6%)
  • Polish: 29 (1.4%)
  • Norwegian: 22 (1.0%)
  • Dutch: 21 (1.0%)
  • French Canadian: 20 (0.9%)
  • Scotch-Irish: 15 (0.7%)
  • Portuguese: 12 (0.6%)
  • Canadian: 12 (0.6%)
  • Greek: 11 (0.5%)
  • Belgian: 10 (0.5%)
  • Austrian: 9 (0.4%)
  • Welsh: 9 (0.4%)
  • South African: 8 (0.4%)
  • Scottish: 7 (0.3%)
  • Jordanian: 6 (0.3%)
  • Czech: 6 (0.3%)
  • Lithuanian: 5 (0.2%)
  • Serbian: 5 (0.2%)
  • British: 4 (0.2%)
  • Danish: 4 (0.2%)
  • Scandinavian: 3 (0.1%)
  • Bulgarian: 2 (0.09%)

Most common places of birth for foreign-born residents (%):

India
Woodside:

10.8% (82)
California:

5.2% (539,184)

Iran
Woodside:

10.3% (78)
California:

2.0% (206,004)

Russia
Woodside:

9.5% (72)
California:

0.7% (71,932)

China, excluding Hong Kong and Taiwan
Woodside:

8.6% (65)
California:

6.6% (684,672)

Mexico
Woodside:

7.9% (60)
California:

37.2% (3,881,193)

Canada
Woodside:

6.3% (48)
California:

1.2% (127,477)

Japan
Woodside:

4.2% (32)
California:

1.0% (103,575)

Germany
Woodside:

4.1% (31)
California:

0.7% (73,304)

Bangladesh
Woodside:

3.4% (26)
California:

0.2% (18,366)

Brazil
Woodside:

3.2% (24)
California:

0.5% (53,222)

United Kingdom, excluding England and Scotland
Woodside:

2.9% (22)
California:

0.6% (60,582)

Taiwan
Woodside:

2.9% (22)
California:

1.7% (176,274)

Sweden
Woodside:

2.5% (19)
California:

0.1% (12,221)

Vietnam
Woodside:

2.5% (19)
California:

4.9% (512,335)

Israel
Woodside:

2.2% (17)
California:

0.3% (33,029)

Poland
Woodside:

2.2% (17)
California:

0.2% (20,997)

Other Australian and New Zealand Subregion
Woodside:

2.1% (16)
California:

0.1% (7,249)

Place of birth for U.S.-born residents:

  • This state: 2,744
  • Other state: 1,518
  • Northeast: 506
  • Midwest: 395
  • South: 296
  • West: 319

90.0% of Woodside residents lived in the same house 1 years ago.
   Out of people who lived in different houses, 26.0% lived in this county.
   Out of people who lived in different counties, 23.1% lived in California.


Woodside:

90.0%
State average:

88.9%

Education attainment for males 25 years and older:

  • No schooling: 7
  • Nursery to 4th grade: 0
  • 5th and 6th grade: 0
  • 7th and 8th grade: 0
  • 9th grade: 0
  • 10th grade: 4
  • 11th grade: 0
  • 12th grade, no diploma: 7
  • High school graduate (or equivalency): 141
  • Less than 1 year of college: 38
  • Some college more than 1 year, no degree: 68
  • Associate degree: 53
  • Bachelor's degree: 609
  • Master's degree: 483
  • Professional school degree: 131
  • Doctorate degree: 197
Educational Attainment for Males

Education attainment for females 25 years and older:

  • No schooling: 4
  • Nursery to 4th grade: 0
  • 5th and 6th grade: 0
  • 7th and 8th grade: 20
  • 9th grade: 0
  • 10th grade: 0
  • 11th grade: 0
  • 12th grade, no diploma: 20
  • High school graduate (or equivalency): 128
  • Less than 1 year of college: 32
  • Some college more than 1 year, no degree: 147
  • Associate degree: 124
  • Bachelor's degree: 583
  • Master's degree: 505
  • Professional school degree: 210
  • Doctorate degree: 62
Educational Attainment for Females
Woodside marital status for males
Woodside marital status for females

Housing units in structures:

  • One, detached: 1,901
  • One, attached: 17
  • Two: 15
  • 3 or 4: 9
  • 50 or more: 4
Housing units lacking complete plumbing facilities in 2022: 1.6%

Housing units lacking complete kitchen facilities in 2022: 0.3%

House/condo owner moved in on average 16 years ago

Renter moved in on average 2 years ago

Year householders moved into residence in Woodside
Houses and condos Apartments
Most commonly used house heating fuel in houses and condos in Woodside, CA
  • 72.2%Utility gas
  • 13.9%Electricity
  • 9.3%Bottled, tank, or LP gas
  • 3.4%Other fuel
  • 0.8%Solar energy
  • 0.4%Wood
Most commonly used house heating fuel in apartments in Woodside, CA
  • 60.4%Utility gas
  • 15.6%Electricity
  • 12.7%Bottled, tank, or LP gas
  • 5.5%Solar energy
  • 5.1%Wood
  • 0.7%Other fuel

Private vs. public school enrollment:

Students in private schools in grades 1 to 8 (elementary and middle school): 109
Here:

20.1%
California:

10.5%

Students in private schools in grades 9 to 12 (high school): 95
Here:

26.8%
California:

8.5%

Students in private undergraduate colleges: 56
Here:

40.9%
California:

15.9%
School Enrollment by Level of School for Male Students
School Enrollment by Level of School for Female Students
Age and Sex of Sensory-Disabled Noninstitutionalized Residents
Age and Sex of Physically-Disabled Noninstitutionalized Residents
Age and Sex of Mentally-Disabled Noninstitutionalized Residents
Age and Sex of Self-Care Disabled Noninstitutionalized Residents
Age and Sex of Go-Outside-Home Disabled Noninstitutionalized Residents
Age and Sex of Noninstitutionalized Residents with Employment Disability