Yakama Reservation, WA (Washington) Houses and Residents
| Yakama Reservation: | $406,531 |
| Washington: | $569,500 |
Total population: 563 (Urban population: 0, Rural population: 524 (23 farm, 501 nonfarm))
Houses: 244 (208 occupied: 154 owner occupied, 54 renter occupied)
| % of renters here: | 26% |
| State: | 36% |
Housing density: 1 houses/condos per square mile
Median price asked for vacant for-sale houses and condos in 2022 in this county: $473,227.
Median contract rent in 2022: $596 (lower quartile is $276, upper quartile is $903)
Median rent asked for vacant for-rent units in 2022: $730
Median gross rent in Yakama Reservation, WA in 2022: $883
Housing units in Yakama Reservation with a mortgage: 30 (2 second mortgage, 6 home equity loan, 0 both second mortgage and home equity loan)
Houses without a mortgage: 15
Compare current foreclosures near Yakama Reservation, WA:
| Photo | Address | Area | Beds / Baths | Price | Details |
|---|---|---|---|---|---|

|
#1
Orchard Heights
Goldendale, WA 98620
|
- sq. feet
|
- baths - beds |
show details | |

|
#2
N 1st St
Glenwood, WA 98619
|
- sq. feet
|
- baths - beds |
show details | |

|
Check over 1 million property listings on Foreclosure.com!
|
browse all offers | |||

Household type by relationship:
Households: 20,120- In family households: 16,765 (4,070 male householders, 1,556 female householders)
4,535 spouses, 5,006 children (4,550 natural, 179 adopted, 277 stepchildren), 433 grandchildren, 118 brothers or sisters, 127 parents, foster children, 238 other relatives, 569 non-relatives
- In nonfamily households: 3,355 (1,437 male householders (1,123 living alone)), 1,264 female householders (1,072 living alone)), 654 nonrelatives
- In group quarters: 198 (37 institutionalized population)
3,426 married couples with children.
1,253 single-parent households (381 men, 872 women).
96.6% of residents of Yakama Reservation speak English at home.
1.2% of residents speak Spanish at home (67% speak English very well, 33% speak English not well).
0.4% of residents speak Asian or Pacific Island language at home (100% speak English not well).
1.8% of residents speak other language at home (100% speak English very well).
Foreign born population: 15 (2.3%)
(66.7% of them are naturalized citizens)
| Here: | 6.4 |
| State: | 6.5 |
| Here: | 4.7 |
| State: | 3.9 |

- Bedrooms in owner-occupied houses and condos in Yakama Reservation, Washington
- 0no bedroom
- 51 bedroom
- 392 bedrooms
- 713 bedrooms
- 304 bedrooms
- 95+ bedrooms

- Bedrooms in renter-occupied apartments in Yakama Reservation, Washington
- 2no bedroom
- 21 bedroom
- 192 bedrooms
- 263 bedrooms
- 34 bedrooms
- 25+ bedrooms

- Cars and other vehicles available in Yakama Reservation in owner-occupied houses/condos
- 4no vehicle
- 311 vehicle
- 562 vehicles
- 413 vehicles
- 134 vehicles
- 95+ vehicles

- Cars and other vehicles available in Yakama Reservation in renter-occupied apartments
- 2no vehicle
- 231 vehicle
- 192 vehicles
- 103 vehicles
- 04 vehicles
- 05+ vehicles

- Rooms in owner-occupied houses in Yakama Reservation, Washington
- 01 room
- 02 rooms
- 23 rooms
- 304 rooms
- 265 rooms
- 336 rooms
- 337 rooms
- 128 rooms
- 189+ rooms

- Rooms in renter-occupied apartments in Yakama Reservation, Washington
- 01 room
- 02 rooms
- 83 rooms
- 134 rooms
- 185 rooms
- 66 rooms
- 57 rooms
- 48 rooms
- 09+ rooms


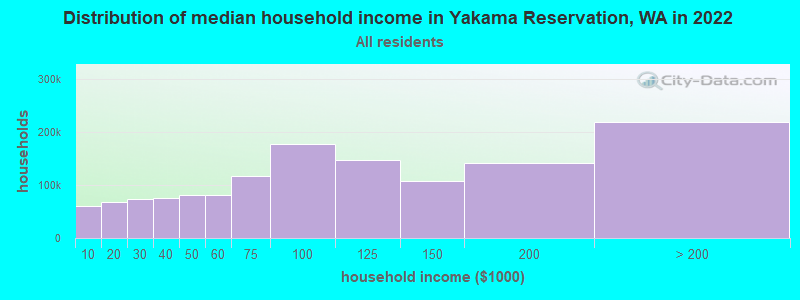
Yakama Reservation, WA household income distribution

- 17,152Less than $10,000
- 24,114$10,000 to $19,999
- 26,370$20,000 to $29,999
- 25,235$30,000 to $39,999
- 29,680$40,000 to $49,999
- 25,863$50,000 to $59,999
- 37,127$60,000 to $74,999
- 57,739$75,000 to $99,999
- 49,074$100,000 to $124,999
- 35,684$125,000 to $149,999
- 46,692$150,000 to $199,999
- 56,385$200,000 or more
Percentage of workers working in this county: 91.0%
Number of people working at home: 40 (15.6% of all workers)
Travel time to work (commute)
- Less than 5 minutes: 44
- 5 to 9 minutes: 55
- 10 to 14 minutes: 13
- 15 to 19 minutes: 1
- 20 to 24 minutes: 13
- 25 to 29 minutes: 0
- 30 to 34 minutes: 9
- 35 to 39 minutes: 4
- 40 to 44 minutes: 6
- 45 to 59 minutes: 19
- 60 to 89 minutes: 23
- 90 or more minutes: 7
Means of transportation to work:
- Drove a car alone: 128 (60.1%)
- Carpooled: 32 (15.0%)
- Walked: 34 (16.0%)
- Worked at home: 19 (8.9%)


- Year of entry for the foreign-born population in Yakama Reservation, Washington
- 21995 to March 2000
- 01990 to 1994
- 11985 to 1989
- 01980 to 1984
- 01975 to 1979
- 01970 to 1974
- 21965 to 1969
- 4Before 1965
Most common places of birth for foreign-born residents (%):
| Yakama Reservation: | 33.3% (3) |
| Washington: | 3.3% (20,321) |
| Yakama Reservation: | 33.3% (3) |
| Washington: | 24.1% (148,115) |
| Yakama Reservation: | 22.2% (2) |
| Washington: | 6.2% (38,172) |
Place of birth for U.S.-born residents:
- This state: 311
- Other state: 204
- Northeast: 5
- Midwest: 37
- South: 18
- West: 144
69% of Yakama Reservation residents lived in the same house 5 years ago.
Out of people who lived in different houses, 49% lived in this county.
Out of people who lived in different counties, 40% lived in Washington.
Education attainment for males 25 years and older:
- No schooling: 1
- Nursery to 4th grade: 0
- 5th and 6th grade: 0
- 7th and 8th grade: 0
- 9th grade: 0
- 10th grade: 6
- 11th grade: 15
- 12th grade, no diploma: 3
- High school graduate (or equivalency): 84
- Less than 1 year of college: 7
- Some college more than 1 year, no degree: 23
- Associate degree: 16
- Bachelor's degree: 20
- Master's degree: 5
- Professional school degree: 0
- Doctorate degree: 0

Education attainment for females 25 years and older:
- No schooling: 0
- Nursery to 4th grade: 0
- 5th and 6th grade: 0
- 7th and 8th grade: 0
- 9th grade: 0
- 10th grade: 4
- 11th grade: 3
- 12th grade, no diploma: 0
- High school graduate (or equivalency): 78
- Less than 1 year of college: 18
- Some college more than 1 year, no degree: 34
- Associate degree: 12
- Bachelor's degree: 14
- Master's degree: 5
- Professional school degree: 0
- Doctorate degree: 2


Housing units in structures:
- One, detached: 149
- One, attached: 4
- Two: 2
- 3 or 4: 2
- Mobile homes: 87
Median worth of mobile homes: $198,892
Housing units lacking complete kitchen facilities: 2.5%

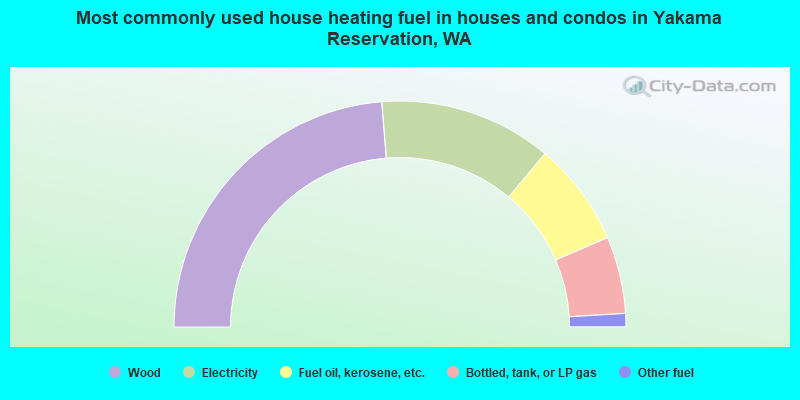
- 47.4%Wood
- 24.7%Electricity
- 14.9%Fuel oil, kerosene, etc.
- 11.0%Bottled, tank, or LP gas
- 1.9%Other fuel
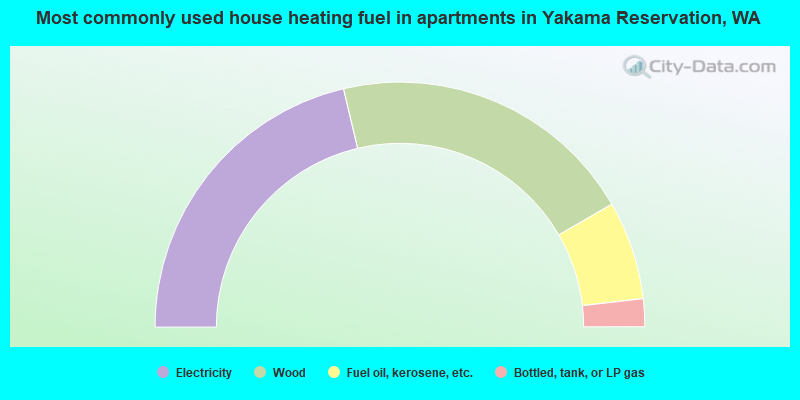
- 42.6%Electricity
- 40.7%Wood
- 13.0%Fuel oil, kerosene, etc.
- 3.7%Bottled, tank, or LP gas
Private vs. public school enrollment:
| Here: | 0.0% |
| Washington: | 9.2% |
| Here: | 0.0% |
| Washington: | 7.0% |
| Here: | 0.0% |
| Washington: | 15.7% |


