Yelm, WA (Washington) Houses and Residents
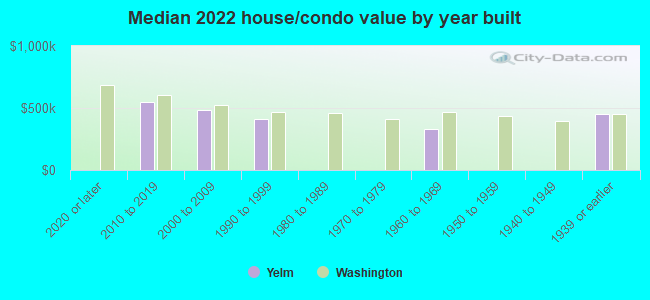
| Yelm: | $453,126 |
| Washington: | $569,500 |
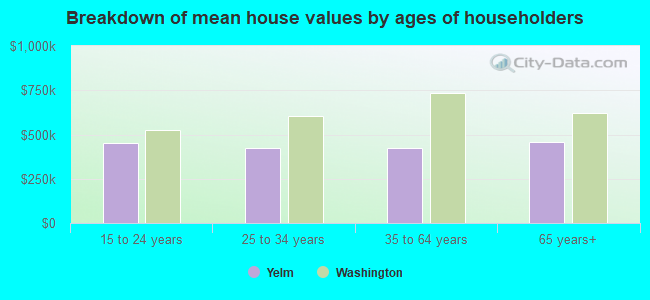
Mean price in 2022:
Detached houses: $455,141
Here: $455,141 State: $734,307 Mobile homes: $241,821
Here: $241,821 State: $218,362
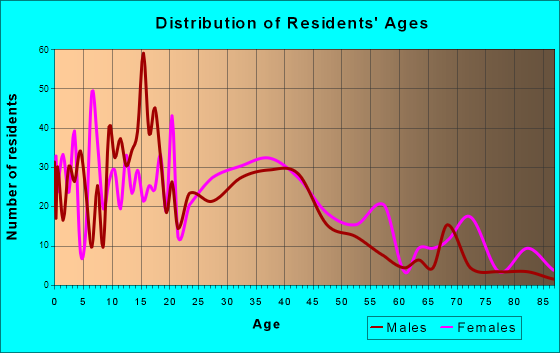
Total population: 8,223 (Urban population: 3,130 (all inside urban clusters), Rural population: 218 (all nonfarm))
Houses: 3,485 (3,408 occupied: 2,390 owner occupied, 1,005 renter occupied)
| % of renters here: | 30% |
| State: | 36% |
Housing density: 619 houses/condos per square mile
Median price asked for vacant for-sale houses and condos in 2022 in this county: $989,514.
Median contract rent in 2022: $1,201 (lower quartile is $590, upper quartile is $1,775)
Median rent asked for vacant for-rent units in 2022: $4,544
Median gross rent in Yelm, WA in 2022: $1,432
Housing units in Yelm with a mortgage: 1,946 (119 second mortgage, 0 home equity loan, 60 both second mortgage and home equity loan)
Houses without a mortgage: 9
Median household income for houses/condos with a mortgage: $97,713
Median household income for apartments without a mortgage: $84,235
Median monthly housing costs: $1,865
Compare current foreclosures in Yelm, WA:
| Photo | Address | Area | Beds / Baths | Price | Details |
|---|---|---|---|---|---|

|
#1
Promontory Ct SE
Yelm, WA 98597
|
1,152 sq. feet
|
2 baths 2 beds |
show details | |

|
#2
99th Ave SE
Yelm, WA 98597
|
1,560 sq. feet
|
2 baths 3 beds |
show details | |

|
#3
Canal Rd SE
Yelm, WA 98597
|
1,608 sq. feet
|
2 baths 3 beds |
show details | |

|
#4
Lawrence Lake Rd SE
Yelm, WA 98597
|
1,816 sq. feet
|
3 baths 3 beds |
show details | |

|
#5
Beachside Dr SE
Yelm, WA 98597
|
1,373 sq. feet
|
1 baths 1 beds |
show details | |

|
#6
Lofty Ct SE
Yelm, WA 98597
|
1,940 sq. feet
|
3 baths 3 beds |
show details | |

|
#7
155th Ave SE
Yelm, WA 98597
|
1,348 sq. feet
|
2 baths 3 beds |
show details | |

|
#8
Carter Loop SE
Yelm, WA 98597
|
1,434 sq. feet
|
2 baths 3 beds |
show details | |

|
#9
Hickory Ln SE
Yelm, WA 98597
|
768 sq. feet
|
3 baths 3 beds |
show details | |

|
#10
104th Ave SE
Yelm, WA 98597
|
2,216 sq. feet
|
2 baths 3 beds |
show details |
| Photo | Address | Area | Beds / Baths | Price | Details |
|---|---|---|---|---|---|

|
#11
104th Way SE
Yelm, WA 98597
|
2,251 sq. feet
|
2 baths 4 beds |
show details | |

|
#12
Briar St SE
Yelm, WA 98597
|
1,344 sq. feet
|
2 baths 2 beds |
show details | |

|
#13
Terra View St SE
Yelm, WA 98597
|
2,468 sq. feet
|
2 baths 3 beds |
show details | |

|
#14
Cole Ct
Yelm, WA 98597
|
2,080 sq. feet
|
3 baths 3 beds |
show details | |

|
#15
NW Crystal Ct
Yelm, WA 98597
|
1,140 sq. feet
|
1 baths 3 beds |
show details | |

|
#16
Van Trump Ave NW
Yelm, WA 98597
|
1,266 sq. feet
|
2 baths 5 beds |
show details | |

|
#17
Witland Ln SE
Yelm, WA 98597
|
3,468 sq. feet
|
2 baths - beds |
show details | |

|
#18
86th Ave SE
Yelm, WA 98597
|
1,152 sq. feet
|
- baths - beds |
show details | |

|
#19
Bluewater Dr SE
Yelm, WA 98597
|
- sq. feet
|
- baths - beds |
show details | |

|
#20
Daphne Ct SE
Yelm, WA 98597
|
- sq. feet
|
- baths - beds |
show details |
| Photo | Address | Area | Beds / Baths | Price | Details |
|---|---|---|---|---|---|

|
#21
Regal Ln SE
Yelm, WA 98597
|
- sq. feet
|
- baths - beds |
show details | |

|
#22
Hillcrest Dr SE
Yelm, WA 98597
|
- sq. feet
|
- baths - beds |
show details | |

|
#23
Lindsay Rd SE
Yelm, WA 98597
|
1,848 sq. feet
|
- baths - beds |
show details | |

|
#24
Port Orford Blvd SE
Yelm, WA 98597
|
1,456 sq. feet
|
- baths - beds |
show details | |

|
#25
Tranquility Ln SE
Yelm, WA 98597
|
- sq. feet
|
- baths - beds |
show details | |

|
#26
Vail Rd SE
Yelm, WA 98597
|
- sq. feet
|
- baths - beds |
show details | |

|
#27
148th Ave SE
Yelm, WA 98597
|
720 sq. feet
|
- baths - beds |
show details | |

|
#28
West Rd SE
Yelm, WA 98597
|
- sq. feet
|
- baths - beds |
show details | |

|
#29
Vail Rd SE
Yelm, WA 98597
|
- sq. feet
|
- baths - beds |
show details | |

|
#30
Penny Dr SE
Yelm, WA 98597
|
- sq. feet
|
- baths - beds |
show details |
| Photo | Address | Area | Beds / Baths | Price | Details |
|---|---|---|---|---|---|

|
#31
Tahoma Blvd SE
Yelm, WA 98597
|
- sq. feet
|
- baths - beds |
show details | |

|
#32
Timber Ridge Dr SE
Yelm, WA 98597
|
- sq. feet
|
- baths - beds |
show details | |

|
#33
Flume Rd SE
Yelm, WA 98597
|
1,056 sq. feet
|
- baths - beds |
show details | |

|
#34
107th Loop SE
Yelm, WA 98597
|
1,652 sq. feet
|
- baths - beds |
show details | |

|
#35
Kayla St SE
Yelm, WA 98597
|
- sq. feet
|
- baths - beds |
show details | |

|
#36
Bald Hill Rd SE
Yelm, WA 98597
|
- sq. feet
|
- baths - beds |
show details | |

|
#37
123rd Ave SE
Yelm, WA 98597
|
- sq. feet
|
- baths - beds |
show details | |

|
#38
83rd Way SE
Yelm, WA 98597
|
- sq. feet
|
- baths - beds |
show details | |

|
#39
Elk Heights Ln SE
Yelm, WA 98597
|
- sq. feet
|
- baths - beds |
show details | |

|
Check over 1 million property listings on Foreclosure.com!
|
browse all offers | |||

Latest news about housing in Yelm, WA collected exclusively by city-data.com from local newspapers, TV, and radio stations

 | My homebuilding project in Yelm (40 replies) |
| Possible Move to Washington State (38 replies) |
| New airport near Tumwater? (47 replies) |
| Seattle’s median home price hits record: $700,000, double 5 years ago (36 replies) |
| Waterfront Property in Washington State (anywhere) (54 replies) |
| Boarded up houses near Roosevelt HS? (9 replies) |
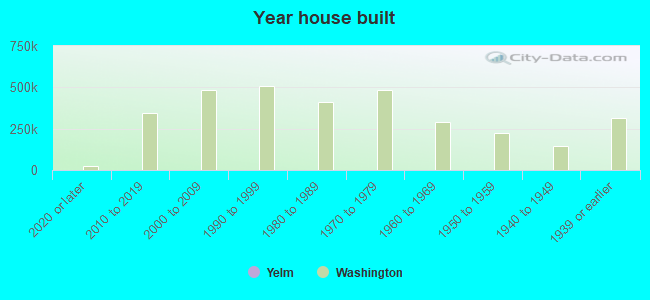
Median year apartment built: 1999
Household type by relationship:
Households: 10,597- Male householders: 1,815 (278 living alone), Female householders: 1,549 (349 living alone)
2,175 spouses (2,162 opposite-sex spouses), 275 unmarried partners, (275 opposite-sex unmarried partners), 3,803 children (3,422 natural, 134 adopted, 246 stepchildren), 138 grandchildren, 144 brothers or sisters, 79 parents, 0 foster children, 379 other relatives, 218 non-relatives
- In group quarters: 19
Size of family households: 874 2-persons, 449 3-persons, 532 4-persons, 338 5-persons, 181 6-persons, 107 7-or-more-persons.
Size of nonfamily households: 690 1-person, 135 2-persons, 10 3-persons, 6 5-persons.
2,385 married couples with children.
458 single-parent households (179 men, 279 women).
86.6% of residents of Yelm speak English at home.
5.6% of residents speak Spanish at home (68% speak English very well, 27% speak English well, 4% don't speak English at all).
3.3% of residents speak other Indo-European language at home (90% speak English very well, 8% speak English well, 2% don't speak English at all).
3.7% of residents speak Asian or Pacific Island language at home (47% speak English very well, 51% speak English well, 2% speak English not well).
Foreign born population: 659 (6.2%)
(46.9% of them are naturalized citizens)
| Here: | 7.2 |
| State: | 6.5 |
| Here: | 4.1 |
| State: | 3.9 |
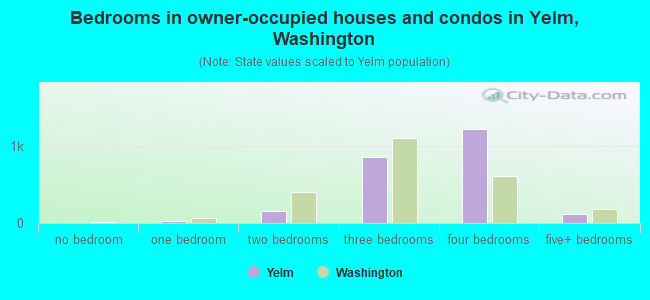
- Bedrooms in owner-occupied houses and condos in Yelm, Washington
- 0no bedroom
- 321 bedroom
- 1612 bedrooms
- 8583 bedrooms
- 1,2234 bedrooms
- 1185+ bedrooms
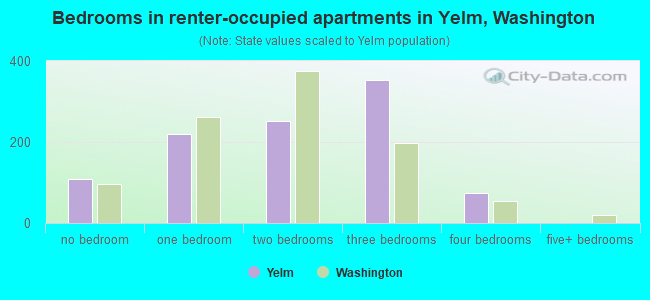
- Bedrooms in renter-occupied apartments in Yelm, Washington
- 109no bedroom
- 2201 bedroom
- 2512 bedrooms
- 3523 bedrooms
- 744 bedrooms
- 05+ bedrooms
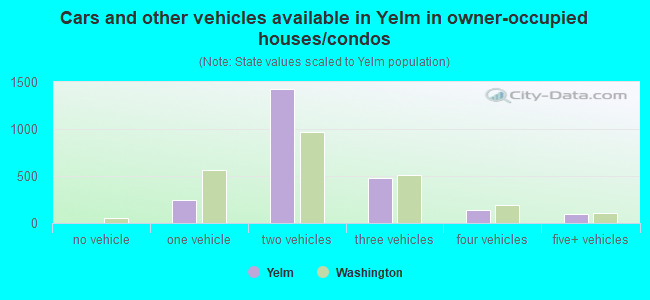
- Cars and other vehicles available in Yelm in owner-occupied houses/condos
- 0no vehicle
- 2481 vehicle
- 1,4272 vehicles
- 4793 vehicles
- 1394 vehicles
- 985+ vehicles
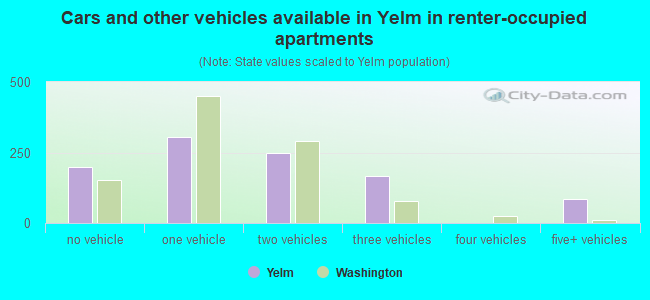
- Cars and other vehicles available in Yelm in renter-occupied apartments
- 200no vehicle
- 3051 vehicle
- 2492 vehicles
- 1673 vehicles
- 04 vehicles
- 845+ vehicles
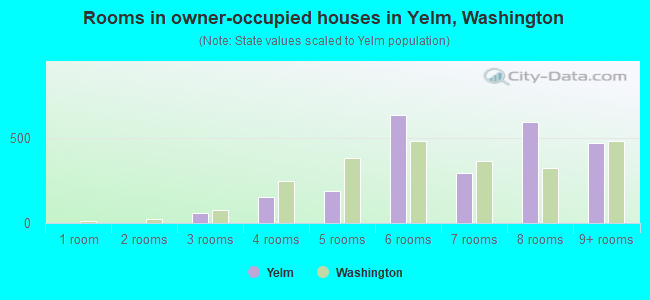
- Rooms in owner-occupied houses in Yelm, Washington
- 01 room
- 02 rooms
- 573 rooms
- 1534 rooms
- 1875 rooms
- 6346 rooms
- 2937 rooms
- 5948 rooms
- 4729+ rooms
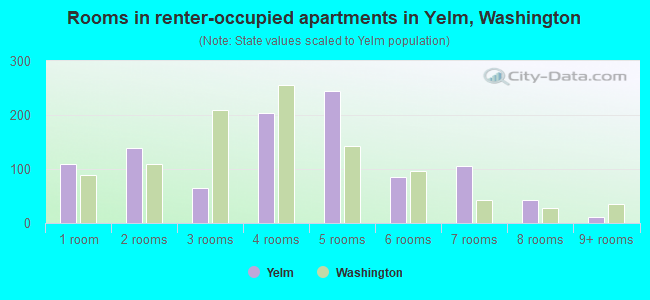
- Rooms in renter-occupied apartments in Yelm, Washington
- 1091 room
- 1392 rooms
- 643 rooms
- 2044 rooms
- 2455 rooms
- 866 rooms
- 1057 rooms
- 428 rooms
- 129+ rooms
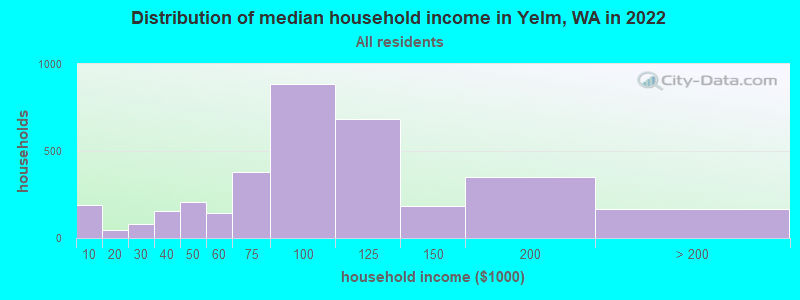
Yelm, WA household income distribution

- 191Less than $10,000
- 45$10,000 to $19,999
- 82$20,000 to $29,999
- 158$30,000 to $39,999
- 205$40,000 to $49,999
- 141$50,000 to $59,999
- 377$60,000 to $74,999
- 885$75,000 to $99,999
- 685$100,000 to $124,999
- 185$125,000 to $149,999
- 348$150,000 to $199,999
- 165$200,000 or more
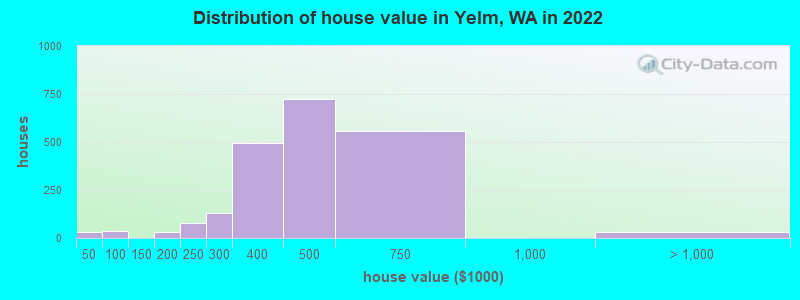
Home value of owner - occupied houses in 2022 in Yelm, WA
-
- 10Less than $10,000
- 4$20,000 to $24,999
- 7$25,000 to $29,999
- 9$30,000 to $34,999
- 37$50,000 to $59,999
- 25$150,000 to $174,999
- 3$175,000 to $199,999
- 78$200,000 to $249,999
- 128$250,000 to $299,999
- 495$300,000 to $399,999
- 726$400,000 to $499,999
- 555$500,000 to $749,999
- 32$1,000,000 to $1,499,999
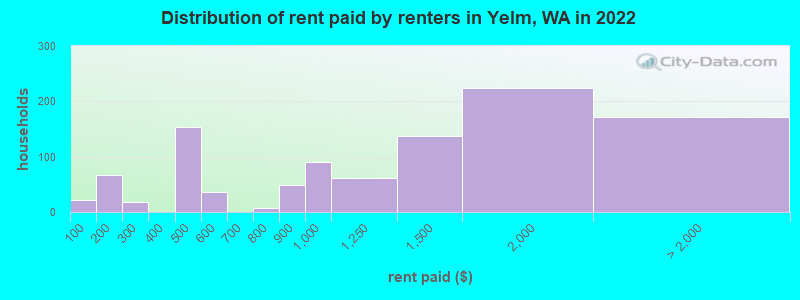
Rent paid by renters in 2022 in Yelm, WA
-
- 22Less than $100
- 66$150 to $199
- 18$200 to $249
- 153$450 to $499
- 13$500 to $549
- 24$550 to $599
- 7$750 to $799
- 48$800 to $899
- 89$900 to $999
- 62$1,000 to $1,249
- 138$1,250 to $1,499
- 223$1,500 to $1,999
- 78$2,000 to $2,499
- 73$3,500 or more
- 17No cash rent
Percentage of workers working in this county: 46.6%
Number of people working at home: 309 (6.0% of all workers)
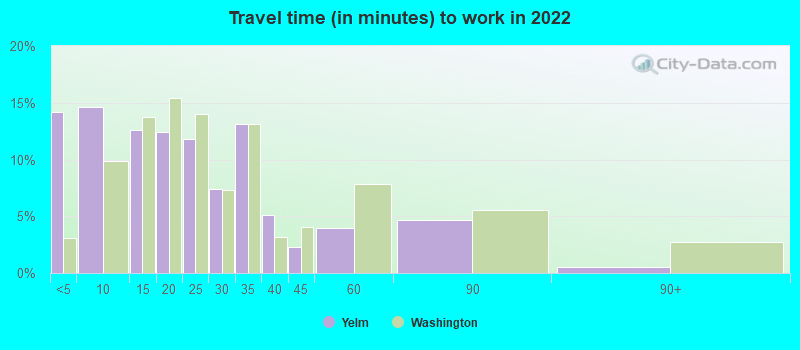
Travel time to work (commute)
- Less than 5 minutes: 131
- 5 to 9 minutes: 241
- 10 to 14 minutes: 517
- 15 to 19 minutes: 130
- 20 to 24 minutes: 300
- 25 to 29 minutes: 258
- 30 to 34 minutes: 711
- 35 to 39 minutes: 836
- 40 to 44 minutes: 324
- 45 to 59 minutes: 937
- 60 to 89 minutes: 151
- 90 or more minutes: 157
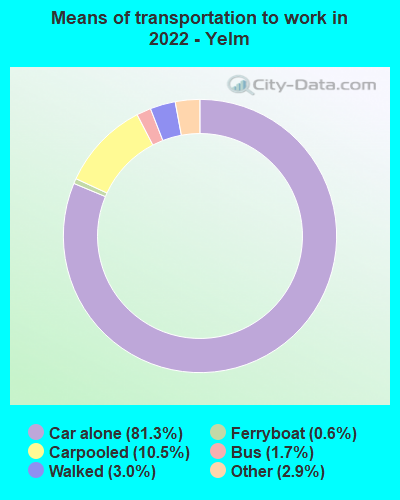
Means of transportation to work:
- Drove a car alone: 2,519 (69.9%)
- Carpooled: 309 (8.6%)
- Bus: 48 (1.3%)
- Ferryboat: 19 (0.5%)
- Taxi: 77 (2.1%)
- Walked: 172 (4.8%)
- Worked at home: 309 (8.6%)
- Unemployment by race in 2022
- Unemployment rate for White non-Hispanic residents
- 0.9%Males
- 1.0%Females
- Unemployment rate for Black residents
- 19.6%Females
- Unemployment rate for American Indian and Alaska Native residents
- 55.9%Males
- Unemployment rate for two or more race residents
- 16.7%Males
- 11.5%Females
- Unemployment rate for Hispanic or Latino residents
- 54.9%Females
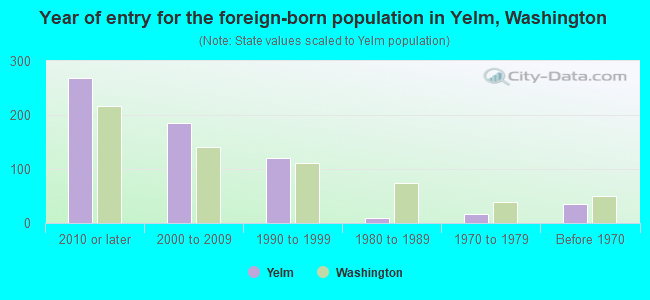
- Year of entry for the foreign-born population in Yelm, Washington
- 2692010 or later
- 1852000 to 2009
- 1201990 to 1999
- 91980 to 1989
- 161970 to 1979
- 36Before 1970
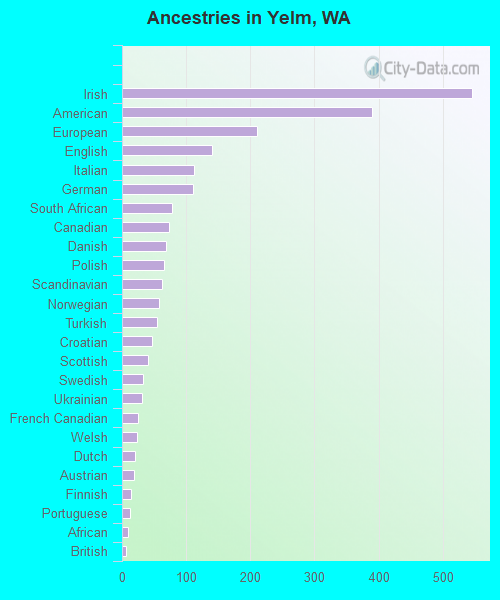
First ancestries reported:
- Irish: 545 (13.1%)
- American: 390 (9.3%)
- European: 210 (5.0%)
- English: 141 (3.4%)
- Italian: 112 (2.7%)
- German: 111 (2.7%)
- South African: 78 (1.9%)
- Canadian: 73 (1.7%)
- Danish: 69 (1.7%)
- Polish: 65 (1.6%)
- Scandinavian: 62 (1.5%)
- Norwegian: 58 (1.4%)
- Turkish: 55 (1.3%)
- Croatian: 46 (1.1%)
- Scottish: 41 (1.0%)
- Swedish: 32 (0.8%)
- Ukrainian: 31 (0.7%)
- French Canadian: 25 (0.6%)
- Welsh: 23 (0.6%)
- Dutch: 20 (0.5%)
- Austrian: 18 (0.4%)
- Finnish: 14 (0.3%)
- Portuguese: 12 (0.3%)
- African: 9 (0.2%)
- British: 7 (0.2%)
- French: 7 (0.2%)
- Lithuanian: 7 (0.2%)
- Greek: 5 (0.1%)
Most common places of birth for foreign-born residents (%):
| Yelm: | 14.2% (96) |
| Washington: | 21.1% (241,655) |
| Yelm: | 13.9% (94) |
| Washington: | 0.7% (8,049) |
| Yelm: | 9.8% (66) |
| Washington: | 0.3% (3,373) |
| Yelm: | 8.3% (56) |
| Washington: | 0.1% (720) |
| Yelm: | 8.0% (54) |
| Washington: | 1.6% (17,761) |
| Yelm: | 8.0% (54) |
| Washington: | 0.4% (4,963) |
| Yelm: | 5.5% (37) |
| Washington: | 0.3% (2,970) |
| Yelm: | 4.3% (29) |
| Washington: | 6.3% (71,661) |
| Yelm: | 3.9% (26) |
| Washington: | 0.9% (10,499) |
| Yelm: | 2.8% (19) |
| Washington: | 0.0% (344) |
| Yelm: | 2.5% (17) |
| Washington: | 1.5% (17,453) |
| Yelm: | 2.5% (17) |
| Washington: | 0.3% (3,147) |
| Yelm: | 2.1% (14) |
| Washington: | 4.3% (48,886) |
| Yelm: | 1.9% (13) |
| Washington: | 4.1% (47,238) |
Place of birth for U.S.-born residents:
- This state: 4,088
- Other state: 5,278
- Northeast: 582
- Midwest: 1,021
- South: 1,451
- West: 2,244
81.8% of Yelm residents lived in the same house 1 years ago.
Out of people who lived in different houses, 20.8% lived in this county.
Out of people who lived in different counties, 43.3% lived in Washington.
| Yelm: | 81.8% |
| State average: | 85.2% |
Education attainment for males 25 years and older:
- No schooling: 12
- Nursery to 4th grade: 0
- 5th and 6th grade: 0
- 7th and 8th grade: 0
- 9th grade: 23
- 10th grade: 35
- 11th grade: 47
- 12th grade, no diploma: 37
- High school graduate (or equivalency): 704
- Less than 1 year of college: 311
- Some college more than 1 year, no degree: 713
- Associate degree: 787
- Bachelor's degree: 389
- Master's degree: 115
- Professional school degree: 0
- Doctorate degree: 18

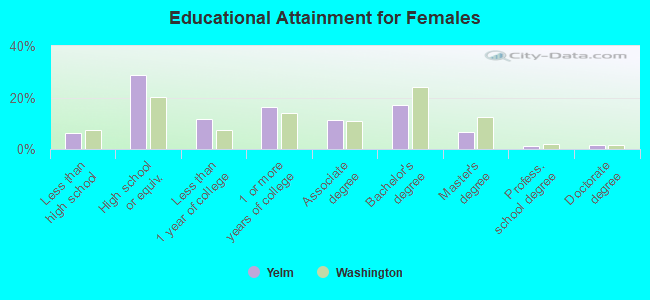
Education attainment for females 25 years and older:
- No schooling: 10
- Nursery to 4th grade: 5
- 5th and 6th grade: 0
- 7th and 8th grade: 0
- 9th grade: 117
- 10th grade: 26
- 11th grade: 0
- 12th grade, no diploma: 32
- High school graduate (or equivalency): 892
- Less than 1 year of college: 358
- Some college more than 1 year, no degree: 508
- Associate degree: 346
- Bachelor's degree: 532
- Master's degree: 210
- Professional school degree: 34
- Doctorate degree: 46
Housing units in structures:
- One, detached: 2,709
- One, attached: 96
- 3 or 4: 96
- 5 to 9: 176
- 10 to 19: 35
- 20 to 49: 187
- 50 or more: 51
- Mobile homes: 131
Housing units lacking complete kitchen facilities in 2022: 5.1%
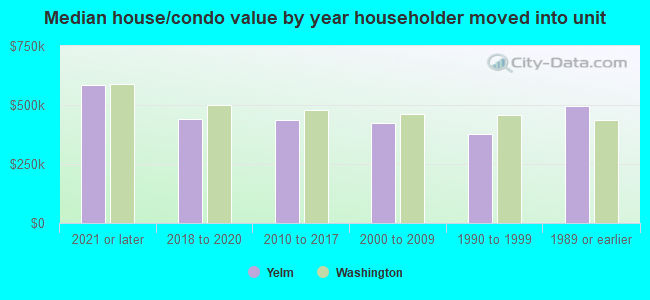
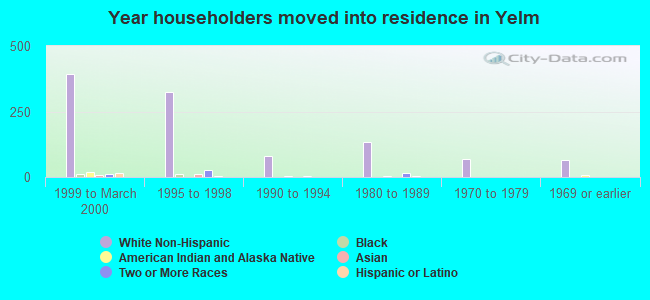
House/condo owner moved in on average 4 years ago
Renter moved in on average 3 years ago
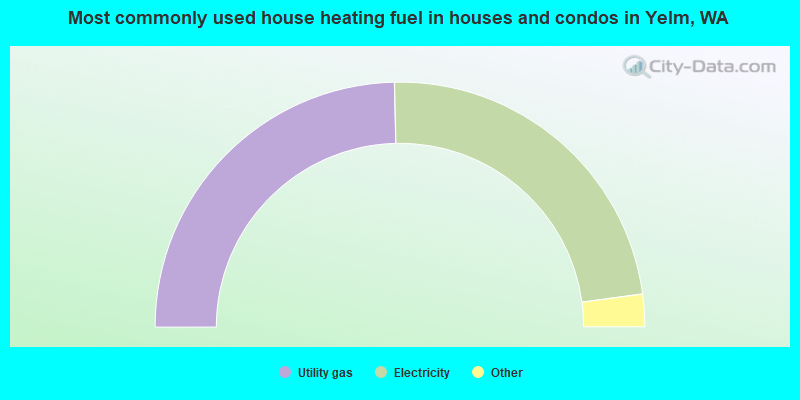
- 49.3%Utility gas
- 46.4%Electricity
- 2.7%Bottled, tank, or LP gas
- 1.6%Wood
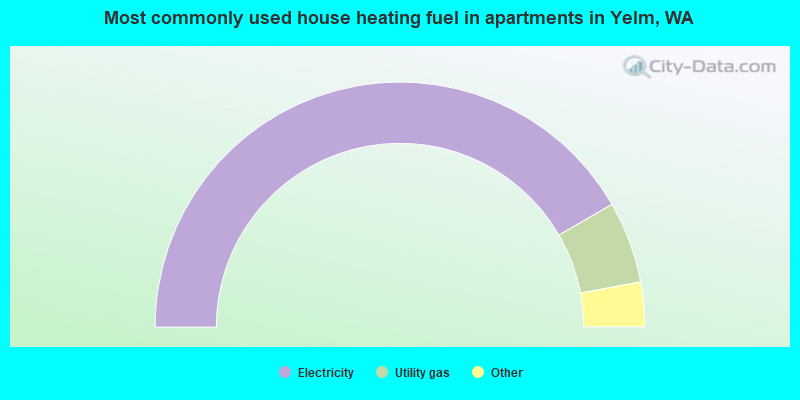
- 83.5%Electricity
- 10.8%Utility gas
- 3.3%Bottled, tank, or LP gas
- 1.5%Wood
- 0.9%Fuel oil, kerosene, etc.
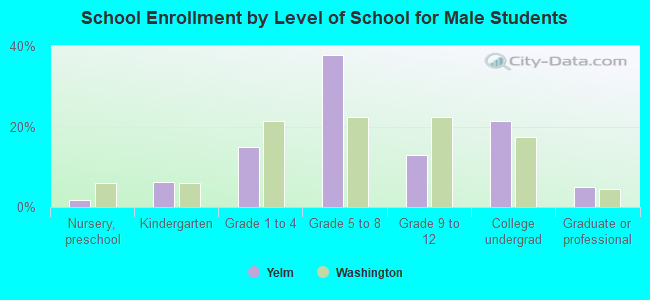
Private vs. public school enrollment:
| Here: | 2.3% |
| Washington: | 12.4% |
| Here: | 0.0% |
| Washington: | 9.2% |
| Here: | 16.2% |
| Washington: | 16.5% |