Yonkers, NY (New York) Houses and Residents
Estimated median house or condo value in 2022: $496,000 (it was $214,100 in 2000 )
Yonkers:
$496,000New York:
$400,400
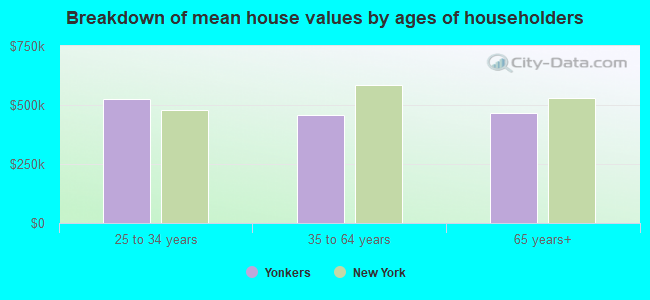
Lower value quartile - upper value quartile: $205,200 - $693,100Mean price in 2022: Detached houses: $740,378 Here:
$740,378State:
$476,719
Townhouses or other attached units: $529,241 Here:
$529,241State:
$699,270
In 2-unit structures: $554,092 Here:
$554,092State:
$713,077
In 3-to-4-unit structures: $591,417 Here:
$591,417State:
$764,568
In 5-or-more-unit structures: $247,935 Here:
$247,935State:
$912,009
Mobile homes: $632,923 Here:
$632,923State:
$88,925
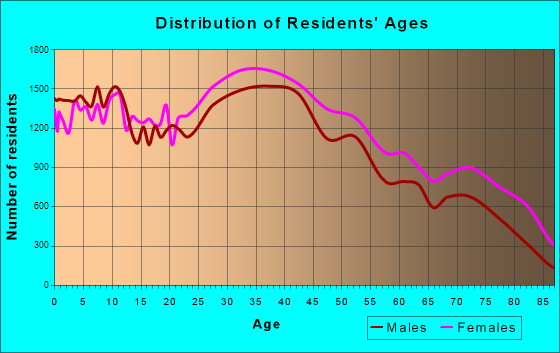
Total population: 200,667 (Urban population: 196,086, Rural population: 0)
Houses: 81,651 (79,175 occupied: 37,958 owner occupied, 41,217 renter occupied )
% of renters here:
52%State:
46%
Housing density: 4,517 houses/condos per square mile
Median price asked for vacant for-sale houses and condos in 2022: $210,430.
Median contract rent in 2022: $1,472 (lower quartile is $907, upper quartile is $1,911)
Median rent asked for vacant for-rent units in 2022: $1,124
Median gross rent in Yonkers, NY in 2022: $1,595
Housing units in Yonkers with a mortgage: 21,662 (2,546 second mortgage, 225 home equity loan, 1,906 both second mortgage and home equity loan )Houses without a mortgage: 624
Median household income for houses/condos with a mortgage: $129,309
Median household income for apartments without a mortgage: $75,520
Median monthly housing costs: $1,592
Data:
Median house or condo value ($)
Median house or condo value ($ change since 2000)
Median house or condo value ($) - White
Median house or condo value ($) - Black or African American
Median house or condo value ($) - Asian
Median house or condo value ($) - Hispanic or Latino
Median house or condo value ($) - American Indian and Alaska Native
Median house or condo value ($) - Multirace
Median house or condo value ($) - Other Race
Median price asked for mobile homes ($)
Household density (households per square mile)
Mean house or condo value by units in structure - 1, detached ($)
Mean house or condo value by units in structure - 1, attached ($)
Mean house or condo value by units in structure - 2 ($)
Mean house or condo value by units in structure by units in structure - 3 or 4 ($)
Mean house or condo value by units in structure - 5 or more ($)
Mean house or condo value by units in structure - Boat, RV, van, etc. ($)
Mean house or condo value by units in structure - Mobile home ($)
Median contract rent ($)
Median contract rent - Lower quartile ($)
Median contract rent - Upper quartile ($)
Median gross rent ($)
Urban houses (%)
Rural houses (%)
Houses occupied (%)
Houses occupied (% change since 2000)
Houses owner occupied (%)
Houses owner occupied (% change since 2000)
Houses renter occupied (%)
Houses renter occupied (% change since 2000)
Vacant housing units - For rent (%)
Vacant housing units - For rent (% change since 2000)
Vacant housing units - For sale only (%)
Vacant housing units - For sale only (% change since 2000)
Vacant housing units - Rented or sold, not occupied (%)
Vacant housing units - Rented or sold, not occupied (% change since 2000)
Vacant housing units - For seasonal, recreational, or occasional use (%)
Vacant housing units - For seasonal, recreational, or occasional use (% change since 2000)
Vacant housing units - For migrant workers (%)
Vacant housing units - For migrant workers (% change since 2000)
Vacant housing units - Other vacant (%)
Vacant housing units - Other vacant (% change since 2000)
Median monthly housing costs ($)
Median household income for houses/condos with a mortgage ($)
Median household income for houses/condos without a mortgage ($)
Median household income ($)
Median household income ($) - White
Median household income ($) - Black or African American
Median household income ($) - Asian
Median household income ($) - Hispanic or Latino
Median household income ($) - American Indian and Alaska Native
Median household income ($) - Multirace
Median household income ($) - Other Race
Mortgage status - with mortgage (%)
Mortgage status - with second mortgage (%)
Mortgage status - with home equity loan (%)
Mortgage status - with both second mortgage and home equity loan (%)
Mortgage status - without a mortgage (%)
Median year house/condo built
Median year apartment built
Household type by relationship - Male householder living alone (%)
Household type by relationship - Male householder not living alone (%)
Household type by relationship - Female householder living alone (%)
Household type by relationship - Female householder not living alone (%)
Household type by relationship - Opposite-Sex spouse (%)
Household type by relationship - Same-Sex spouse (%)
Household type by relationship - Opposite-Sex unmarried partner (%)
Household type by relationship - Same-Sex unmarried partner (%)
Household type by relationship - In group quarters (%)
Size of family households - 2-person household (%)
Size of family households - 3-person household (%)
Size of family households - 4-person household (%)
Size of family households - 5-person household (%)
Size of family households - 6-person household (%)
Size of family households - 7-or-more-person household (%)
Size of nonfamily households - 1-person household (%)
Size of nonfamily households - 2-person household (%)
Size of nonfamily households - 3-person household (%)
Size of nonfamily households - 4-person household (%)
Size of nonfamily households - 5-person household (%)
Size of nonfamily households - 6-person household (%)
Size of nonfamily households - 7-or-moreperson household (%)
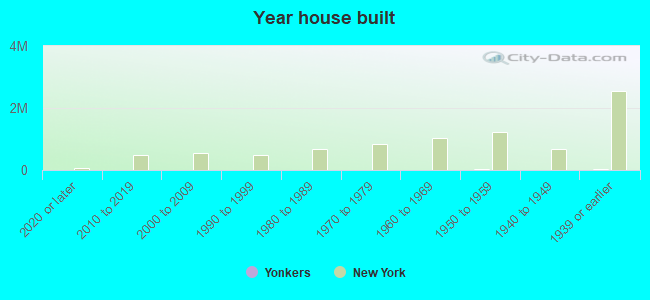
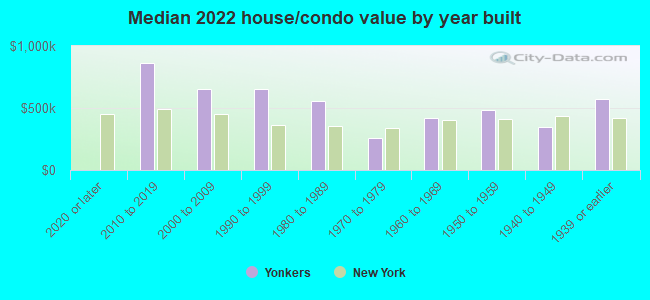
Year house built - Built 2010 or later (%)
Year house built - Built 2000 to 2009 (%)
Year house built - Built 1990 to 1999 (%)
Year house built - Built 1980 to 1989 (%)
Year house built - Built 1970 to 1979 (%)
Year house built - Built 1960 to 1969 (%)
Year house built - Built 1950 to 1959 (%)
Year house built - Built 1940 to 1949 (%)
Year house built - Built 1939 or earlier (%)
Median number of rooms in houses and condos
Median number of rooms in apartments
Median number of bedrooms in owner occupied houses
Mean number of bedrooms in owner occupied houses
Median number of bedrooms in renter occupied houses
Mean number of bedrooms in renter occupied houses
Median number of vehichles in owner occupied houses
Mean number of vehichles in owner occupied houses
Median number of vehichles in renter occupied houses
Mean number of vehichles in renter occupied houses
Rooms in owner-occupied houses - 1 room (%)
Rooms in owner-occupied houses - 2 rooms (%)
Rooms in owner-occupied houses - 3 rooms (%)
Rooms in owner-occupied houses - 4 rooms (%)
Rooms in owner-occupied houses - 5 rooms (%)
Rooms in owner-occupied houses - 6 rooms (%)
Rooms in owner-occupied houses - 7 rooms (%)
Rooms in owner-occupied houses - 8 rooms (%)
Rooms in owner-occupied houses - 9+ rooms (%)
Rooms in renter-occupied houses - 1 room (%)
Rooms in renter-occupied houses - 2 rooms (%)
Rooms in renter-occupied houses - 3 rooms (%)
Rooms in renter-occupied houses - 4 rooms (%)
Rooms in renter-occupied houses - 5 rooms (%)
Rooms in renter-occupied houses - 6 rooms (%)
Rooms in renter-occupied houses - 7 rooms (%)
Rooms in renter-occupied houses - 8 rooms (%)
Rooms in renter-occupied houses - 9+ rooms (%)
Bedrooms in owner-occupied houses - no bedrooms (%)
Bedrooms in owner-occupied houses - 1 bedroom (%)
Bedrooms in owner-occupied houses - 2 bedrooms (%)
Bedrooms in owner-occupied houses - 3 bedrooms (%)
Bedrooms in owner-occupied houses - 4 bedrooms (%)
Bedrooms in owner-occupied houses - 5+ bedrooms (%)
Bedrooms in renter-occupied houses - no bedrooms (%)
Bedrooms in renter-occupied houses - 1 bedroom (%)
Bedrooms in renter-occupied houses - 2 bedrooms (%)
Bedrooms in renter-occupied houses - 3 bedrooms (%)
Bedrooms in renter-occupied houses - 4 bedrooms (%)
Bedrooms in renter-occupied houses - 5+ bedrooms (%)
Vehicles available in owner-occupied houses - no vehicle available (%)
Vehicles available in owner-occupied houses - 1 vehicle available(%)
Vehicles available in owner-occupied houses - 2 Vehicles available (%)
Vehicles available in owner-occupied houses - 3 Vehicles available (%)
Vehicles available in owner-occupied houses - 4 Vehicles available (%)
Vehicles available in owner-occupied houses - 5+ Vehicles available (%)
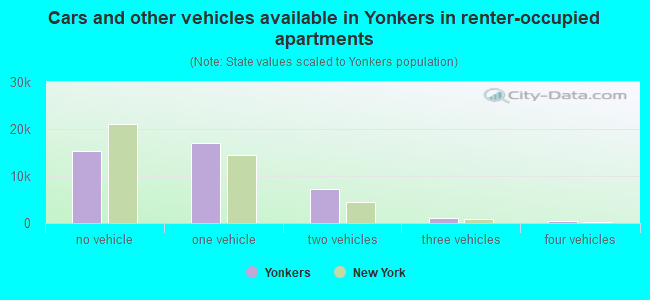
Vehicles available in renter-occupied houses - no vehicle available (%)
Vehicles available in renter-occupied houses - 1 vehicle available (%)
Vehicles available in renter-occupied houses - 2 Vehicles available (%)
Vehicles available in renter-occupied houses - 3 Vehicles available (%)
Vehicles available in renter-occupied houses - 4 Vehicles available (%)
Vehicles available in renter-occupied houses - 5+ Vehicles available (%)
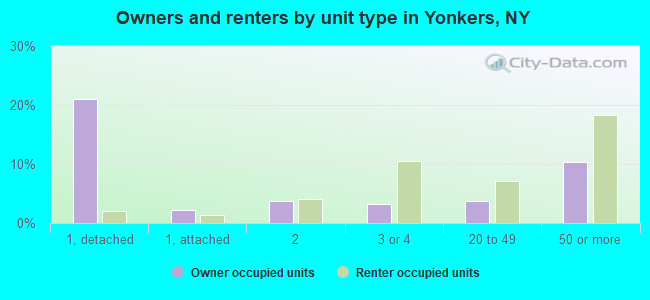
Housing units in structures - 1, detached (%)
Housing units in structures - 1, attached (%)
Housing units in structures - 2 (%)
Housing units in structures - 3 or 4 (%)
Housing units in structures - 5 to 9 (%)
Housing units in structures - 10 to 19 (%)
Housing units in structures - 20 to 49 (%)
Housing units in structures - 50 or more (%)
Housing units in structures - Mobile home (%)
Housing units in structures - Boat, RV, van, etc. (%)
Housing units in structures - Owners - 1, detached (%)
Housing units in structures - Owners - 1, attached (%)
Housing units in structures - Owners - 2 (%)
Housing units in structures - Owners - 3 or 4 (%)
Housing units in structures - Owners - 5 to 9 (%)
Housing units in structures - Owners - 10 to 19 (%)
Housing units in structures - Owners - 20 to 49 (%)
Housing units in structures - Owners - 50 or more (%)
Housing units in structures - Owners - Mobile home (%)
Housing units in structures - Owners - Boat, RV, van, etc. (%)
Housing units in structures - Renters - 1, detached (%)
Housing units in structures - Renters - 1, attached (%)
Housing units in structures - Renters - 2 (%)
Housing units in structures - Renters - 3 or 4 (%)
Housing units in structures - Renters - 5 to 9 (%)
Housing units in structures - Renters - 10 to 19 (%)
Housing units in structures - Renters - 20 to 49 (%)
Housing units in structures - Renters - 50 or more (%)
Housing units in structures - Renters - Mobile home (%)
Housing units in structures - Renters - Boat, RV, van, etc. (%)
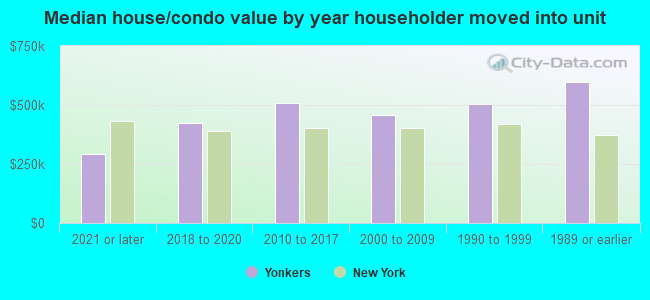
House/condo owner moved in on average (years ago)
Renter moved in on average (years ago)
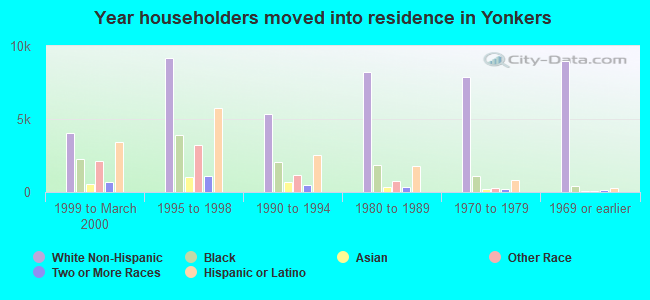
Year householder moved into unit - Moved in 1999 to March 2000 (%)
Year householder moved into unit - Moved in 1999 to March 2000 (%) - White
Year householder moved into unit - Moved in 1999 to March 2000 (%) - Black or African American
Year householder moved into unit - Moved in 1999 to March 2000 (%) - Asian
Year householder moved into unit - Moved in 1999 to March 2000 (%) - Hispanic or Latino
Year householder moved into unit - Moved in 1999 to March 2000 (%) - American Indian and Alaska Native
Year householder moved into unit - Moved in 1999 to March 2000 (%) - Multirace
Year householder moved into unit - Moved in 1999 to March 2000 (%) - Other Race
Year householder moved into unit - Moved in 1995 to 1998 (%)
Year householder moved into unit - Moved in 1995 to 1998 (%) - White
Year householder moved into unit - Moved in 1995 to 1998 (%) - Black or African American
Year householder moved into unit - Moved in 1995 to 1998 (%) - Asian
Year householder moved into unit - Moved in 1995 to 1998 (%) - Hispanic or Latino
Year householder moved into unit - Moved in 1995 to 1998 (%) - American Indian and Alaska Native
Year householder moved into unit - Moved in 1995 to 1998 (%) - Multirace
Year householder moved into unit - Moved in 1995 to 1998 (%) - Other Race
Year householder moved into unit - Moved in 1990 to 1994 (%)
Year householder moved into unit - Moved in 1990 to 1994 (%) - White
Year householder moved into unit - Moved in 1990 to 1994 (%) - Black or African American
Year householder moved into unit - Moved in 1990 to 1994 (%) - Asian
Year householder moved into unit - Moved in 1990 to 1994 (%) - Hispanic or Latino
Year householder moved into unit - Moved in 1990 to 1994 (%) - American Indian and Alaska Native
Year householder moved into unit - Moved in 1990 to 1994 (%) - Multirace
Year householder moved into unit - Moved in 1990 to 1994 (%) - Other Race
Year householder moved into unit - Moved in 1980 to 1989 (%)
Year householder moved into unit - Moved in 1980 to 1989 (%) - White
Year householder moved into unit - Moved in 1980 to 1989 (%) - Black or African American
Year householder moved into unit - Moved in 1980 to 1989 (%) - Asian
Year householder moved into unit - Moved in 1980 to 1989 (%) - Hispanic or Latino
Year householder moved into unit - Moved in 1980 to 1989 (%) - American Indian and Alaska Native
Year householder moved into unit - Moved in 1980 to 1989 (%) - Multirace
Year householder moved into unit - Moved in 1980 to 1989 (%) - Other Race
Year householder moved into unit - Moved in 1970 to 1979 (%)
Year householder moved into unit - Moved in 1970 to 1979 (%) - White
Year householder moved into unit - Moved in 1970 to 1979 (%) - Black or African American
Year householder moved into unit - Moved in 1970 to 1979 (%) - Asian
Year householder moved into unit - Moved in 1970 to 1979 (%) - Hispanic or Latino
Year householder moved into unit - Moved in 1970 to 1979 (%) - American Indian and Alaska Native
Year householder moved into unit - Moved in 1970 to 1979 (%) - Multirace
Year householder moved into unit - Moved in 1970 to 1979 (%) - Other Race
Year householder moved into unit - Moved in 1969 or earlier (%)
Year householder moved into unit - Moved in 1969 or earlier (%) - White
Year householder moved into unit - Moved in 1969 or earlier (%) - Black or African American
Year householder moved into unit - Moved in 1969 or earlier (%) - Asian
Year householder moved into unit - Moved in 1969 or earlier (%) - Hispanic or Latino
Year householder moved into unit - Moved in 1969 or earlier (%) - American Indian and Alaska Native
Year householder moved into unit - Moved in 1969 or earlier (%) - Multirace
Year householder moved into unit - Moved in 1969 or earlier (%) - Other Race
Housing units lacking complete plumbing facilities (%)
Housing units lacking complete kitchen facilities (%)
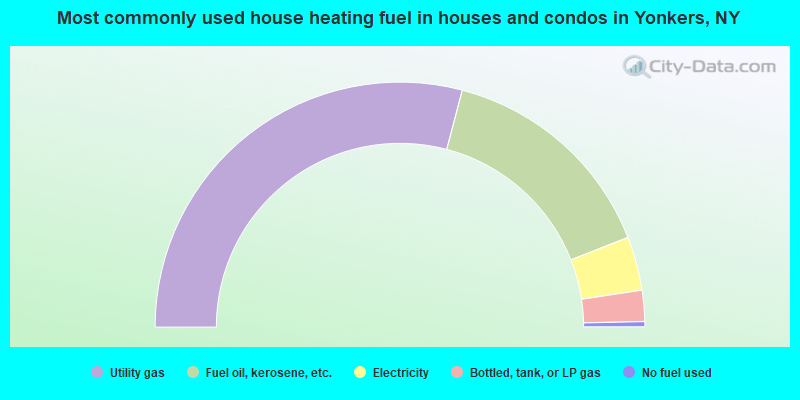
House heating fuel used in houses and condos - Utility gas (%)
House heating fuel used in houses and condos - Bottled, tank, or LP gas (%)
House heating fuel used in houses and condos - Electricity (%)
House heating fuel used in houses and condos - Fuel oil, kerosene, etc. (%)
House heating fuel used in houses and condos - Coal or coke (%)
House heating fuel used in houses and condos - Wood (%)
House heating fuel used in houses and condos - Solar energy (%)
House heating fuel used in houses and condos - Other fuel (%)
House heating fuel used in houses and condos - No fuel used (%)
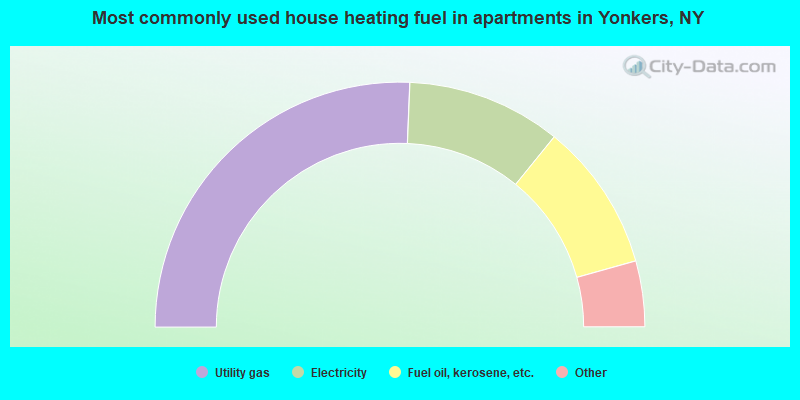
House heating fuel used in apartments - Utility gas (%)
House heating fuel used in apartments - Bottled, tank, or LP gas (%)
House heating fuel used in apartments - Electricity (%)
House heating fuel used in apartments - Fuel oil, kerosene, etc. (%)
House heating fuel used in apartments - Coal or coke (%)
House heating fuel used in apartments - Wood (%)
House heating fuel used in apartments - Solar energy (%)
House heating fuel used in apartments - Other fuel (%)
House heating fuel used in apartments - No fuel used (%)
Latest news about housing in Yonkers, NY collected exclusively by city-data.com from local newspapers, TV, and radio stations
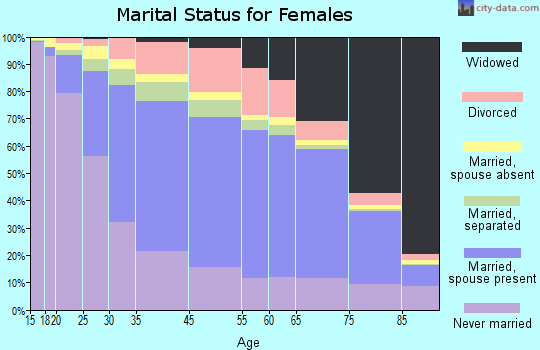
Median year house/condo built: 1954Median year apartment built: 1965Household type by relationship:
Households: 208,112
Male householders: 37,104 (11,405 living alone ), Female householders: 42,071 (14,684 living alone )30,552 spouses (30,429 opposite-sex spouses ), 6,088 unmarried partners , (5,692 opposite-sex unmarried partners ), 66,587 children (62,932 natural , 672 adopted , 2,983 stepchildren ), 5,675 grandchildren , 3,184 brothers or sisters , 5,032 parents , 0 foster children , 4,528 other relatives , 3,858 non-relatives In group quarters: 3,433
Size of family households: 17,862 2-persons , 9,858 3-persons , 11,669 4-persons , 6,112 5-persons , 1,867 6-persons , 1,279 7-or-more-persons .
Size of nonfamily households: 26,089 1-person , 4,203 2-persons , 236 3-persons .
25,576 married couples with children. single-parent households (2,791 men , 10,262 women ).
47.5% of residents of Yonkers speak English at home. of residents speak Spanish at home (63% speak English very well , 21% speak English well , 11% speak English not well , 4% don't speak English at all ).of residents speak other Indo-European language at home (64% speak English very well , 23% speak English well , 12% speak English not well , 1% don't speak English at all ).of residents speak Asian or Pacific Island language at home (62% speak English very well , 25% speak English well , 9% speak English not well , 4% don't speak English at all ).of residents speak other language at home (83% speak English very well , 12% speak English well , 5% speak English not well ).
Foreign born population: 70,535 (33.9%)of them are naturalized citizens )
Median number of rooms in houses and condos:
Median number of rooms in apartments
Owner-occupied Renter-occupied
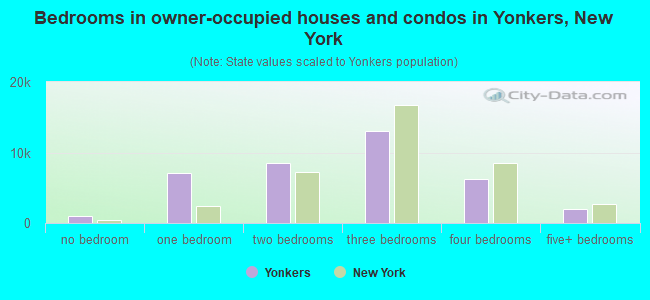
Bedrooms in owner-occupied houses and condos in Yonkers, New York
1,041 no bedroom 7,084 1 bedroom 8,497 2 bedrooms 13,006 3 bedrooms 6,288 4 bedrooms 2,042 5+ bedrooms
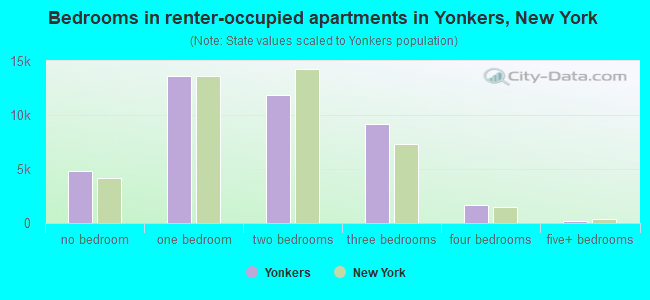
Bedrooms in renter-occupied apartments in Yonkers, New York
4,820 no bedroom 13,627 1 bedroom 11,844 2 bedrooms 9,129 3 bedrooms 1,633 4 bedrooms 164 5+ bedrooms
Owner-occupied Renter-occupied
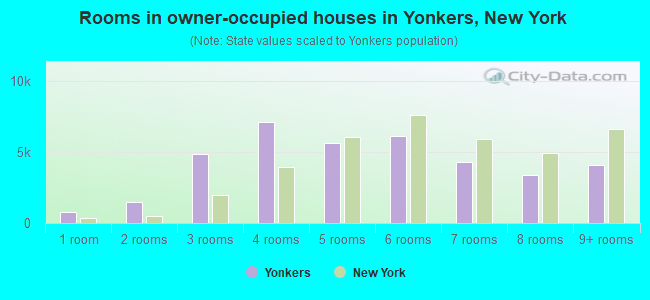
Rooms in owner-occupied houses in Yonkers, New York
768 1 room 1,511 2 rooms 4,900 3 rooms 7,144 4 rooms 5,667 5 rooms 6,116 6 rooms 4,317 7 rooms 3,407 8 rooms 4,128 9+ rooms
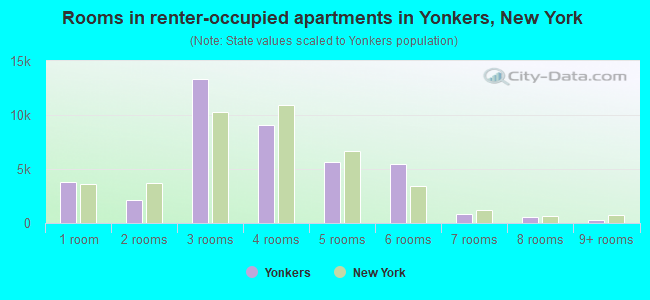
Rooms in renter-occupied apartments in Yonkers, New York
3,818 1 room 2,175 2 rooms 13,327 3 rooms 9,099 4 rooms 5,646 5 rooms 5,461 6 rooms 802 7 rooms 600 8 rooms 289 9+ rooms
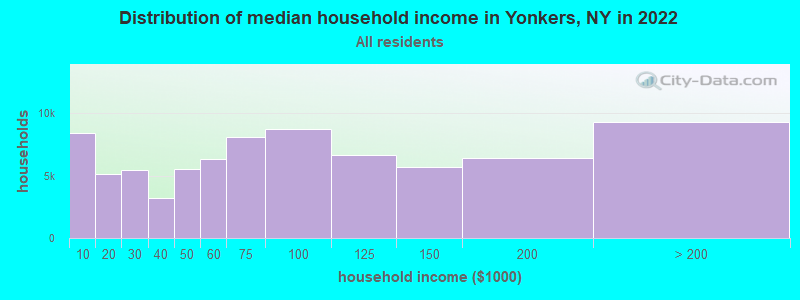
Yonkers, NY household income distribution 8,403 Less than $10,0005,113 $10,000 to $19,9995,501 $20,000 to $29,9993,216 $30,000 to $39,9995,557 $40,000 to $49,9996,319 $50,000 to $59,9998,150 $60,000 to $74,9998,790 $75,000 to $99,9996,642 $100,000 to $124,9995,712 $125,000 to $149,9996,455 $150,000 to $199,9999,317 $200,000 or more
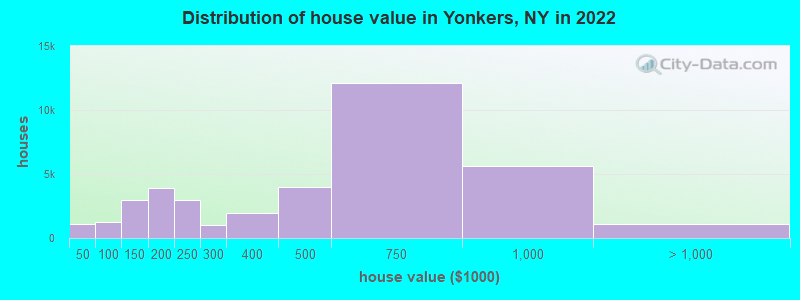
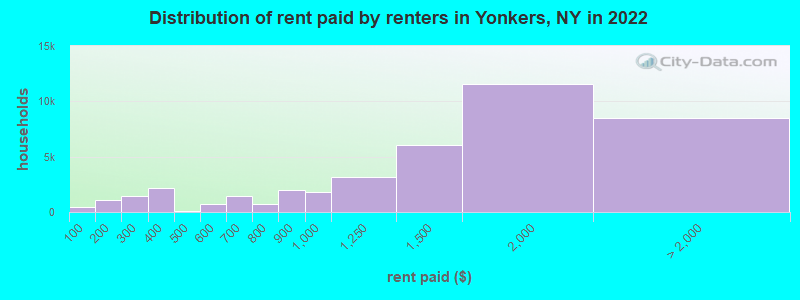
Home value of owner - occupied houses in 2022 in Yonkers, NY 791 Less than $10,000107 $10,000 to $14,99974 $25,000 to $29,99949 $35,000 to $39,99975 $40,000 to $49,999295 $50,000 to $59,999104 $60,000 to $69,999549 $80,000 to $89,999212 $90,000 to $99,9991,789 $100,000 to $124,9991,194 $125,000 to $149,9992,682 $150,000 to $174,9991,259 $175,000 to $199,9992,960 $200,000 to $249,9991,036 $250,000 to $299,9991,985 $300,000 to $399,9993,978 $400,000 to $499,99912,079 $500,000 to $749,9995,661 $750,000 to $999,999913 $1,000,000 to $1,499,99955 $1,500,000 to $1,999,999111 $2,000,000 or moreRent paid by renters in 2022 in Yonkers, NY 412 Less than $100136 $100 to $149988 $150 to $199818 $200 to $249587 $250 to $2991,162 $300 to $349962 $350 to $399114 $400 to $449517 $500 to $549230 $550 to $599698 $600 to $649750 $650 to $699680 $700 to $74974 $750 to $7991,954 $800 to $8991,808 $900 to $9993,133 $1,000 to $1,2496,089 $1,250 to $1,49911,595 $1,500 to $1,9996,060 $2,000 to $2,4991,373 $2,500 to $2,999299 $3,000 to $3,499417 $3,500 or more361 No cash rent
Percentage of workers working in this county: 59.8%Number of people working at home: 7,081 (7.2% of all workers )
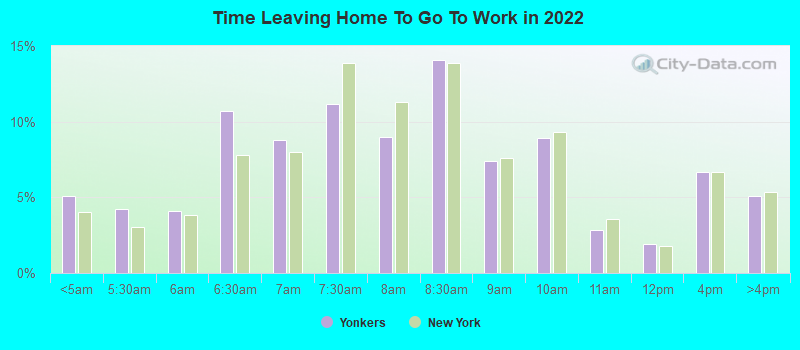
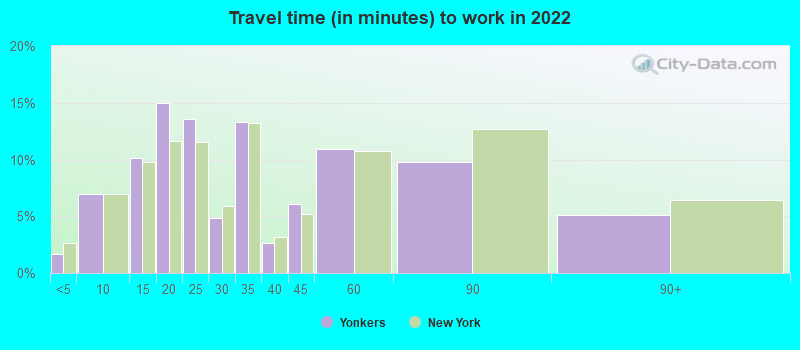
Travel time to work (commute)
Less than 5 minutes: 5795 to 9 minutes: 4,13710 to 14 minutes: 9,55915 to 19 minutes: 11,18120 to 24 minutes: 9,35725 to 29 minutes: 5,12330 to 34 minutes: 13,81435 to 39 minutes: 2,47440 to 44 minutes: 5,60345 to 59 minutes: 10,46760 to 89 minutes: 10,54890 or more minutes: 8,164
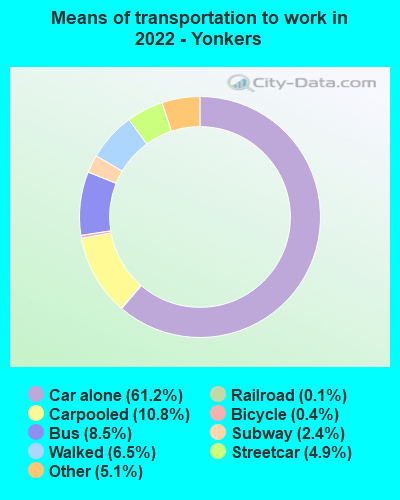
Means of transportation to work:
Drove a car alone: 34,989 (54.5%)Carpooled: 6,178 (9.6%)Bus : 4,866 (7.6%)Subway or elevated rail : 2,805 (4.4%)Long-distance train or commuter rail : 1,360 (2.1%)Light rail, streetcar or trolley : 67 (0.1%)Taxi: 2,919 (4.5%)Bicycle: 241 (0.4%)Walked: 3,722 (5.8%)Worked at home: 7,081 (11.0%)
Unemployment by race in 2022
Unemployment rate for White non-Hispanic residents 2.0% Males3.2% FemalesUnemployment rate for Black residents 5.2% Males8.8% FemalesUnemployment rate for American Indian and Alaska Native residents 5.8% Males3.3% FemalesUnemployment rate for Asian residents 1.2% MalesUnemployment rate for other race residents 5.0% Males8.9% FemalesUnemployment rate for two or more race residents 1.8% Males5.4% FemalesUnemployment rate for Hispanic or Latino residents 5.6% Males7.5% Females
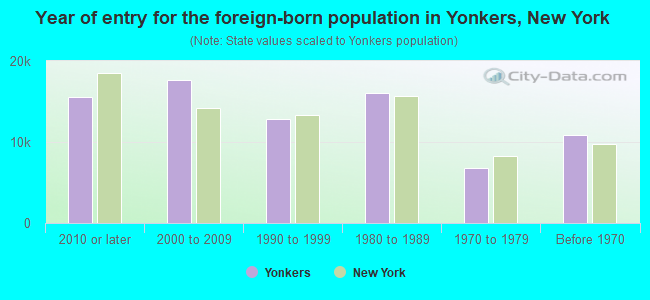
Year of entry for the foreign-born population in Yonkers, New York
15,556 2010 or later 17,641 2000 to 2009 12,856 1990 to 1999 16,100 1980 to 1989 6,806 1970 to 1979 10,819 Before 1970
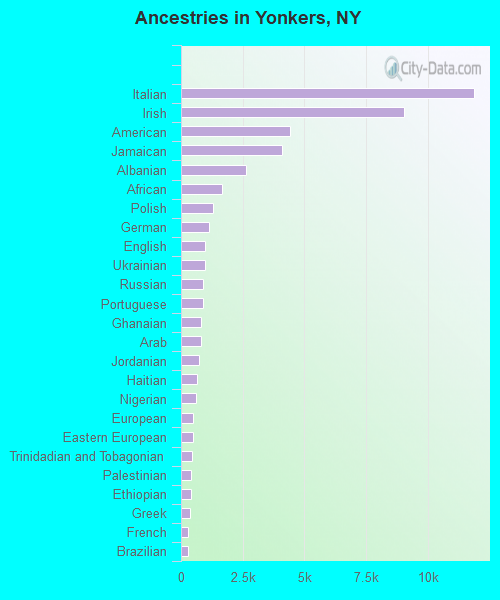
First ancestries reported:
Italian: 11,897 (9.2%)
Irish: 9,029 (7.0%)
American: 4,426 (3.4%)
Jamaican: 4,099 (3.2%)
Albanian: 2,624 (2.0%)
African: 1,655 (1.3%)
Polish: 1,317 (1.0%)
German: 1,147 (0.9%)
English: 978 (0.8%)
Ukrainian: 963 (0.7%)
Russian: 882 (0.7%)
Portuguese: 877 (0.7%)
Ghanaian: 803 (0.6%)
Arab: 794 (0.6%)
Jordanian: 723 (0.6%)
Haitian: 662 (0.5%)
Nigerian: 625 (0.5%)
European: 503 (0.4%)
Eastern European: 490 (0.4%)
Trinidadian and Tobagonian: 426 (0.3%)
Palestinian: 414 (0.3%)
Ethiopian: 398 (0.3%)
Greek: 366 (0.3%)
French: 301 (0.2%)
Brazilian: 289 (0.2%)
Guyanese: 257 (0.2%)
British West Indian: 252 (0.2%)
West Indian: 247 (0.2%)
Scottish: 245 (0.2%)
Macedonian: 231 (0.2%)
Romanian: 220 (0.2%)
Egyptian: 188 (0.1%)
Slovak: 147 (0.1%)
Assyrian: 133 (0.1%)
Cape Verdean: 122 (0.09%)
Moroccan: 107 (0.08%)
Hungarian: 101 (0.08%)
Bulgarian: 92 (0.07%)
Austrian: 90 (0.07%)
Czech: 90 (0.07%)
Croatian: 79 (0.06%)
Armenian: 78 (0.06%)
Dutch: 76 (0.06%)
Scotch-Irish: 76 (0.06%)
Sierra Leonean: 70 (0.05%)
Swedish: 68 (0.05%)
Iranian: 60 (0.05%)
British: 55 (0.04%)
Norwegian: 55 (0.04%)
Bermudan: 42 (0.03%)
Welsh: 42 (0.03%)
Latvian: 40 (0.03%)
Lebanese: 40 (0.03%)
Afghan: 39 (0.03%)
Czechoslovakian: 37 (0.03%)
Slavic: 36 (0.03%)
Serbian: 35 (0.03%)
Sudanese: 34 (0.03%)
Turkish: 30 (0.02%)
Belizean: 28 (0.02%)
Barbadian: 24 (0.02%)
Swiss: 22 (0.02%)
Kenyan: 22 (0.02%)
South African: 20 (0.02%)
Israeli: 12 (0.01%)
French Canadian: 8 (0.01%)
Syrian: 7 (0.01%)
Lithuanian: 7 (0.01%)
Most common places of birth for foreign-born residents (%): Dominican Republic Yonkers:
27.8% (18,476)New York:
11.1% (501,040)
Mexico Yonkers:
10.9% (7,250)New York:
4.8% (214,559)
Ecuador Yonkers:
5.1% (3,396)New York:
3.9% (177,448)
Jamaica Yonkers:
4.3% (2,831)New York:
5.0% (227,557)
India Yonkers:
4.0% (2,658)New York:
3.5% (158,432)
Ireland Yonkers:
3.6% (2,405)New York:
0.6% (26,772)
Philippines Yonkers:
3.3% (2,195)New York:
2.0% (91,070)
Ghana Yonkers:
2.6% (1,748)New York:
0.9% (39,058)
Colombia Yonkers:
2.3% (1,526)New York:
2.5% (111,920)
Italy Yonkers:
2.1% (1,402)New York:
1.8% (81,374)
El Salvador Yonkers:
1.6% (1,079)New York:
2.4% (108,067)
Honduras Yonkers:
1.6% (1,057)New York:
1.2% (55,571)
Guatemala Yonkers:
1.5% (1,021)New York:
1.4% (61,245)
Portugal Yonkers:
1.5% (998)New York:
0.2% (10,519)
Place of birth for U.S.-born residents:
This state: 110,606Other state: 16,668Northeast: 7,559Midwest: 2,066South: 5,410West: 1,633 89.9% of Yonkers residents lived in the same house 1 years ago.
Out of people who lived in different houses, 29.1% lived in this county.
Out of people who lived in different counties, 82.9% lived in New York.
Yonkers:
89.9%State average:
89.6%
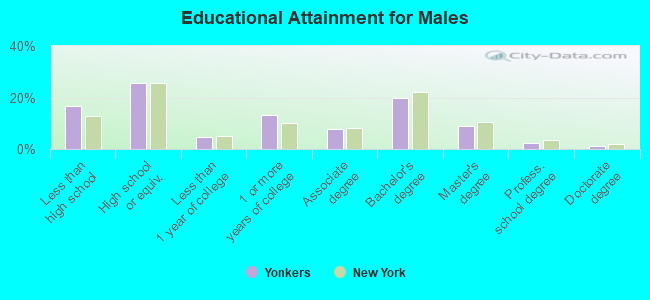
Education attainment for males 25 years and older:
No schooling: 2,761Nursery to 4th grade: 7005th and 6th grade: 8657th and 8th grade: 2,2439th grade: 76210th grade: 80511th grade: 1,13612th grade, no diploma: 2,373High school graduate (or equivalency): 17,566Less than 1 year of college: 3,139Some college more than 1 year, no degree: 9,032Associate degree: 5,424Bachelor's degree: 13,580Master's degree: 6,289Professional school degree: 1,619Doctorate degree: 740
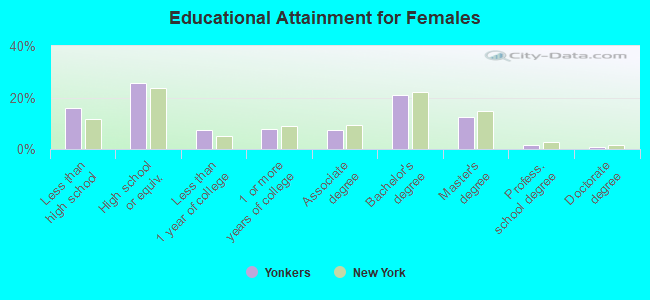
Education attainment for females 25 years and older:
No schooling: 3,014Nursery to 4th grade: 6255th and 6th grade: 1,8797th and 8th grade: 7899th grade: 1,17410th grade: 1,29911th grade: 1,11312th grade, no diploma: 2,113High school graduate (or equivalency): 19,506Less than 1 year of college: 5,641Some college more than 1 year, no degree: 5,769Associate degree: 5,734Bachelor's degree: 15,917Master's degree: 9,277Professional school degree: 1,210Doctorate degree: 735
Housing units in structures:
One, detached: 20,734One, attached: 3,360Two: 7,0123 or 4: 6,3885 to 9: 3,33610 to 19: 5,59420 to 49: 10,54650 or more: 24,514Mobile homes: 167Housing units lacking complete plumbing facilities in 2022: 0.6%Housing units lacking complete kitchen facilities in 2022: 0.9%House/condo owner moved in on average 14 years ago
Renter moved in on average 5 years ago
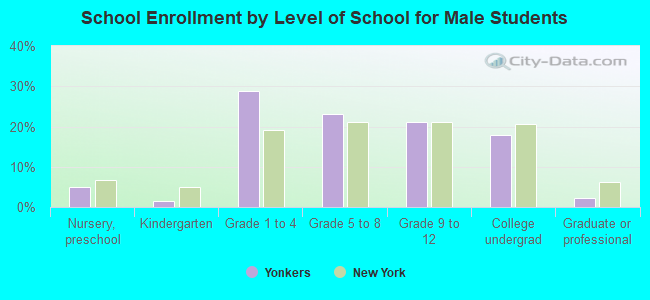
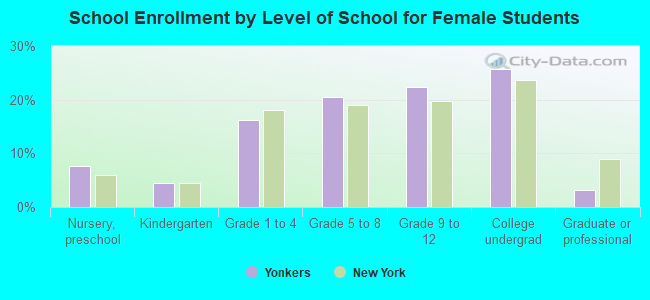
Private vs. public school enrollment:
Students in private schools in grades 1 to 8 (elementary and middle school): 2,965 Students in private schools in grades 9 to 12 (high school): 1,561 Students in private undergraduate colleges: 6,110