Yuba City, CA (California) Houses and Residents
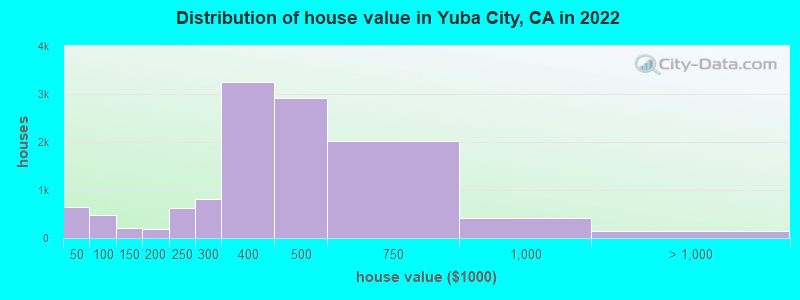
Estimated median house or condo value in 2022: $452,200 (it was $112,300 in 2000 )
Yuba City:
$452,200California:
$715,900
Lower value quartile - upper value quartile: $329,700 - $586,500Mean price in 2022: Detached houses: $469,437 Here:
$469,437State:
$988,808
Townhouses or other attached units: $457,766 Here:
$457,766State:
$838,546
In 2-unit structures: $954,134 Here:
$954,134State:
$1,138,100
In 3-to-4-unit structures: $166,675 Here:
$166,675State:
$824,253
In 5-or-more-unit structures: $188,165 Here:
$188,165State:
$730,996
Mobile homes: $82,718 Here:
$82,718State:
$184,506
Occupied boats, RVs, vans, etc.: $17,910 Here:
$17,910State:
$204,957
Total population: 65,773 (Urban population: 36,567, Rural population: 19 (all nonfarm) )
Houses: 24,329 (23,949 occupied: 13,812 owner occupied, 10,137 renter occupied )
% of renters here:
42%State:
44%
Housing density: 2,597 houses/condos per square mile
Median price asked for vacant for-sale houses and condos in 2022: $273,728.
Median contract rent in 2022: $1,194 (lower quartile is $977, upper quartile is $1,517)
Median rent asked for vacant for-rent units in 2022: $1,932
Median gross rent in Yuba City, CA in 2022: $1,448
Housing units in Yuba City with a mortgage: 8,171 (395 second mortgage, 40 home equity loan, 315 both second mortgage and home equity loan )Houses without a mortgage: 84
Median household income for houses/condos with a mortgage: $90,921
Median household income for apartments without a mortgage: $47,196
Median monthly housing costs: $1,446
Data:
Median house or condo value ($)
Median house or condo value ($ change since 2000)
Median house or condo value ($) - White
Median house or condo value ($) - Black or African American
Median house or condo value ($) - Asian
Median house or condo value ($) - Hispanic or Latino
Median house or condo value ($) - American Indian and Alaska Native
Median house or condo value ($) - Multirace
Median house or condo value ($) - Other Race
Median price asked for mobile homes ($)
Household density (households per square mile)
Mean house or condo value by units in structure - 1, detached ($)
Mean house or condo value by units in structure - 1, attached ($)
Mean house or condo value by units in structure - 2 ($)
Mean house or condo value by units in structure by units in structure - 3 or 4 ($)
Mean house or condo value by units in structure - 5 or more ($)
Mean house or condo value by units in structure - Boat, RV, van, etc. ($)
Mean house or condo value by units in structure - Mobile home ($)
Median contract rent ($)
Median contract rent - Lower quartile ($)
Median contract rent - Upper quartile ($)
Median gross rent ($)
Urban houses (%)
Rural houses (%)
Houses occupied (%)
Houses occupied (% change since 2000)
Houses owner occupied (%)
Houses owner occupied (% change since 2000)
Houses renter occupied (%)
Houses renter occupied (% change since 2000)
Vacant housing units - For rent (%)
Vacant housing units - For rent (% change since 2000)
Vacant housing units - For sale only (%)
Vacant housing units - For sale only (% change since 2000)
Vacant housing units - Rented or sold, not occupied (%)
Vacant housing units - Rented or sold, not occupied (% change since 2000)
Vacant housing units - For seasonal, recreational, or occasional use (%)
Vacant housing units - For seasonal, recreational, or occasional use (% change since 2000)
Vacant housing units - For migrant workers (%)
Vacant housing units - For migrant workers (% change since 2000)
Vacant housing units - Other vacant (%)
Vacant housing units - Other vacant (% change since 2000)
Median monthly housing costs ($)
Median household income for houses/condos with a mortgage ($)
Median household income for houses/condos without a mortgage ($)
Median household income ($)
Median household income ($) - White
Median household income ($) - Black or African American
Median household income ($) - Asian
Median household income ($) - Hispanic or Latino
Median household income ($) - American Indian and Alaska Native
Median household income ($) - Multirace
Median household income ($) - Other Race
Mortgage status - with mortgage (%)
Mortgage status - with second mortgage (%)
Mortgage status - with home equity loan (%)
Mortgage status - with both second mortgage and home equity loan (%)
Mortgage status - without a mortgage (%)
Median year house/condo built
Median year apartment built
Household type by relationship - Male householder living alone (%)
Household type by relationship - Male householder not living alone (%)
Household type by relationship - Female householder living alone (%)
Household type by relationship - Female householder not living alone (%)
Household type by relationship - Opposite-Sex spouse (%)
Household type by relationship - Same-Sex spouse (%)
Household type by relationship - Opposite-Sex unmarried partner (%)
Household type by relationship - Same-Sex unmarried partner (%)
Household type by relationship - In group quarters (%)
Size of family households - 2-person household (%)
Size of family households - 3-person household (%)
Size of family households - 4-person household (%)
Size of family households - 5-person household (%)
Size of family households - 6-person household (%)
Size of family households - 7-or-more-person household (%)
Size of nonfamily households - 1-person household (%)
Size of nonfamily households - 2-person household (%)
Size of nonfamily households - 3-person household (%)
Size of nonfamily households - 4-person household (%)
Size of nonfamily households - 5-person household (%)
Size of nonfamily households - 6-person household (%)
Size of nonfamily households - 7-or-moreperson household (%)
Year house built - Built 2010 or later (%)
Year house built - Built 2000 to 2009 (%)
Year house built - Built 1990 to 1999 (%)
Year house built - Built 1980 to 1989 (%)
Year house built - Built 1970 to 1979 (%)
Year house built - Built 1960 to 1969 (%)
Year house built - Built 1950 to 1959 (%)
Year house built - Built 1940 to 1949 (%)
Year house built - Built 1939 or earlier (%)
Median number of rooms in houses and condos
Median number of rooms in apartments
Median number of bedrooms in owner occupied houses
Mean number of bedrooms in owner occupied houses
Median number of bedrooms in renter occupied houses
Mean number of bedrooms in renter occupied houses
Median number of vehichles in owner occupied houses
Mean number of vehichles in owner occupied houses
Median number of vehichles in renter occupied houses
Mean number of vehichles in renter occupied houses
Rooms in owner-occupied houses - 1 room (%)
Rooms in owner-occupied houses - 2 rooms (%)
Rooms in owner-occupied houses - 3 rooms (%)
Rooms in owner-occupied houses - 4 rooms (%)
Rooms in owner-occupied houses - 5 rooms (%)
Rooms in owner-occupied houses - 6 rooms (%)
Rooms in owner-occupied houses - 7 rooms (%)
Rooms in owner-occupied houses - 8 rooms (%)
Rooms in owner-occupied houses - 9+ rooms (%)
Rooms in renter-occupied houses - 1 room (%)
Rooms in renter-occupied houses - 2 rooms (%)
Rooms in renter-occupied houses - 3 rooms (%)
Rooms in renter-occupied houses - 4 rooms (%)
Rooms in renter-occupied houses - 5 rooms (%)
Rooms in renter-occupied houses - 6 rooms (%)
Rooms in renter-occupied houses - 7 rooms (%)
Rooms in renter-occupied houses - 8 rooms (%)
Rooms in renter-occupied houses - 9+ rooms (%)
Bedrooms in owner-occupied houses - no bedrooms (%)
Bedrooms in owner-occupied houses - 1 bedroom (%)
Bedrooms in owner-occupied houses - 2 bedrooms (%)
Bedrooms in owner-occupied houses - 3 bedrooms (%)
Bedrooms in owner-occupied houses - 4 bedrooms (%)
Bedrooms in owner-occupied houses - 5+ bedrooms (%)
Bedrooms in renter-occupied houses - no bedrooms (%)
Bedrooms in renter-occupied houses - 1 bedroom (%)
Bedrooms in renter-occupied houses - 2 bedrooms (%)
Bedrooms in renter-occupied houses - 3 bedrooms (%)
Bedrooms in renter-occupied houses - 4 bedrooms (%)
Bedrooms in renter-occupied houses - 5+ bedrooms (%)
Vehicles available in owner-occupied houses - no vehicle available (%)
Vehicles available in owner-occupied houses - 1 vehicle available(%)
Vehicles available in owner-occupied houses - 2 Vehicles available (%)
Vehicles available in owner-occupied houses - 3 Vehicles available (%)
Vehicles available in owner-occupied houses - 4 Vehicles available (%)
Vehicles available in owner-occupied houses - 5+ Vehicles available (%)
Vehicles available in renter-occupied houses - no vehicle available (%)
Vehicles available in renter-occupied houses - 1 vehicle available (%)
Vehicles available in renter-occupied houses - 2 Vehicles available (%)
Vehicles available in renter-occupied houses - 3 Vehicles available (%)
Vehicles available in renter-occupied houses - 4 Vehicles available (%)
Vehicles available in renter-occupied houses - 5+ Vehicles available (%)
Housing units in structures - 1, detached (%)
Housing units in structures - 1, attached (%)
Housing units in structures - 2 (%)
Housing units in structures - 3 or 4 (%)
Housing units in structures - 5 to 9 (%)
Housing units in structures - 10 to 19 (%)
Housing units in structures - 20 to 49 (%)
Housing units in structures - 50 or more (%)
Housing units in structures - Mobile home (%)
Housing units in structures - Boat, RV, van, etc. (%)
Housing units in structures - Owners - 1, detached (%)
Housing units in structures - Owners - 1, attached (%)
Housing units in structures - Owners - 2 (%)
Housing units in structures - Owners - 3 or 4 (%)
Housing units in structures - Owners - 5 to 9 (%)
Housing units in structures - Owners - 10 to 19 (%)
Housing units in structures - Owners - 20 to 49 (%)
Housing units in structures - Owners - 50 or more (%)
Housing units in structures - Owners - Mobile home (%)
Housing units in structures - Owners - Boat, RV, van, etc. (%)
Housing units in structures - Renters - 1, detached (%)
Housing units in structures - Renters - 1, attached (%)
Housing units in structures - Renters - 2 (%)
Housing units in structures - Renters - 3 or 4 (%)
Housing units in structures - Renters - 5 to 9 (%)
Housing units in structures - Renters - 10 to 19 (%)
Housing units in structures - Renters - 20 to 49 (%)
Housing units in structures - Renters - 50 or more (%)
Housing units in structures - Renters - Mobile home (%)
Housing units in structures - Renters - Boat, RV, van, etc. (%)
House/condo owner moved in on average (years ago)
Renter moved in on average (years ago)
Year householder moved into unit - Moved in 1999 to March 2000 (%)
Year householder moved into unit - Moved in 1999 to March 2000 (%) - White
Year householder moved into unit - Moved in 1999 to March 2000 (%) - Black or African American
Year householder moved into unit - Moved in 1999 to March 2000 (%) - Asian
Year householder moved into unit - Moved in 1999 to March 2000 (%) - Hispanic or Latino
Year householder moved into unit - Moved in 1999 to March 2000 (%) - American Indian and Alaska Native
Year householder moved into unit - Moved in 1999 to March 2000 (%) - Multirace
Year householder moved into unit - Moved in 1999 to March 2000 (%) - Other Race
Year householder moved into unit - Moved in 1995 to 1998 (%)
Year householder moved into unit - Moved in 1995 to 1998 (%) - White
Year householder moved into unit - Moved in 1995 to 1998 (%) - Black or African American
Year householder moved into unit - Moved in 1995 to 1998 (%) - Asian
Year householder moved into unit - Moved in 1995 to 1998 (%) - Hispanic or Latino
Year householder moved into unit - Moved in 1995 to 1998 (%) - American Indian and Alaska Native
Year householder moved into unit - Moved in 1995 to 1998 (%) - Multirace
Year householder moved into unit - Moved in 1995 to 1998 (%) - Other Race
Year householder moved into unit - Moved in 1990 to 1994 (%)
Year householder moved into unit - Moved in 1990 to 1994 (%) - White
Year householder moved into unit - Moved in 1990 to 1994 (%) - Black or African American
Year householder moved into unit - Moved in 1990 to 1994 (%) - Asian
Year householder moved into unit - Moved in 1990 to 1994 (%) - Hispanic or Latino
Year householder moved into unit - Moved in 1990 to 1994 (%) - American Indian and Alaska Native
Year householder moved into unit - Moved in 1990 to 1994 (%) - Multirace
Year householder moved into unit - Moved in 1990 to 1994 (%) - Other Race
Year householder moved into unit - Moved in 1980 to 1989 (%)
Year householder moved into unit - Moved in 1980 to 1989 (%) - White
Year householder moved into unit - Moved in 1980 to 1989 (%) - Black or African American
Year householder moved into unit - Moved in 1980 to 1989 (%) - Asian
Year householder moved into unit - Moved in 1980 to 1989 (%) - Hispanic or Latino
Year householder moved into unit - Moved in 1980 to 1989 (%) - American Indian and Alaska Native
Year householder moved into unit - Moved in 1980 to 1989 (%) - Multirace
Year householder moved into unit - Moved in 1980 to 1989 (%) - Other Race
Year householder moved into unit - Moved in 1970 to 1979 (%)
Year householder moved into unit - Moved in 1970 to 1979 (%) - White
Year householder moved into unit - Moved in 1970 to 1979 (%) - Black or African American
Year householder moved into unit - Moved in 1970 to 1979 (%) - Asian
Year householder moved into unit - Moved in 1970 to 1979 (%) - Hispanic or Latino
Year householder moved into unit - Moved in 1970 to 1979 (%) - American Indian and Alaska Native
Year householder moved into unit - Moved in 1970 to 1979 (%) - Multirace
Year householder moved into unit - Moved in 1970 to 1979 (%) - Other Race
Year householder moved into unit - Moved in 1969 or earlier (%)
Year householder moved into unit - Moved in 1969 or earlier (%) - White
Year householder moved into unit - Moved in 1969 or earlier (%) - Black or African American
Year householder moved into unit - Moved in 1969 or earlier (%) - Asian
Year householder moved into unit - Moved in 1969 or earlier (%) - Hispanic or Latino
Year householder moved into unit - Moved in 1969 or earlier (%) - American Indian and Alaska Native
Year householder moved into unit - Moved in 1969 or earlier (%) - Multirace
Year householder moved into unit - Moved in 1969 or earlier (%) - Other Race
Housing units lacking complete plumbing facilities (%)
Housing units lacking complete kitchen facilities (%)
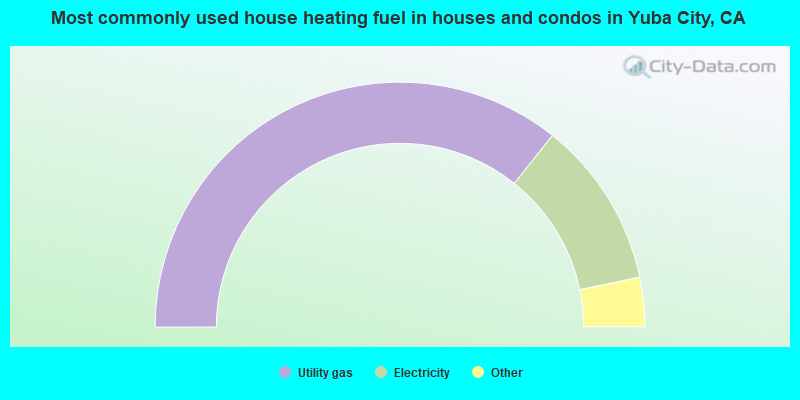
House heating fuel used in houses and condos - Utility gas (%)
House heating fuel used in houses and condos - Bottled, tank, or LP gas (%)
House heating fuel used in houses and condos - Electricity (%)
House heating fuel used in houses and condos - Fuel oil, kerosene, etc. (%)
House heating fuel used in houses and condos - Coal or coke (%)
House heating fuel used in houses and condos - Wood (%)
House heating fuel used in houses and condos - Solar energy (%)
House heating fuel used in houses and condos - Other fuel (%)
House heating fuel used in houses and condos - No fuel used (%)
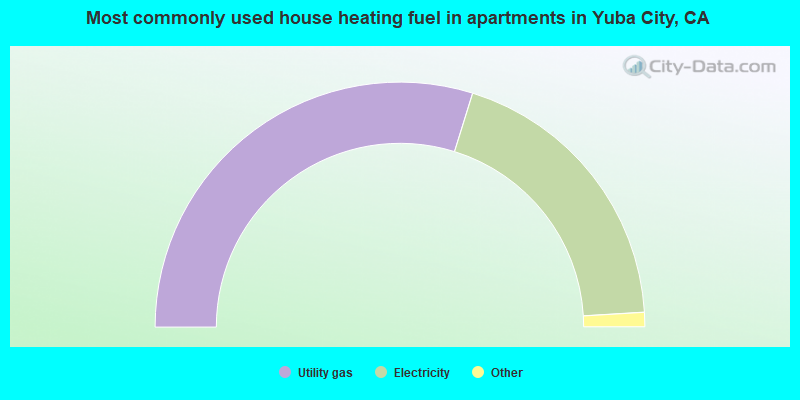
House heating fuel used in apartments - Utility gas (%)
House heating fuel used in apartments - Bottled, tank, or LP gas (%)
House heating fuel used in apartments - Electricity (%)
House heating fuel used in apartments - Fuel oil, kerosene, etc. (%)
House heating fuel used in apartments - Coal or coke (%)
House heating fuel used in apartments - Wood (%)
House heating fuel used in apartments - Solar energy (%)
House heating fuel used in apartments - Other fuel (%)
House heating fuel used in apartments - No fuel used (%)
Median year house/condo built: 1989Median year apartment built: 1977Household type by relationship:
Households: 69,004
Male householders: 11,795 (2,175 living alone ), Female householders: 12,154 (4,270 living alone )9,743 spouses (9,717 opposite-sex spouses ), 1,046 unmarried partners , (1,046 opposite-sex unmarried partners ), 20,857 children (19,731 natural , 559 adopted , 567 stepchildren ), 2,790 grandchildren , 2,554 brothers or sisters , 2,104 parents , 0 foster children , 2,176 other relatives , 3,031 non-relatives In group quarters: 754
Size of family households: 7,069 2-persons , 3,654 3-persons , 1,798 4-persons , 1,728 5-persons , 1,400 6-persons , 684 7-or-more-persons .
Size of nonfamily households: 6,445 1-person , 474 2-persons , 431 3-persons , 266 4-persons .
8,403 married couples with children. single-parent households (1,511 men , 2,755 women ).
61.8% of residents of Yuba City speak English at home. of residents speak Spanish at home (60% speak English very well , 15% speak English well , 15% speak English not well , 10% don't speak English at all ).of residents speak other Indo-European language at home (49% speak English very well , 17% speak English well , 20% speak English not well , 14% don't speak English at all ).of residents speak Asian or Pacific Island language at home (42% speak English very well , 33% speak English well , 15% speak English not well , 11% don't speak English at all ).of residents speak other language at home (49% speak English very well , 51% speak English well ).
Foreign born population: 16,109 (23.3%)of them are naturalized citizens )
Median number of rooms in houses and condos:
Median number of rooms in apartments
Owner-occupied Renter-occupied
Rooms in owner-occupied houses in Yuba City, California
293 1 room 92 2 rooms 405 3 rooms 1,275 4 rooms 2,404 5 rooms 2,430 6 rooms 3,110 7 rooms 1,751 8 rooms 2,052 9+ rooms
Rooms in renter-occupied apartments in Yuba City, California
46 1 room 367 2 rooms 995 3 rooms 2,738 4 rooms 1,822 5 rooms 2,064 6 rooms 1,196 7 rooms 604 8 rooms 305 9+ rooms
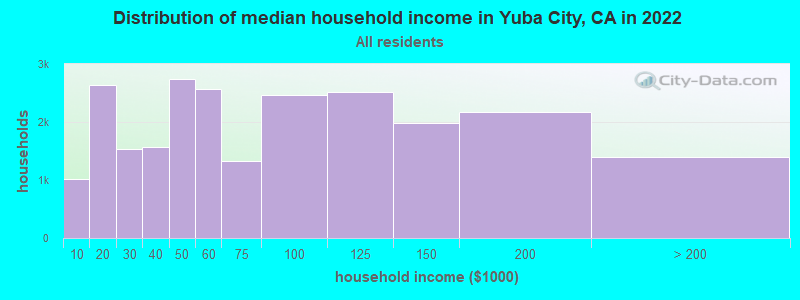
Yuba City, CA household income distribution 1,016 Less than $10,0002,636 $10,000 to $19,9991,541 $20,000 to $29,9991,562 $30,000 to $39,9992,747 $40,000 to $49,9992,576 $50,000 to $59,9991,335 $60,000 to $74,9992,470 $75,000 to $99,9992,523 $100,000 to $124,9991,981 $125,000 to $149,9992,172 $150,000 to $199,9991,390 $200,000 or more
Home value of owner - occupied houses in 2022 in Yuba City, CA 123 Less than $10,00042 $10,000 to $14,9997 $15,000 to $19,999135 $20,000 to $24,99925 $25,000 to $29,999139 $30,000 to $34,99971 $35,000 to $39,99999 $40,000 to $49,99912 $50,000 to $59,99911 $60,000 to $69,999172 $70,000 to $79,99998 $80,000 to $89,99982 $90,000 to $99,999152 $100,000 to $124,99958 $125,000 to $149,99984 $150,000 to $174,999108 $175,000 to $199,999617 $200,000 to $249,999806 $250,000 to $299,9993,254 $300,000 to $399,9992,917 $400,000 to $499,9992,019 $500,000 to $749,999412 $750,000 to $999,999147 $1,000,000 to $1,499,9999 $2,000,000 or moreRent paid by renters in 2022 in Yuba City, CA 43 Less than $10023 $100 to $14939 $150 to $199154 $200 to $24965 $250 to $29936 $300 to $34962 $350 to $399151 $400 to $44940 $450 to $49943 $500 to $54955 $550 to $599158 $600 to $649117 $650 to $699256 $700 to $749323 $750 to $799962 $800 to $899848 $900 to $9992,807 $1,000 to $1,2491,683 $1,250 to $1,4991,566 $1,500 to $1,999328 $2,000 to $2,49969 $2,500 to $2,99935 $3,500 or more312 No cash rent
Percentage of workers working in this county: 56.2%Number of people working at home: 2,410 (8.1% of all workers )
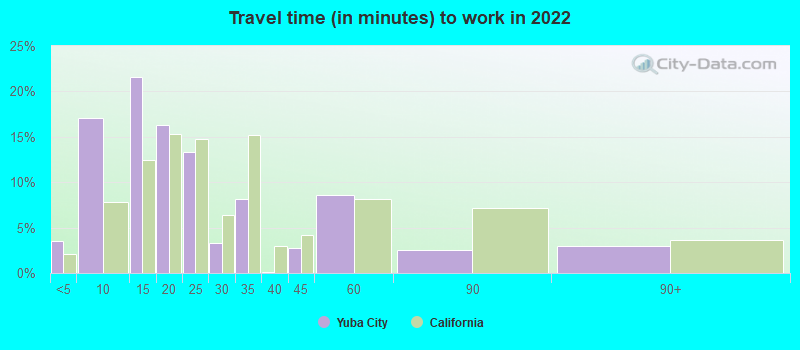
Travel time to work (commute)
Less than 5 minutes: 7815 to 9 minutes: 4,01210 to 14 minutes: 4,64615 to 19 minutes: 2,56420 to 24 minutes: 1,99925 to 29 minutes: 48130 to 34 minutes: 2,15835 to 39 minutes: 64840 to 44 minutes: 1,17145 to 59 minutes: 3,32660 to 89 minutes: 2,31090 or more minutes: 852
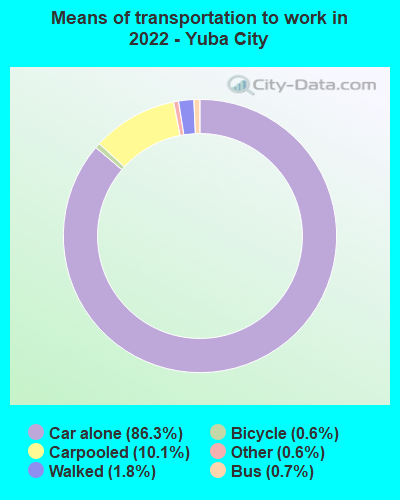
Means of transportation to work:
Drove a car alone: 20,749 (76.7%)Carpooled: 2,622 (9.7%)Bus : 130 (0.5%)Taxi: 143 (0.5%)Bicycle: 139 (0.5%)Walked: 469 (1.7%)Worked at home: 2,410 (8.9%)
Unemployment by race in 2022
Unemployment rate for White non-Hispanic residents 7.6% Males15.9% FemalesUnemployment rate for Black residents 10.3% FemalesUnemployment rate for American Indian and Alaska Native residents 12.7% MalesUnemployment rate for Asian residents 5.7% Males2.1% FemalesUnemployment rate for other race residents 9.0% Males10.7% FemalesUnemployment rate for two or more race residents 4.8% Males5.4% FemalesUnemployment rate for Hispanic or Latino residents 13.0% Males12.7% Females
Year of entry for the foreign-born population in Yuba City, California
4,894 2010 or later 4,328 2000 to 2009 3,416 1990 to 1999 1,940 1980 to 1989 971 1970 to 1979 850 Before 1970
First ancestries reported:
English: 1,824 (4.8%)
American: 1,683 (4.4%)
German: 846 (2.2%)
Irish: 783 (2.1%)
Italian: 568 (1.5%)
Afghan: 467 (1.2%)
European: 431 (1.1%)
Scottish: 269 (0.7%)
Norwegian: 156 (0.4%)
Dutch: 150 (0.4%)
Portuguese: 131 (0.3%)
French: 129 (0.3%)
Egyptian: 95 (0.3%)
British: 90 (0.2%)
African: 79 (0.2%)
Welsh: 69 (0.2%)
Swedish: 67 (0.2%)
Kenyan: 67 (0.2%)
Russian: 62 (0.2%)
Iranian: 57 (0.2%)
Polish: 50 (0.1%)
Greek: 48 (0.1%)
Scotch-Irish: 46 (0.1%)
South African: 43 (0.1%)
Trinidadian and Tobagonian: 39 (0.1%)
Scandinavian: 36 (0.09%)
French Canadian: 32 (0.08%)
Danish: 31 (0.08%)
Belizean: 25 (0.07%)
Northern European: 24 (0.06%)
Swiss: 20 (0.05%)
Pennsylvania German: 16 (0.04%)
Maltese: 13 (0.03%)
Austrian: 10 (0.03%)
Canadian: 9 (0.02%)
Lebanese: 8 (0.02%)
Finnish: 8 (0.02%)
Serbian: 8 (0.02%)
Romanian: 7 (0.02%)
Basque: 6 (0.02%)
Arab: 5 (0.01%) Most common places of birth for foreign-born residents (%): India Yuba City:
42.1% (6,851)California:
5.2% (539,184)
Mexico Yuba City:
34.7% (5,648)California:
37.2% (3,881,193)
Afghanistan Yuba City:
3.7% (596)California:
0.5% (53,260)
Philippines Yuba City:
3.1% (502)California:
7.8% (818,297)
Laos Yuba City:
2.6% (424)California:
0.5% (48,911)
Vietnam Yuba City:
1.7% (281)California:
4.9% (512,335)
Place of birth for U.S.-born residents:
This state: 43,312Other state: 9,091Northeast: 1,141Midwest: 2,561South: 3,220West: 2,169 85.3% of Yuba City residents lived in the same house 1 years ago.
Out of people who lived in different houses, 30.2% lived in this county.
Out of people who lived in different counties, 84.8% lived in California.
Yuba City:
85.3%State average:
88.9%
Education attainment for males 25 years and older:
No schooling: 965Nursery to 4th grade: 1515th and 6th grade: 6867th and 8th grade: 9819th grade: 34010th grade: 48111th grade: 54512th grade, no diploma: 781High school graduate (or equivalency): 5,063Less than 1 year of college: 735Some college more than 1 year, no degree: 3,885Associate degree: 3,153Bachelor's degree: 3,618Master's degree: 933Professional school degree: 342Doctorate degree: 267
Education attainment for females 25 years and older:
No schooling: 1,278Nursery to 4th grade: 6135th and 6th grade: 3837th and 8th grade: 1,7919th grade: 5410th grade: 20511th grade: 5512th grade, no diploma: 734High school graduate (or equivalency): 6,054Less than 1 year of college: 2,671Some college more than 1 year, no degree: 2,662Associate degree: 2,104Bachelor's degree: 2,997Master's degree: 1,099Professional school degree: 435Doctorate degree: 108
Housing units in structures:
One, detached: 18,045One, attached: 1,394Two: 2373 or 4: 2955 to 9: 30510 to 19: 73820 to 49: 1,33950 or more: 796Mobile homes: 1,113Boats, RVs, vans, etc.: 67Median worth of mobile homes: $40,400
Housing units lacking complete kitchen facilities in 2022: 1.1%House/condo owner moved in on average 15 years ago
Renter moved in on average 3 years ago
Private vs. public school enrollment:
Students in private schools in grades 1 to 8 (elementary and middle school): 270 Here:
3.4%California:
10.5%
Students in private schools in grades 9 to 12 (high school): 0 Students in private undergraduate colleges: 767 Here:
17.0%California:
15.9%