Housing density: 711 houses/condos per square mile
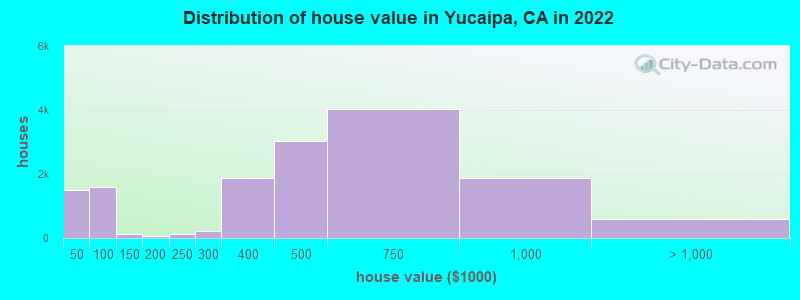
Median price asked for vacant for-sale houses and condos in 2022: $311,504.
Median contract rent in 2022: $1,382 (lower quartile is $980, upper quartile is $1,841)
Median rent asked for vacant for-rent units in 2022: $1,438
Median gross rent in Yucaipa, CA in 2022: $1,531
Housing units in Yucaipa with a mortgage: 8,953 (474 second mortgage, 12 home equity loan, 432 both second mortgage and home equity loan) Houses without a mortgage: 152
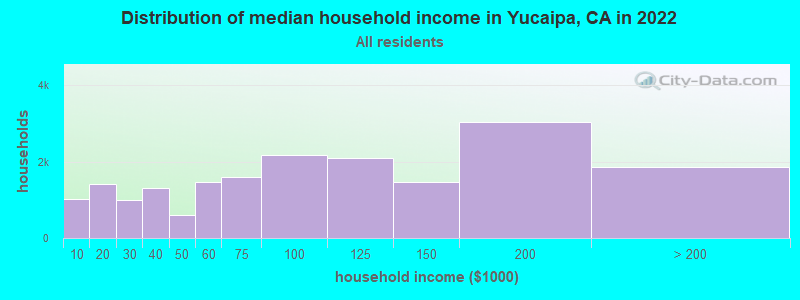
Median household income for houses/condos with a mortgage: $124,915
Median household income for apartments without a mortgage: $54,133
10,277 married couples with children.
2,082 single-parent households (837 men, 1,245 women).
75.0% of residents of Yucaipa speak English at home.
19.0% of residents speak Spanish at home (77% speak English very well, 11% speak English well, 7% speak English not well, 5% don't speak English at all).
2.4% of residents speak other Indo-European language at home (93% speak English very well, 2% speak English well, 5% speak English not well).
1.7% of residents speak Asian or Pacific Island language at home (55% speak English very well, 36% speak English well, 9% speak English not well).
0.1% of residents speak other language at home (100% speak English very well).
Foreign born population: 5,610 (10.2%)
(65.5% of them are naturalized citizens)
Percentage of workers working in this county: 76.0% Number of people working at home: 2,684 (11.1% of all workers)
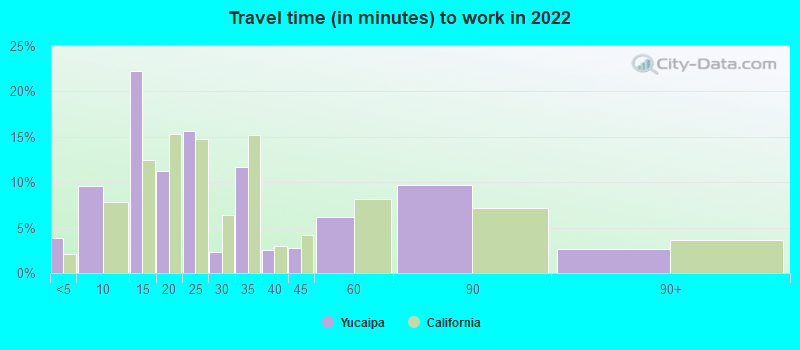
Travel time to work (commute)
Less than 5 minutes: 281
5 to 9 minutes: 1,192
10 to 14 minutes: 2,152
15 to 19 minutes: 2,475
20 to 24 minutes: 4,071
25 to 29 minutes: 1,159
30 to 34 minutes: 4,014
35 to 39 minutes: 452
40 to 44 minutes: 1,199
45 to 59 minutes: 1,762
60 to 89 minutes: 1,799
90 or more minutes: 1,022
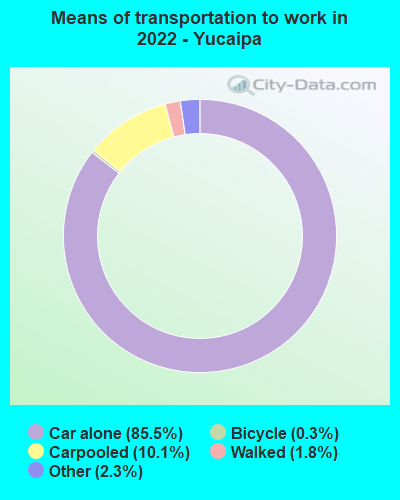
Means of transportation to work:
Drove a car alone: 7,559 (66.4%)
Carpooled: 957 (8.4%)
Taxi: 234 (2.1%)
Bicycle: 20 (0.2%)
Walked: 173 (1.5%)
Worked at home: 2,684 (23.6%)
Unemployment by race in 2022
Unemployment rate for White non-Hispanic residents
11.2%Males
2.1%Females
Unemployment rate for Black residents
7.8%Males
13.8%Females
Unemployment rate for Asian residents
2.4%Males
1.5%Females
Unemployment rate for other race residents
4.6%Males
1.7%Females
Unemployment rate for two or more race residents
12.8%Males
5.8%Females
Unemployment rate for Hispanic or Latino residents
4.0%Males
6.7%Females
Year of entry for the foreign-born population in Yucaipa, California
5152010 or later
1,3492000 to 2009
9641990 to 1999
1,0121980 to 1989
6211970 to 1979
819Before 1970
First ancestries reported:
English: 2,008 (7.0%)
German: 1,659 (5.8%)
Irish: 1,563 (5.5%)
American: 1,449 (5.1%)
European: 1,360 (4.8%)
Italian: 897 (3.1%)
Scottish: 281 (1.0%)
Polish: 270 (0.9%)
Hungarian: 260 (0.9%)
Norwegian: 190 (0.7%)
Swedish: 185 (0.6%)
Dutch: 173 (0.6%)
French: 171 (0.6%)
Welsh: 124 (0.4%)
Russian: 82 (0.3%)
Greek: 76 (0.3%)
British: 67 (0.2%)
Scandinavian: 67 (0.2%)
Romanian: 64 (0.2%)
Scotch-Irish: 62 (0.2%)
African: 62 (0.2%)
French Canadian: 58 (0.2%)
Lithuanian: 53 (0.2%)
Czech: 52 (0.2%)
British West Indian: 40 (0.1%)
Macedonian: 38 (0.1%)
Slovak: 38 (0.1%)
Canadian: 37 (0.1%)
Jordanian: 36 (0.1%)
Australian: 30 (0.1%)
Danish: 30 (0.1%)
Northern European: 19 (0.07%)
Czechoslovakian: 18 (0.06%)
Palestinian: 18 (0.06%)
Portuguese: 16 (0.06%)
Slavic: 15 (0.05%)
West Indian: 12 (0.04%)
Lebanese: 11 (0.04%)
Eastern European: 7 (0.02%)
Swiss: 7 (0.02%)
Most common places of birth for foreign-born residents (%):
Mexico
Yucaipa:
49.9% (2,727)
California:
37.2% (3,881,193)
India
Yucaipa:
6.8% (373)
California:
5.2% (539,184)
Philippines
Yucaipa:
4.0% (220)
California:
7.8% (818,297)
Guatemala
Yucaipa:
4.0% (217)
California:
2.8% (290,436)
Malaysia
Yucaipa:
3.5% (193)
California:
0.2% (17,929)
Germany
Yucaipa:
3.3% (180)
California:
0.7% (73,304)
Greece
Yucaipa:
3.2% (177)
California:
0.1% (10,538)
Korea
Yucaipa:
2.4% (132)
California:
3.0% (315,248)
El Salvador
Yucaipa:
2.0% (110)
California:
4.2% (440,287)
Ecuador
Yucaipa:
1.8% (97)
California:
0.2% (21,276)
Cambodia
Yucaipa:
1.7% (95)
California:
0.5% (51,974)
Kazakhstan
Yucaipa:
1.6% (86)
California:
0.1% (6,648)
Place of birth for U.S.-born residents:
This state: 40,205
Other state: 8,271
Northeast: 1,842
Midwest: 3,001
South: 1,883
West: 1,618
93.0% of Yucaipa residents lived in the same house 1 years ago. Out of people who lived in different houses, 37.6% lived in this county. Out of people who lived in different counties, 74.9% lived in California.
Yucaipa:
93.0%
State average:
88.9%
Education attainment for males 25 years and older:
No schooling: 478
Nursery to 4th grade: 152
5th and 6th grade: 247
7th and 8th grade: 130
9th grade: 148
10th grade: 154
11th grade: 312
12th grade, no diploma: 497
High school graduate (or equivalency): 5,197
Less than 1 year of college: 965
Some college more than 1 year, no degree: 2,951
Associate degree: 1,641
Bachelor's degree: 2,713
Master's degree: 1,498
Professional school degree: 453
Doctorate degree: 283
Education attainment for females 25 years and older:
No schooling: 403
Nursery to 4th grade: 133
5th and 6th grade: 477
7th and 8th grade: 79
9th grade: 151
10th grade: 57
11th grade: 104
12th grade, no diploma: 433
High school graduate (or equivalency): 5,308
Less than 1 year of college: 1,331
Some college more than 1 year, no degree: 3,449
Associate degree: 1,826
Bachelor's degree: 2,839
Master's degree: 1,924
Professional school degree: 78
Doctorate degree: 161
Housing units in structures:
One, detached: 13,614
One, attached: 415
Two: 353
3 or 4: 317
5 to 9: 305
10 to 19: 133
20 to 49: 108
50 or more: 469
Mobile homes: 4,025
Boats, RVs, vans, etc.: 21
Median worth of mobile homes: $53,172
Housing units lacking complete plumbing facilities in 2022: 2.2%
Housing units lacking complete kitchen facilities in 2022: 4.5%