Yucca Valley, CA (California) Houses and Residents
| Yucca Valley: | $320,835 |
| California: | $715,900 |
Mean price in 2022:
Detached houses: $338,280
Here: $338,280 State: $988,808 Townhouses or other attached units: $329,273
Here: $329,273 State: $838,546 Mobile homes: $46,017
Here: $46,017 State: $184,506
Total population: 21,485 (Urban population: 14,753 (all inside urban clusters), Rural population: 2,057 (all nonfarm))
Houses: 9,799 (8,841 occupied: 5,849 owner occupied, 3,073 renter occupied)
| % of renters here: | 34% |
| State: | 44% |
Housing density: 245 houses/condos per square mile
Median price asked for vacant for-sale houses and condos in 2022: $466,065.
Median contract rent in 2022: $971 (lower quartile is $824, upper quartile is $1,226)
Median rent asked for vacant for-rent units in 2022: $3,085
Median gross rent in Yucca Valley, CA in 2022: $1,226
Housing units in Yucca Valley with a mortgage: 3,678 (172 second mortgage, 25 home equity loan, 69 both second mortgage and home equity loan)
Houses without a mortgage: 0
Median household income for houses/condos with a mortgage: $98,854
Median household income for apartments without a mortgage: $49,896
Median monthly housing costs: $1,222
Compare current foreclosures near Yucca Valley, CA:
| Photo | Address | Area | Beds / Baths | Price | Details |
|---|---|---|---|---|---|

|
#1
Mirlo Rd
Yucca Valley, CA 92284
|
1,896 sq. feet
|
1 baths 2 beds |
show details | |

|
#2
Warren Vista Ave
Yucca Valley, CA 92284
|
952 sq. feet
|
1 baths 2 beds |
show details | |

|
#3
Hidden Gold Dr
Yucca Valley, CA 92284
|
1,726 sq. feet
|
2 baths 3 beds |
show details | |

|
#4
Yucca Mesa Rd
Yucca Valley, CA 92284
|
1,528 sq. feet
|
2 baths 2 beds |
show details | |

|
#5
Sun Via Dr
Yucca Valley, CA 92284
|
1,564 sq. feet
|
2 baths 3 beds |
show details | |

|
#6
Balsa Ave
Yucca Valley, CA 92284
|
2,010 sq. feet
|
2 baths 4 beds |
show details | |

|
#7
Titian Ct
Yucca Valley, CA 92284
|
1,768 sq. feet
|
2 baths 3 beds |
show details | |

|
#8
Apache Trl
Yucca Valley, CA 92284
|
1,336 sq. feet
|
2 baths 3 beds |
show details | |

|
#9
Crestview Dr
Yucca Valley, CA 92284
|
1,807 sq. feet
|
1 baths 2 beds |
show details | |

|
#10
Lennox Ave
Yucca Valley, CA 92284
|
1,188 sq. feet
|
2 baths 3 beds |
show details |
| Photo | Address | Area | Beds / Baths | Price | Details |
|---|---|---|---|---|---|

|
#11
Mountain View Trl
Yucca Valley, CA 92284
|
1,686 sq. feet
|
2 baths 3 beds |
show details | |

|
#12
Napa St
Yucca Valley, CA 92284
|
1,176 sq. feet
|
1 baths 2 beds |
show details | |

|
#13
Sunnyslope Dr
Yucca Valley, CA 92284
|
- sq. feet
|
- baths - beds |
show details | |

|
#14
Alta Dr
Yucca Valley, CA 92284
|
- sq. feet
|
- baths - beds |
show details | |

|
#15
Ronald Dr Apt A
Yucca Valley, CA 92284
|
- sq. feet
|
- baths - beds |
show details | |

|
#16
Joshua View Dr
Yucca Valley, CA 92284
|
- sq. feet
|
- baths - beds |
show details | |

|
#17
Church St
Yucca Valley, CA 92284
|
- sq. feet
|
- baths - beds |
show details | |

|
#18
Diadem Dr
Yucca Valley, CA 92284
|
- sq. feet
|
- baths - beds |
show details | |

|
#19
Massachusets Ave
Landers, CA 92285
|
1,394 sq. feet
|
2 baths 3 beds |
$375,000
|
show details |

|
#20
Alfalfa Ave
Twentynine Palms, CA 92277
|
724 sq. feet
|
1 baths 2 beds |
$279,000
|
show details |
| Photo | Address | Area | Beds / Baths | Price | Details |
|---|---|---|---|---|---|

|
#21
Old Woman Springs Rd
Yucca Valley, CA 92284
|
- sq. feet
|
- baths - beds |
show details | |

|
#22
6th St
Desert Hot Springs, CA 92240
|
892 sq. feet
|
2 baths 2 beds |
show details | |

|
#23
Olympic Mountain Ave
Desert Hot Springs, CA 92240
|
2,410 sq. feet
|
2 baths 4 beds |
show details | |

|
#24
Avenida La Candela
Joshua Tree, CA 92252
|
1,764 sq. feet
|
2 baths 1 beds |
show details | |

|
#25
Morning Star Dr
Desert Hot Springs, CA 92240
|
2,009 sq. feet
|
2 baths 3 beds |
show details | |

|
#26
Dillon Rd # 182
Desert Hot Springs, CA 92241
|
1,056 sq. feet
|
2 baths 2 beds |
show details | |

|
#27
Dillon Rd # 5
Desert Hot Springs, CA 92241
|
1,056 sq. feet
|
2 baths 2 beds |
show details | |

|
#28
Via Montana # 1
Desert Hot Springs, CA 92240
|
2,195 sq. feet
|
2 baths 2 beds |
show details | |

|
#29
Bubbling Wells Rd Spc 4
Desert Hot Springs, CA 92240
|
840 sq. feet
|
2 baths 2 beds |
show details | |

|
#30
Bubbling Wells Rd
Desert Hot Springs, CA 92240
|
1,575 sq. feet
|
2 baths 4 beds |
show details |
| Photo | Address | Area | Beds / Baths | Price | Details |
|---|---|---|---|---|---|

|
#31
La Mesa Dr
Desert Hot Springs, CA 92240
|
1,206 sq. feet
|
2 baths 3 beds |
show details | |

|
#32
Ramona Dr
Desert Hot Springs, CA 92240
|
850 sq. feet
|
2 baths 2 beds |
show details | |

|
#33
Panorama Dr
Desert Hot Springs, CA 92240
|
2,117 sq. feet
|
2 baths 3 beds |
show details | |

|
#34
Hacienda Heights Dr
Desert Hot Springs, CA 92240
|
2,509 sq. feet
|
2 baths 4 beds |
show details | |

|
#35
Pierson Blvd
Desert Hot Springs, CA 92240
|
1,695 sq. feet
|
2 baths 4 beds |
show details | |

|
#36
Agua Cayendo Rd
Desert Hot Springs, CA 92240
|
1,260 sq. feet
|
2 baths 3 beds |
show details | |

|
#37
1st St
Desert Hot Springs, CA 92240
|
504 sq. feet
|
1 baths 1 beds |
show details | |

|
#38
Avenida Serena
Desert Hot Springs, CA 92240
|
1,248 sq. feet
|
2 baths 3 beds |
show details | |

|
#39
Pomelo Dr
Desert Hot Springs, CA 92240
|
1,344 sq. feet
|
2 baths 2 beds |
show details | |

|
#40
Avenida Dorado
Desert Hot Springs, CA 92240
|
1,462 sq. feet
|
2 baths 3 beds |
show details |
| Photo | Address | Area | Beds / Baths | Price | Details |
|---|---|---|---|---|---|

|
#41
Center Ave
Joshua Tree, CA 92252
|
2,328 sq. feet
|
3 baths 3 beds |
show details | |

|
#42
Dakota Ln
Landers, CA 92285
|
736 sq. feet
|
1 baths 1 beds |
show details | |

|
#43
Avenida Barona
Desert Hot Springs, CA 92240
|
1,248 sq. feet
|
2 baths 4 beds |
show details | |

|
#44
Valencia Dr
Desert Hot Springs, CA 92240
|
2,486 sq. feet
|
3 baths 3 beds |
show details | |

|
#45
San Rafael Dr
Desert Hot Springs, CA 92240
|
1,330 sq. feet
|
2 baths 3 beds |
show details | |

|
#46
Mesquite Ave
Desert Hot Springs, CA 92240
|
1,550 sq. feet
|
2 baths 3 beds |
show details | |

|
#47
Olympic Mountain Ave
Desert Hot Springs, CA 92240
|
- sq. feet
|
- baths - beds |
show details | |

|
#48
Desert View Rd
Whitewater, CA 92282
|
- sq. feet
|
- baths - beds |
show details | |

|
#49
Sagebrush Rd
North Palm Springs, CA 92258
|
- sq. feet
|
- baths - beds |
show details | |

|
Check over 1 million property listings on Foreclosure.com!
|
browse all offers | |||


 | Airport. Yucca Valley visit (5 replies) |
| East Coast Guy Curious About CA (123 replies) |
| Yucca Valley Rents (3 replies) |
| Yucca Valley 2nd home in low burglary area? (5 replies) |
| Natural decrease in California's population (170 replies) |
| Bad reviews of apartment complexes/property managers in Palm Desert area (39 replies) |

Median year apartment built: 1977
Household type by relationship:
Households: 21,830- Male householders: 4,386 (1,206 living alone), Female householders: 4,400 (1,412 living alone)
3,590 spouses (3,511 opposite-sex spouses), 1,147 unmarried partners, (1,120 opposite-sex unmarried partners), 6,091 children (5,625 natural, 46 adopted, 419 stepchildren), 575 grandchildren, 134 brothers or sisters, 269 parents, 0 foster children, 333 other relatives, 658 non-relatives
- In group quarters: 241
Size of family households: 2,491 2-persons, 1,252 3-persons, 837 4-persons, 352 5-persons, 160 6-persons, 169 7-or-more-persons.
Size of nonfamily households: 2,591 1-person, 981 2-persons, 102 3-persons, 10 6-persons.
2,466 married couples with children.
1,952 single-parent households (876 men, 1,076 women).
78.0% of residents of Yucca Valley speak English at home.
16.1% of residents speak Spanish at home (76% speak English very well, 11% speak English well, 12% speak English not well, 1% don't speak English at all).
2.3% of residents speak other Indo-European language at home (52% speak English very well, 2% speak English well, 46% speak English not well).
1.6% of residents speak Asian or Pacific Island language at home (53% speak English very well, 34% speak English well, 13% speak English not well).
0.4% of residents speak other language at home (100% speak English very well).
Foreign born population: 1,952 (8.9%)
(65.5% of them are naturalized citizens)
| Here: | 5.4 |
| State: | 6.0 |
| Here: | 4.3 |
| State: | 3.9 |

- Bedrooms in owner-occupied houses and condos in Yucca Valley, California
- 54no bedroom
- 1841 bedroom
- 1,8952 bedrooms
- 2,7643 bedrooms
- 8964 bedrooms
- 565+ bedrooms

- Bedrooms in renter-occupied apartments in Yucca Valley, California
- 55no bedroom
- 3321 bedroom
- 1,6022 bedrooms
- 1,0143 bedrooms
- 694 bedrooms
- 05+ bedrooms

- Cars and other vehicles available in Yucca Valley in owner-occupied houses/condos
- 128no vehicle
- 1,8251 vehicle
- 2,1572 vehicles
- 1,0173 vehicles
- 4154 vehicles
- 3105+ vehicles
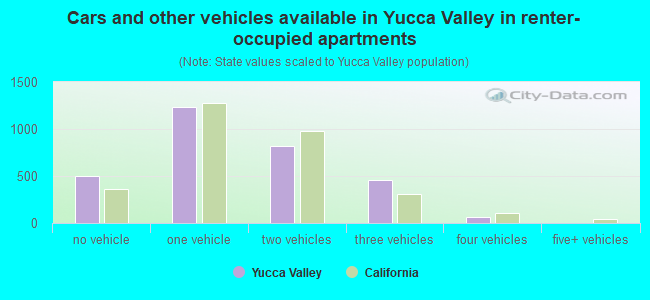
- Cars and other vehicles available in Yucca Valley in renter-occupied apartments
- 504no vehicle
- 1,2331 vehicle
- 8142 vehicles
- 4613 vehicles
- 614 vehicles
- 05+ vehicles

- Rooms in owner-occupied houses in Yucca Valley, California
- 541 room
- 782 rooms
- 1663 rooms
- 9544 rooms
- 1,8415 rooms
- 1,0886 rooms
- 9107 rooms
- 4278 rooms
- 3329+ rooms

- Rooms in renter-occupied apartments in Yucca Valley, California
- 471 room
- 2002 rooms
- 4693 rooms
- 1,0434 rooms
- 4805 rooms
- 5526 rooms
- 1917 rooms
- 918 rooms
- 09+ rooms


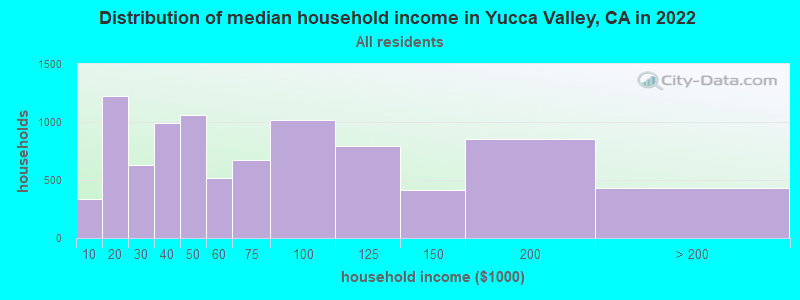
Yucca Valley, CA household income distribution

- 334Less than $10,000
- 1,222$10,000 to $19,999
- 627$20,000 to $29,999
- 995$30,000 to $39,999
- 1,057$40,000 to $49,999
- 515$50,000 to $59,999
- 672$60,000 to $74,999
- 1,017$75,000 to $99,999
- 797$100,000 to $124,999
- 417$125,000 to $149,999
- 851$150,000 to $199,999
- 431$200,000 or more
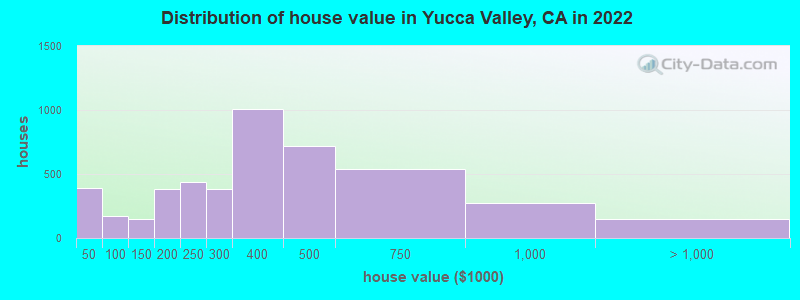
Home value of owner - occupied houses in 2022 in Yucca Valley, CA
-
- 45Less than $10,000
- 117$10,000 to $14,999
- 18$15,000 to $19,999
- 50$20,000 to $24,999
- 62$25,000 to $29,999
- 37$30,000 to $34,999
- 29$35,000 to $39,999
- 25$40,000 to $49,999
- 43$50,000 to $59,999
- 48$80,000 to $89,999
- 56$90,000 to $99,999
- 40$100,000 to $124,999
- 108$125,000 to $149,999
- 256$150,000 to $174,999
- 128$175,000 to $199,999
- 438$200,000 to $249,999
- 382$250,000 to $299,999
- 1,004$300,000 to $399,999
- 721$400,000 to $499,999
- 541$500,000 to $749,999
- 274$750,000 to $999,999
- 137$1,000,000 to $1,499,999
- 13$1,500,000 to $1,999,999
Rent paid by renters in 2022 in Yucca Valley, CA
-
- 44$150 to $199
- 70$200 to $249
- 5$250 to $299
- 51$350 to $399
- 63$400 to $449
- 24$450 to $499
- 14$500 to $549
- 22$550 to $599
- 67$600 to $649
- 31$650 to $699
- 55$700 to $749
- 207$750 to $799
- 651$800 to $899
- 400$900 to $999
- 503$1,000 to $1,249
- 165$1,250 to $1,499
- 326$1,500 to $1,999
- 26$2,000 to $2,499
- 11$2,500 to $2,999
- 198No cash rent


Percentage of workers working in this county: 74.5%
Number of people working at home: 510 (5.6% of all workers)
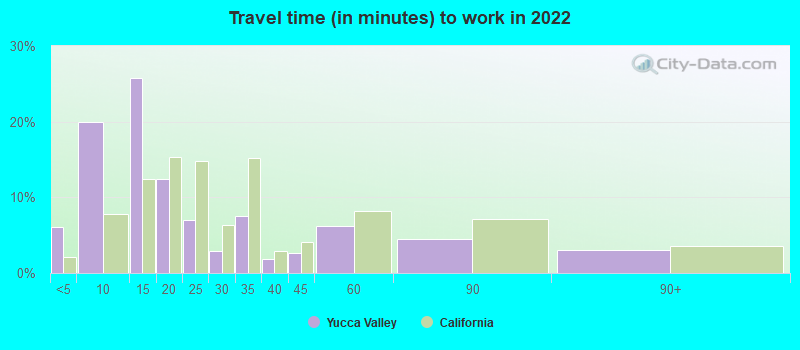
Travel time to work (commute)
- Less than 5 minutes: 521
- 5 to 9 minutes: 1,711
- 10 to 14 minutes: 1,910
- 15 to 19 minutes: 360
- 20 to 24 minutes: 259
- 25 to 29 minutes: 59
- 30 to 34 minutes: 802
- 35 to 39 minutes: 476
- 40 to 44 minutes: 387
- 45 to 59 minutes: 1,250
- 60 to 89 minutes: 441
- 90 or more minutes: 372
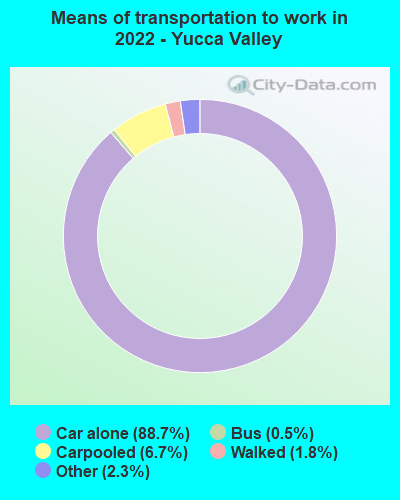
Means of transportation to work:
- Drove a car alone: 6,311 (81.1%)
- Carpooled: 514 (6.6%)
- Bus: 37 (0.5%)
- Taxi: 183 (2.4%)
- Walked: 137 (1.8%)
- Worked at home: 510 (6.6%)

- Unemployment by race in 2022
- Unemployment rate for White non-Hispanic residents
- 8.6%Males
- 5.7%Females
- Unemployment rate for Asian residents
- 15.0%Males
- 44.0%Females
- Unemployment rate for other race residents
- 14.6%Females
- Unemployment rate for two or more race residents
- 9.6%Males
- 3.2%Females
- Unemployment rate for Hispanic or Latino residents
- 6.3%Males
- 8.1%Females

- Year of entry for the foreign-born population in Yucca Valley, California
- 3892010 or later
- 5722000 to 2009
- 931990 to 1999
- 1141980 to 1989
- 2441970 to 1979
- 426Before 1970

First ancestries reported:
- English: 1,096 (10.1%)
- German: 757 (7.0%)
- Irish: 757 (7.0%)
- Italian: 669 (6.2%)
- American: 561 (5.2%)
- European: 354 (3.3%)
- African: 240 (2.2%)
- Jamaican: 192 (1.8%)
- Armenian: 185 (1.7%)
- Dutch: 149 (1.4%)
- Hungarian: 104 (1.0%)
- Danish: 72 (0.7%)
- Norwegian: 70 (0.6%)
- Scottish: 57 (0.5%)
- Scandinavian: 54 (0.5%)
- Moroccan: 52 (0.5%)
- Welsh: 47 (0.4%)
- French: 40 (0.4%)
- Slovak: 36 (0.3%)
- Eastern European: 35 (0.3%)
- Russian: 32 (0.3%)
- Czech: 28 (0.3%)
- Swedish: 25 (0.2%)
- Greek: 23 (0.2%)
- Scotch-Irish: 23 (0.2%)
- Portuguese: 21 (0.2%)
- French Canadian: 18 (0.2%)
- Basque: 16 (0.1%)
- British: 16 (0.1%)
- Austrian: 15 (0.1%)
- Polish: 15 (0.1%)
- Swiss: 10 (0.09%)
- Ukrainian: 9 (0.08%)
- Icelander: 8 (0.07%)
- Northern European: 5 (0.05%)
Most common places of birth for foreign-born residents (%):
| Yucca Valley: | 38.2% (727) |
| California: | 37.2% (3,881,193) |
| Yucca Valley: | 12.0% (229) |
| California: | 2.0% (206,004) |
| Yucca Valley: | 5.6% (107) |
| California: | 0.7% (74,025) |
| Yucca Valley: | 4.2% (80) |
| California: | 0.7% (73,304) |
| Yucca Valley: | 4.1% (77) |
| California: | 4.9% (512,335) |
| Yucca Valley: | 3.5% (66) |
| California: | 0.6% (65,335) |
| Yucca Valley: | 3.3% (62) |
| California: | 4.2% (440,287) |
| Yucca Valley: | 3.0% (57) |
| California: | 0.6% (60,582) |
| Yucca Valley: | 2.9% (55) |
| California: | 1.2% (127,477) |
| Yucca Valley: | 2.7% (51) |
| California: | 0.1% (9,209) |
| Yucca Valley: | 2.5% (48) |
| California: | 0.7% (71,932) |
| Yucca Valley: | 2.5% (48) |
| California: | 0.1% (6,612) |
| Yucca Valley: | 1.8% (35) |
| California: | 7.8% (818,297) |
| Yucca Valley: | 1.8% (34) |
| California: | 0.6% (66,590) |
| Yucca Valley: | 1.7% (33) |
| California: | 0.3% (33,937) |
Place of birth for U.S.-born residents:
- This state: 15,041
- Other state: 4,467
- Northeast: 1,032
- Midwest: 1,379
- South: 1,135
- West: 947
88.9% of Yucca Valley residents lived in the same house 1 years ago.
Out of people who lived in different houses, 35.3% lived in this county.
Out of people who lived in different counties, 56.8% lived in California.
| Yucca Valley: | 88.9% |
| State average: | 88.9% |
Education attainment for males 25 years and older:
- No schooling: 85
- Nursery to 4th grade: 50
- 5th and 6th grade: 22
- 7th and 8th grade: 9
- 9th grade: 174
- 10th grade: 39
- 11th grade: 301
- 12th grade, no diploma: 82
- High school graduate (or equivalency): 2,610
- Less than 1 year of college: 540
- Some college more than 1 year, no degree: 1,536
- Associate degree: 401
- Bachelor's degree: 978
- Master's degree: 287
- Professional school degree: 45
- Doctorate degree: 93

Education attainment for females 25 years and older:
- No schooling: 163
- Nursery to 4th grade: 77
- 5th and 6th grade: 127
- 7th and 8th grade: 133
- 9th grade: 34
- 10th grade: 69
- 11th grade: 189
- 12th grade, no diploma: 115
- High school graduate (or equivalency): 2,215
- Less than 1 year of college: 809
- Some college more than 1 year, no degree: 1,287
- Associate degree: 845
- Bachelor's degree: 993
- Master's degree: 389
- Professional school degree: 149
- Doctorate degree: 95


Housing units in structures:
- One, detached: 7,922
- One, attached: 213
- Two: 478
- 3 or 4: 185
- 5 to 9: 238
- 10 to 19: 52
- 20 to 49: 35
- 50 or more: 44
- Mobile homes: 627
Median worth of mobile homes: $28,206
Housing units lacking complete kitchen facilities in 2022: 3.0%
House/condo owner moved in on average 8 years ago
Renter moved in on average 1 years ago

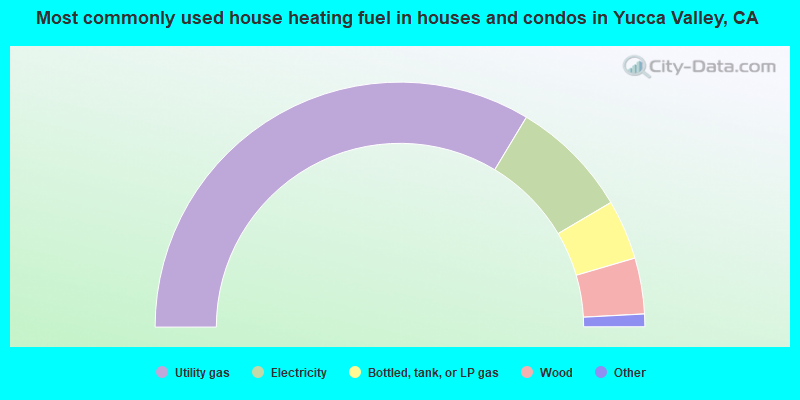
- 67.4%Utility gas
- 15.8%Electricity
- 7.9%Bottled, tank, or LP gas
- 7.4%Wood
- 1.1%Solar energy
- 0.6%Other fuel
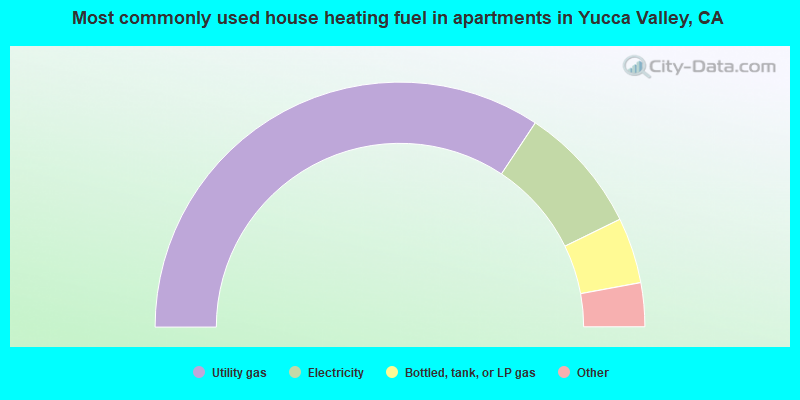
- 68.7%Utility gas
- 16.9%Electricity
- 8.7%Bottled, tank, or LP gas
- 2.9%No fuel used
- 2.8%Wood
Private vs. public school enrollment:
| Here: | 17.3% |
| California: | 10.5% |
| Here: | 17.7% |
| California: | 8.5% |
| Here: | 15.7% |
| California: | 15.9% |


