Yuma, AZ (Arizona) Houses and Residents
Estimated median house or condo value in 2022: $245,600 (it was $78,100 in 2000 )
Yuma:
$245,600Arizona:
$402,800
Lower value quartile - upper value quartile: $167,600 - $340,500Mean price in 2022: Detached houses: $278,737 Here:
$278,737State:
$521,408
Townhouses or other attached units: $144,764 Here:
$144,764State:
$387,465
In 2-unit structures: $295,768 Here:
$295,768State:
$1,060,724
In 3-to-4-unit structures: $152,221 Here:
$152,221State:
$342,505
In 5-or-more-unit structures: $251,474 Here:
$251,474State:
$371,286
Mobile homes: $90,239 Here:
$90,239State:
$141,516
Occupied boats, RVs, vans, etc.: $39,875 Here:
$39,875State:
$60,504
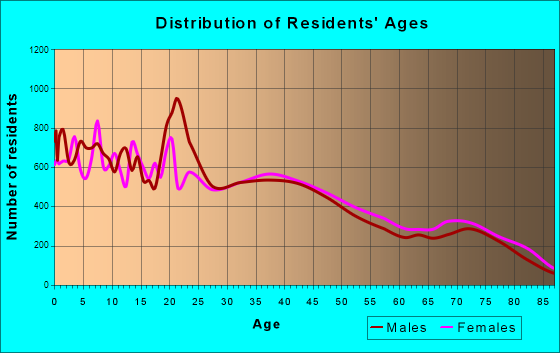
Total population: 93,400 (Urban population: 77,219 (74,355 inside urbanized areas, 2,864 inside urban clusters ), Rural population: 326 (42 farm, 284 nonfarm ))
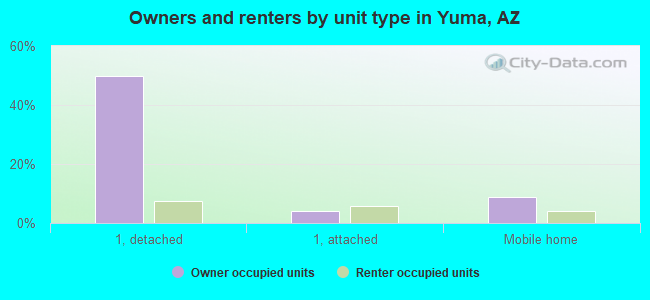
Houses: 45,408 (39,210 occupied: 26,294 owner occupied, 12,916 renter occupied )
% of renters here:
33%State:
33%
Housing density: 426 houses/condos per square mile
Median price asked for vacant for-sale houses and condos in 2022: $190,601.
Median contract rent in 2022: $799 (lower quartile is $626, upper quartile is $1,149)
Median rent asked for vacant for-rent units in 2022: $1,508
Median gross rent in Yuma, AZ in 2022: $943
Housing units in Yuma with a mortgage: 15,421 (454 second mortgage, 103 home equity loan, 307 both second mortgage and home equity loan )Houses without a mortgage: 294
Median household income for houses/condos with a mortgage: $83,446
Median household income for apartments without a mortgage: $60,449
Median monthly housing costs: $948
Data:
Median house or condo value ($)
Median house or condo value ($ change since 2000)
Median house or condo value ($) - White
Median house or condo value ($) - Black or African American
Median house or condo value ($) - Asian
Median house or condo value ($) - Hispanic or Latino
Median house or condo value ($) - American Indian and Alaska Native
Median house or condo value ($) - Multirace
Median house or condo value ($) - Other Race
Median price asked for mobile homes ($)
Household density (households per square mile)
Mean house or condo value by units in structure - 1, detached ($)
Mean house or condo value by units in structure - 1, attached ($)
Mean house or condo value by units in structure - 2 ($)
Mean house or condo value by units in structure by units in structure - 3 or 4 ($)
Mean house or condo value by units in structure - 5 or more ($)
Mean house or condo value by units in structure - Boat, RV, van, etc. ($)
Mean house or condo value by units in structure - Mobile home ($)
Median contract rent ($)
Median contract rent - Lower quartile ($)
Median contract rent - Upper quartile ($)
Median gross rent ($)
Urban houses (%)
Rural houses (%)
Houses occupied (%)
Houses occupied (% change since 2000)
Houses owner occupied (%)
Houses owner occupied (% change since 2000)
Houses renter occupied (%)
Houses renter occupied (% change since 2000)
Vacant housing units - For rent (%)
Vacant housing units - For rent (% change since 2000)
Vacant housing units - For sale only (%)
Vacant housing units - For sale only (% change since 2000)
Vacant housing units - Rented or sold, not occupied (%)
Vacant housing units - Rented or sold, not occupied (% change since 2000)
Vacant housing units - For seasonal, recreational, or occasional use (%)
Vacant housing units - For seasonal, recreational, or occasional use (% change since 2000)
Vacant housing units - For migrant workers (%)
Vacant housing units - For migrant workers (% change since 2000)
Vacant housing units - Other vacant (%)
Vacant housing units - Other vacant (% change since 2000)
Median monthly housing costs ($)
Median household income for houses/condos with a mortgage ($)
Median household income for houses/condos without a mortgage ($)
Median household income ($)
Median household income ($) - White
Median household income ($) - Black or African American
Median household income ($) - Asian
Median household income ($) - Hispanic or Latino
Median household income ($) - American Indian and Alaska Native
Median household income ($) - Multirace
Median household income ($) - Other Race
Mortgage status - with mortgage (%)
Mortgage status - with second mortgage (%)
Mortgage status - with home equity loan (%)
Mortgage status - with both second mortgage and home equity loan (%)
Mortgage status - without a mortgage (%)
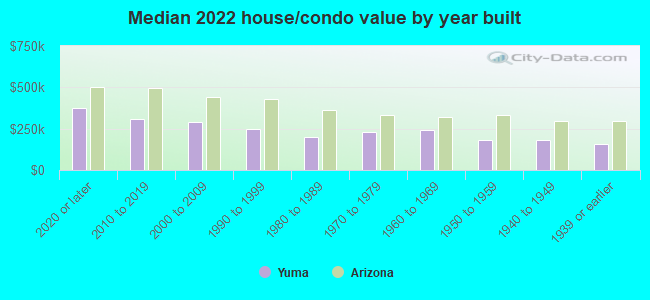
Median year house/condo built
Median year apartment built
Household type by relationship - Male householder living alone (%)
Household type by relationship - Male householder not living alone (%)
Household type by relationship - Female householder living alone (%)
Household type by relationship - Female householder not living alone (%)
Household type by relationship - Opposite-Sex spouse (%)
Household type by relationship - Same-Sex spouse (%)
Household type by relationship - Opposite-Sex unmarried partner (%)
Household type by relationship - Same-Sex unmarried partner (%)
Household type by relationship - In group quarters (%)
Size of family households - 2-person household (%)
Size of family households - 3-person household (%)
Size of family households - 4-person household (%)
Size of family households - 5-person household (%)
Size of family households - 6-person household (%)
Size of family households - 7-or-more-person household (%)
Size of nonfamily households - 1-person household (%)
Size of nonfamily households - 2-person household (%)
Size of nonfamily households - 3-person household (%)
Size of nonfamily households - 4-person household (%)
Size of nonfamily households - 5-person household (%)
Size of nonfamily households - 6-person household (%)
Size of nonfamily households - 7-or-moreperson household (%)
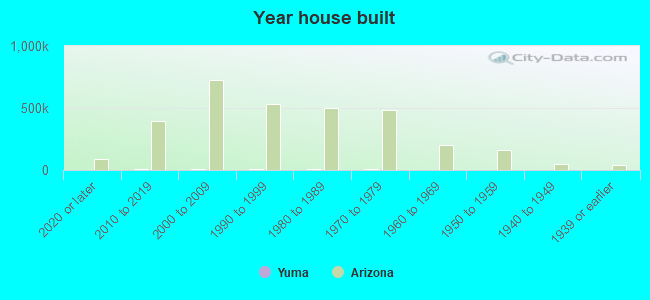
Year house built - Built 2010 or later (%)
Year house built - Built 2000 to 2009 (%)
Year house built - Built 1990 to 1999 (%)
Year house built - Built 1980 to 1989 (%)
Year house built - Built 1970 to 1979 (%)
Year house built - Built 1960 to 1969 (%)
Year house built - Built 1950 to 1959 (%)
Year house built - Built 1940 to 1949 (%)
Year house built - Built 1939 or earlier (%)
Median number of rooms in houses and condos
Median number of rooms in apartments
Median number of bedrooms in owner occupied houses
Mean number of bedrooms in owner occupied houses
Median number of bedrooms in renter occupied houses
Mean number of bedrooms in renter occupied houses
Median number of vehichles in owner occupied houses
Mean number of vehichles in owner occupied houses
Median number of vehichles in renter occupied houses
Mean number of vehichles in renter occupied houses
Rooms in owner-occupied houses - 1 room (%)
Rooms in owner-occupied houses - 2 rooms (%)
Rooms in owner-occupied houses - 3 rooms (%)
Rooms in owner-occupied houses - 4 rooms (%)
Rooms in owner-occupied houses - 5 rooms (%)
Rooms in owner-occupied houses - 6 rooms (%)
Rooms in owner-occupied houses - 7 rooms (%)
Rooms in owner-occupied houses - 8 rooms (%)
Rooms in owner-occupied houses - 9+ rooms (%)
Rooms in renter-occupied houses - 1 room (%)
Rooms in renter-occupied houses - 2 rooms (%)
Rooms in renter-occupied houses - 3 rooms (%)
Rooms in renter-occupied houses - 4 rooms (%)
Rooms in renter-occupied houses - 5 rooms (%)
Rooms in renter-occupied houses - 6 rooms (%)
Rooms in renter-occupied houses - 7 rooms (%)
Rooms in renter-occupied houses - 8 rooms (%)
Rooms in renter-occupied houses - 9+ rooms (%)
Bedrooms in owner-occupied houses - no bedrooms (%)
Bedrooms in owner-occupied houses - 1 bedroom (%)
Bedrooms in owner-occupied houses - 2 bedrooms (%)
Bedrooms in owner-occupied houses - 3 bedrooms (%)
Bedrooms in owner-occupied houses - 4 bedrooms (%)
Bedrooms in owner-occupied houses - 5+ bedrooms (%)
Bedrooms in renter-occupied houses - no bedrooms (%)
Bedrooms in renter-occupied houses - 1 bedroom (%)
Bedrooms in renter-occupied houses - 2 bedrooms (%)
Bedrooms in renter-occupied houses - 3 bedrooms (%)
Bedrooms in renter-occupied houses - 4 bedrooms (%)
Bedrooms in renter-occupied houses - 5+ bedrooms (%)
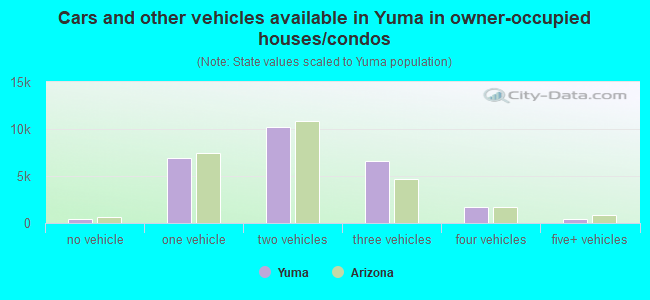
Vehicles available in owner-occupied houses - no vehicle available (%)
Vehicles available in owner-occupied houses - 1 vehicle available(%)
Vehicles available in owner-occupied houses - 2 Vehicles available (%)
Vehicles available in owner-occupied houses - 3 Vehicles available (%)
Vehicles available in owner-occupied houses - 4 Vehicles available (%)
Vehicles available in owner-occupied houses - 5+ Vehicles available (%)
Vehicles available in renter-occupied houses - no vehicle available (%)
Vehicles available in renter-occupied houses - 1 vehicle available (%)
Vehicles available in renter-occupied houses - 2 Vehicles available (%)
Vehicles available in renter-occupied houses - 3 Vehicles available (%)
Vehicles available in renter-occupied houses - 4 Vehicles available (%)
Vehicles available in renter-occupied houses - 5+ Vehicles available (%)
Housing units in structures - 1, detached (%)
Housing units in structures - 1, attached (%)
Housing units in structures - 2 (%)
Housing units in structures - 3 or 4 (%)
Housing units in structures - 5 to 9 (%)
Housing units in structures - 10 to 19 (%)
Housing units in structures - 20 to 49 (%)
Housing units in structures - 50 or more (%)
Housing units in structures - Mobile home (%)
Housing units in structures - Boat, RV, van, etc. (%)
Housing units in structures - Owners - 1, detached (%)
Housing units in structures - Owners - 1, attached (%)
Housing units in structures - Owners - 2 (%)
Housing units in structures - Owners - 3 or 4 (%)
Housing units in structures - Owners - 5 to 9 (%)
Housing units in structures - Owners - 10 to 19 (%)
Housing units in structures - Owners - 20 to 49 (%)
Housing units in structures - Owners - 50 or more (%)
Housing units in structures - Owners - Mobile home (%)
Housing units in structures - Owners - Boat, RV, van, etc. (%)
Housing units in structures - Renters - 1, detached (%)
Housing units in structures - Renters - 1, attached (%)
Housing units in structures - Renters - 2 (%)
Housing units in structures - Renters - 3 or 4 (%)
Housing units in structures - Renters - 5 to 9 (%)
Housing units in structures - Renters - 10 to 19 (%)
Housing units in structures - Renters - 20 to 49 (%)
Housing units in structures - Renters - 50 or more (%)
Housing units in structures - Renters - Mobile home (%)
Housing units in structures - Renters - Boat, RV, van, etc. (%)
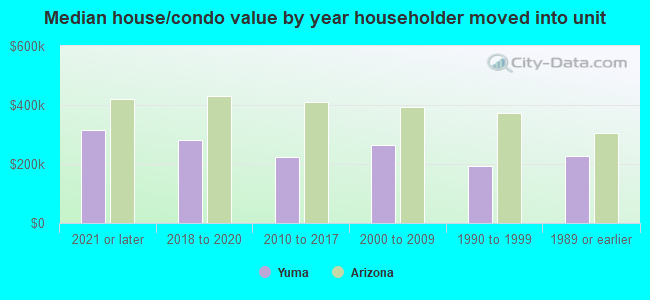
House/condo owner moved in on average (years ago)
Renter moved in on average (years ago)
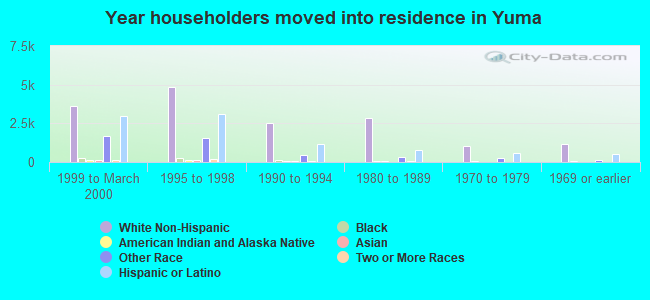
Year householder moved into unit - Moved in 1999 to March 2000 (%)
Year householder moved into unit - Moved in 1999 to March 2000 (%) - White
Year householder moved into unit - Moved in 1999 to March 2000 (%) - Black or African American
Year householder moved into unit - Moved in 1999 to March 2000 (%) - Asian
Year householder moved into unit - Moved in 1999 to March 2000 (%) - Hispanic or Latino
Year householder moved into unit - Moved in 1999 to March 2000 (%) - American Indian and Alaska Native
Year householder moved into unit - Moved in 1999 to March 2000 (%) - Multirace
Year householder moved into unit - Moved in 1999 to March 2000 (%) - Other Race
Year householder moved into unit - Moved in 1995 to 1998 (%)
Year householder moved into unit - Moved in 1995 to 1998 (%) - White
Year householder moved into unit - Moved in 1995 to 1998 (%) - Black or African American
Year householder moved into unit - Moved in 1995 to 1998 (%) - Asian
Year householder moved into unit - Moved in 1995 to 1998 (%) - Hispanic or Latino
Year householder moved into unit - Moved in 1995 to 1998 (%) - American Indian and Alaska Native
Year householder moved into unit - Moved in 1995 to 1998 (%) - Multirace
Year householder moved into unit - Moved in 1995 to 1998 (%) - Other Race
Year householder moved into unit - Moved in 1990 to 1994 (%)
Year householder moved into unit - Moved in 1990 to 1994 (%) - White
Year householder moved into unit - Moved in 1990 to 1994 (%) - Black or African American
Year householder moved into unit - Moved in 1990 to 1994 (%) - Asian
Year householder moved into unit - Moved in 1990 to 1994 (%) - Hispanic or Latino
Year householder moved into unit - Moved in 1990 to 1994 (%) - American Indian and Alaska Native
Year householder moved into unit - Moved in 1990 to 1994 (%) - Multirace
Year householder moved into unit - Moved in 1990 to 1994 (%) - Other Race
Year householder moved into unit - Moved in 1980 to 1989 (%)
Year householder moved into unit - Moved in 1980 to 1989 (%) - White
Year householder moved into unit - Moved in 1980 to 1989 (%) - Black or African American
Year householder moved into unit - Moved in 1980 to 1989 (%) - Asian
Year householder moved into unit - Moved in 1980 to 1989 (%) - Hispanic or Latino
Year householder moved into unit - Moved in 1980 to 1989 (%) - American Indian and Alaska Native
Year householder moved into unit - Moved in 1980 to 1989 (%) - Multirace
Year householder moved into unit - Moved in 1980 to 1989 (%) - Other Race
Year householder moved into unit - Moved in 1970 to 1979 (%)
Year householder moved into unit - Moved in 1970 to 1979 (%) - White
Year householder moved into unit - Moved in 1970 to 1979 (%) - Black or African American
Year householder moved into unit - Moved in 1970 to 1979 (%) - Asian
Year householder moved into unit - Moved in 1970 to 1979 (%) - Hispanic or Latino
Year householder moved into unit - Moved in 1970 to 1979 (%) - American Indian and Alaska Native
Year householder moved into unit - Moved in 1970 to 1979 (%) - Multirace
Year householder moved into unit - Moved in 1970 to 1979 (%) - Other Race
Year householder moved into unit - Moved in 1969 or earlier (%)
Year householder moved into unit - Moved in 1969 or earlier (%) - White
Year householder moved into unit - Moved in 1969 or earlier (%) - Black or African American
Year householder moved into unit - Moved in 1969 or earlier (%) - Asian
Year householder moved into unit - Moved in 1969 or earlier (%) - Hispanic or Latino
Year householder moved into unit - Moved in 1969 or earlier (%) - American Indian and Alaska Native
Year householder moved into unit - Moved in 1969 or earlier (%) - Multirace
Year householder moved into unit - Moved in 1969 or earlier (%) - Other Race
Housing units lacking complete plumbing facilities (%)
Housing units lacking complete kitchen facilities (%)
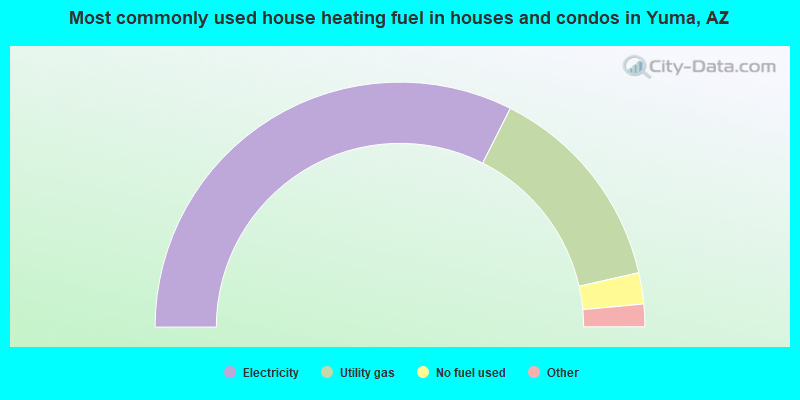
House heating fuel used in houses and condos - Utility gas (%)
House heating fuel used in houses and condos - Bottled, tank, or LP gas (%)
House heating fuel used in houses and condos - Electricity (%)
House heating fuel used in houses and condos - Fuel oil, kerosene, etc. (%)
House heating fuel used in houses and condos - Coal or coke (%)
House heating fuel used in houses and condos - Wood (%)
House heating fuel used in houses and condos - Solar energy (%)
House heating fuel used in houses and condos - Other fuel (%)
House heating fuel used in houses and condos - No fuel used (%)
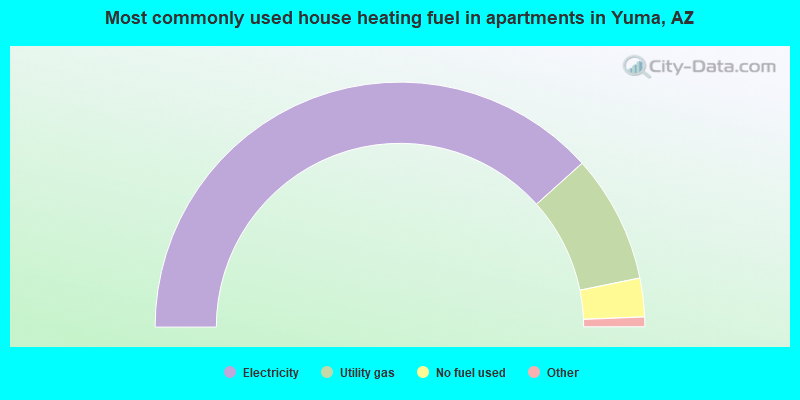
House heating fuel used in apartments - Utility gas (%)
House heating fuel used in apartments - Bottled, tank, or LP gas (%)
House heating fuel used in apartments - Electricity (%)
House heating fuel used in apartments - Fuel oil, kerosene, etc. (%)
House heating fuel used in apartments - Coal or coke (%)
House heating fuel used in apartments - Wood (%)
House heating fuel used in apartments - Solar energy (%)
House heating fuel used in apartments - Other fuel (%)
House heating fuel used in apartments - No fuel used (%)
Latest news about housing in Yuma, AZ collected exclusively by city-data.com from local newspapers, TV, and radio stations
Median year house/condo built: 1995Median year apartment built: 1980Household type by relationship:
Households: 98,517
Male householders: 20,568 (4,184 living alone ), Female householders: 18,642 (5,831 living alone )18,870 spouses (18,870 opposite-sex spouses ), 2,316 unmarried partners , (2,316 opposite-sex unmarried partners ), 28,975 children (26,976 natural , 868 adopted , 1,131 stepchildren ), 3,792 grandchildren , 193 brothers or sisters , 724 parents , 0 foster children , 1,428 other relatives , 479 non-relatives In group quarters: 2,530
Size of family households: 11,244 2-persons , 6,210 3-persons , 4,636 4-persons , 3,599 5-persons , 635 6-persons , 1,154 7-or-more-persons .
Size of nonfamily households: 10,015 1-person , 1,717 2-persons .
15,117 married couples with children. single-parent households (2,004 men , 5,094 women ).
53.3% of residents of Yuma speak English at home. of residents speak Spanish at home (67% speak English very well , 14% speak English well , 11% speak English not well , 8% don't speak English at all ).of residents speak other Indo-European language at home (86% speak English very well , 12% speak English well , 2% don't speak English at all ).of residents speak Asian or Pacific Island language at home (74% speak English very well , 23% speak English well , 4% speak English not well ).of residents speak other language at home (97% speak English very well , 3% speak English not well ).
Foreign born population: 19,130 (19.4%)of them are naturalized citizens )
Median number of rooms in houses and condos:
Median number of rooms in apartments
Owner-occupied Renter-occupied
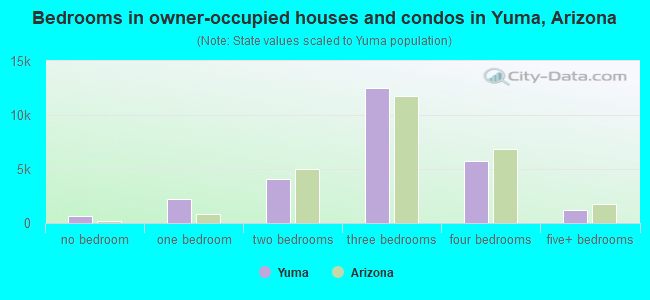
Bedrooms in owner-occupied houses and condos in Yuma, Arizona
613 no bedroom 2,189 1 bedroom 4,112 2 bedrooms 12,454 3 bedrooms 5,767 4 bedrooms 1,159 5+ bedrooms
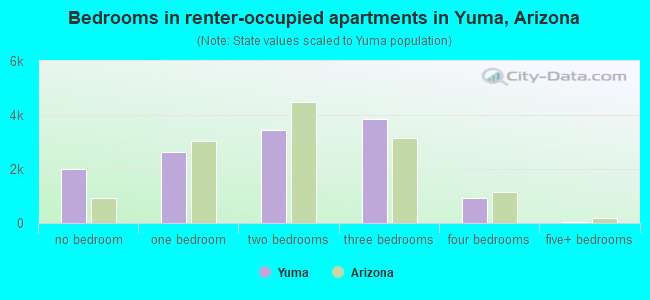
Bedrooms in renter-occupied apartments in Yuma, Arizona
1,999 no bedroom 2,636 1 bedroom 3,449 2 bedrooms 3,864 3 bedrooms 916 4 bedrooms 52 5+ bedrooms
Owner-occupied Renter-occupied
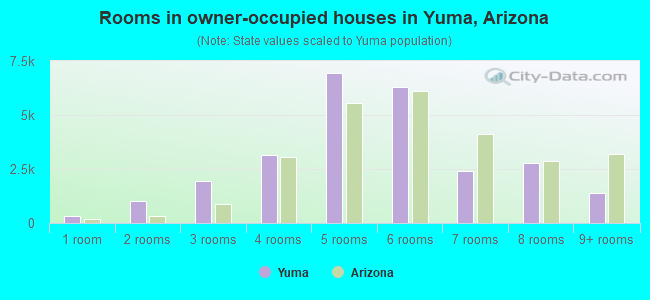
Rooms in owner-occupied houses in Yuma, Arizona
329 1 room 1,022 2 rooms 1,950 3 rooms 3,127 4 rooms 6,933 5 rooms 6,300 6 rooms 2,426 7 rooms 2,800 8 rooms 1,407 9+ rooms
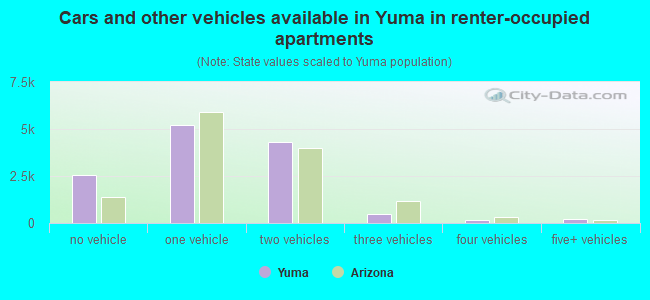
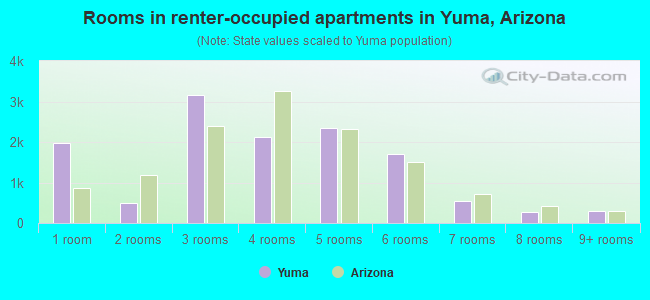
Rooms in renter-occupied apartments in Yuma, Arizona
1,971 1 room 494 2 rooms 3,168 3 rooms 2,113 4 rooms 2,344 5 rooms 1,708 6 rooms 544 7 rooms 280 8 rooms 294 9+ rooms
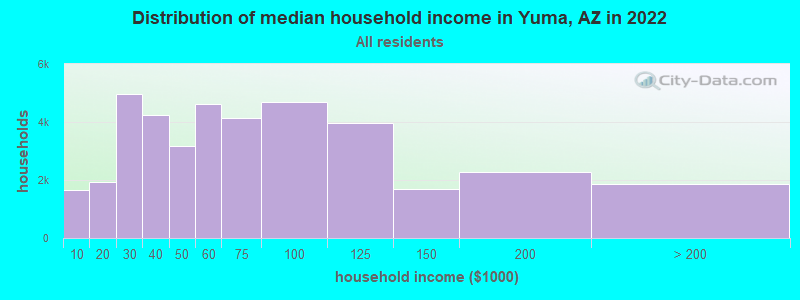
Yuma, AZ household income distribution 1,653 Less than $10,0001,925 $10,000 to $19,9994,969 $20,000 to $29,9994,237 $30,000 to $39,9993,179 $40,000 to $49,9994,634 $50,000 to $59,9994,137 $60,000 to $74,9994,690 $75,000 to $99,9993,980 $100,000 to $124,9991,678 $125,000 to $149,9992,265 $150,000 to $199,9991,863 $200,000 or more
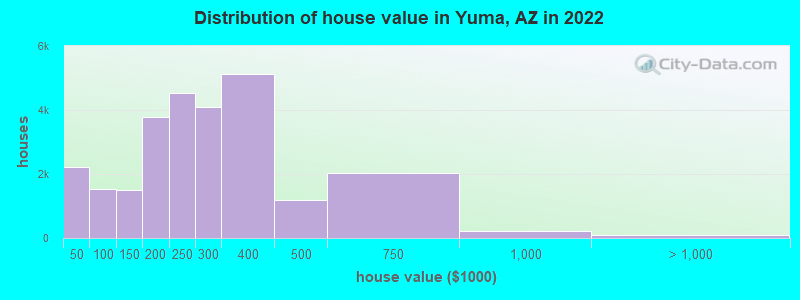
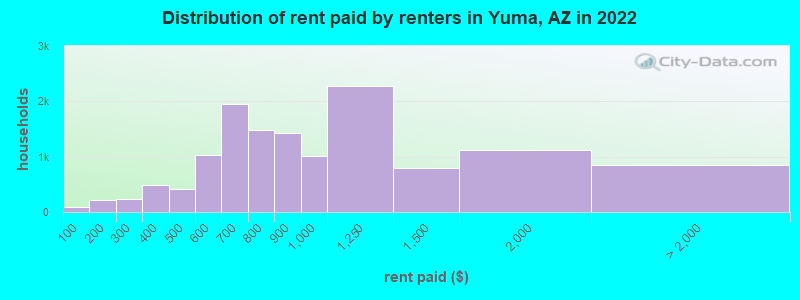
Home value of owner - occupied houses in 2022 in Yuma, AZ 863 Less than $10,00089 $10,000 to $14,999323 $15,000 to $19,999432 $20,000 to $24,999204 $25,000 to $29,99967 $30,000 to $34,999217 $35,000 to $39,99935 $40,000 to $49,999186 $50,000 to $59,999524 $60,000 to $69,999275 $70,000 to $79,999355 $80,000 to $89,999145 $90,000 to $99,999707 $100,000 to $124,999800 $125,000 to $149,9991,916 $150,000 to $174,9991,871 $175,000 to $199,9994,541 $200,000 to $249,9994,088 $250,000 to $299,9995,137 $300,000 to $399,9991,180 $400,000 to $499,9992,020 $500,000 to $749,999225 $750,000 to $999,99994 $2,000,000 or moreRent paid by renters in 2022 in Yuma, AZ 85 Less than $10076 $100 to $149132 $150 to $199148 $200 to $24994 $250 to $299281 $300 to $349210 $350 to $399306 $400 to $449117 $450 to $499578 $500 to $549457 $550 to $5991,078 $600 to $649864 $650 to $699500 $700 to $749988 $750 to $7991,429 $800 to $8991,005 $900 to $9992,270 $1,000 to $1,249797 $1,250 to $1,4991,129 $1,500 to $1,999213 $2,000 to $2,49912 $2,500 to $2,99924 $3,500 or more593 No cash rent
Percentage of workers working in this county: 91.4%Number of people working at home: 3,856 (8.9% of all workers )
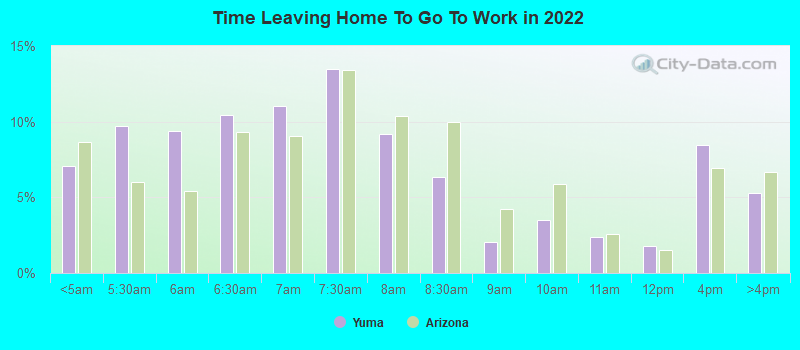
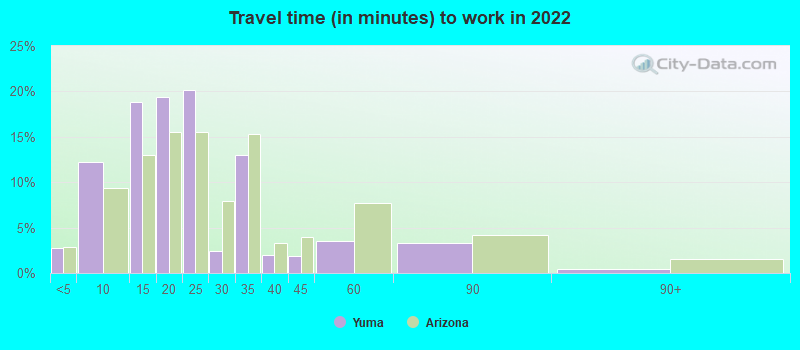
Travel time to work (commute)
Less than 5 minutes: 1,2305 to 9 minutes: 5,65710 to 14 minutes: 8,39915 to 19 minutes: 9,43220 to 24 minutes: 5,95225 to 29 minutes: 68430 to 34 minutes: 2,83335 to 39 minutes: 52440 to 44 minutes: 25945 to 59 minutes: 1,12560 to 89 minutes: 1,10390 or more minutes: 253
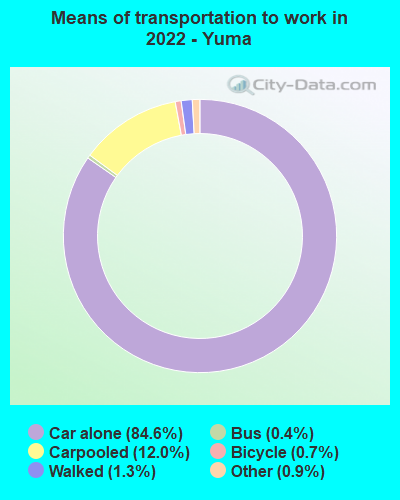
Means of transportation to work:
Drove a car alone: 39,669 (75.0%)Carpooled: 5,918 (11.2%)Bus : 116 (0.2%)Long-distance train or commuter rail : 22 (0.0%)Ferryboat: 19 (0.0%)Taxi: 498 (0.9%)Bicycle: 273 (0.5%)Walked: 649 (1.2%)Worked at home: 3,856 (7.3%)
Unemployment by race in 2022
Unemployment rate for White non-Hispanic residents 2.0% Males1.8% FemalesUnemployment rate for Black residents 11.8% FemalesUnemployment rate for American Indian and Alaska Native residents 6.3% Males2.9% FemalesUnemployment rate for Asian residents 8.3% Males2.2% FemalesUnemployment rate for other race residents 5.2% Males7.0% FemalesUnemployment rate for two or more race residents 10.2% Males6.8% FemalesUnemployment rate for Hispanic or Latino residents 5.4% Males5.6% Females
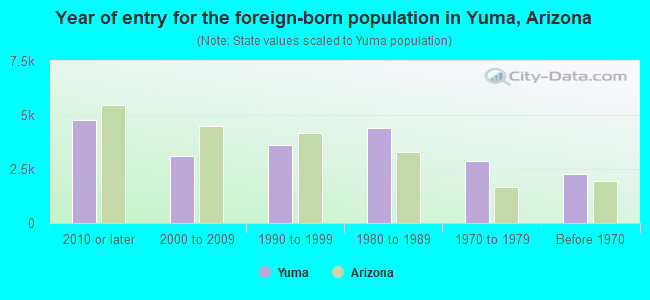
Year of entry for the foreign-born population in Yuma, Arizona
4,773 2010 or later 3,114 2000 to 2009 3,607 1990 to 1999 4,413 1980 to 1989 2,868 1970 to 1979 2,280 Before 1970
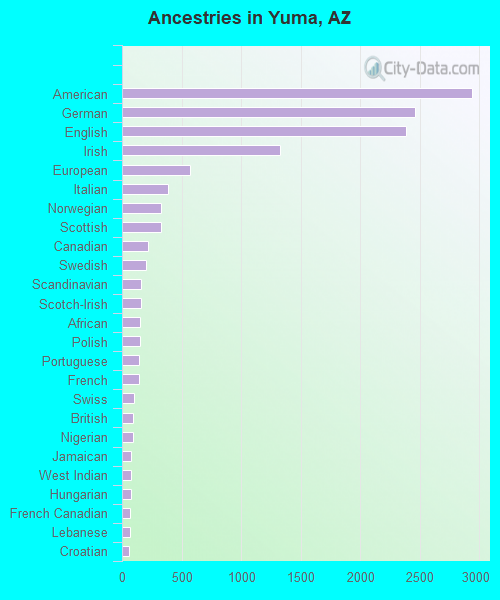
First ancestries reported:
American: 2,936 (4.5%)
German: 2,461 (3.8%)
English: 2,387 (3.6%)
Irish: 1,329 (2.0%)
European: 568 (0.9%)
Italian: 388 (0.6%)
Norwegian: 331 (0.5%)
Scottish: 328 (0.5%)
Canadian: 216 (0.3%)
Swedish: 198 (0.3%)
Scandinavian: 162 (0.2%)
Scotch-Irish: 160 (0.2%)
African: 151 (0.2%)
Polish: 150 (0.2%)
Portuguese: 145 (0.2%)
French: 140 (0.2%)
Swiss: 104 (0.2%)
British: 96 (0.1%)
Nigerian: 92 (0.1%)
Jamaican: 78 (0.1%)
West Indian: 73 (0.1%)
Hungarian: 72 (0.1%)
French Canadian: 68 (0.1%)
Lebanese: 66 (0.1%)
Croatian: 63 (0.10%)
Dutch: 63 (0.10%)
Ukrainian: 62 (0.09%)
Czech: 60 (0.09%)
Jordanian: 55 (0.08%)
Danish: 24 (0.04%)
Latvian: 22 (0.03%)
British West Indian: 22 (0.03%)
Welsh: 21 (0.03%)
Iraqi: 19 (0.03%)
Austrian: 18 (0.03%)
Finnish: 17 (0.03%)
Eastern European: 17 (0.03%)
Bulgarian: 17 (0.03%)
Yugoslavian: 17 (0.03%)
Lithuanian: 14 (0.02%)
Greek: 13 (0.02%)
Northern European: 12 (0.02%)
Ghanaian: 11 (0.02%)
Romanian: 7 (0.01%)
Czechoslovakian: 6 (0.01%)
Brazilian: 6 (0.01%)
Most common places of birth for foreign-born residents (%): Mexico Yuma:
80.9% (15,311)Arizona:
53.4% (500,086)
Canada Yuma:
3.7% (699)Arizona:
4.3% (40,102)
Philippines Yuma:
3.5% (660)Arizona:
3.2% (30,378)
Place of birth for U.S.-born residents:
This state: 40,845Other state: 36,004Northeast: 1,802Midwest: 6,128South: 6,956West: 21,118 86.7% of Yuma residents lived in the same house 1 years ago.
Out of people who lived in different houses, 26.1% lived in this county.
Out of people who lived in different counties, 33.5% lived in Arizona.
Yuma:
86.7%State average:
86.0%
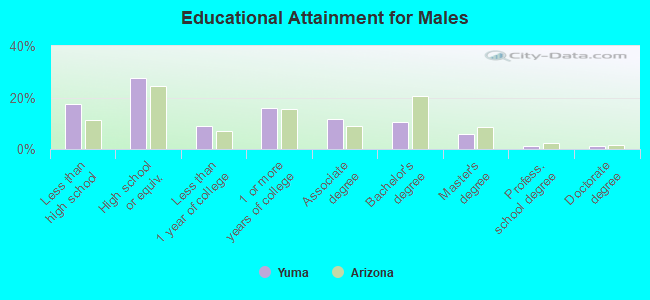
Education attainment for males 25 years and older:
No schooling: 1,135Nursery to 4th grade: 05th and 6th grade: 4377th and 8th grade: 2549th grade: 25210th grade: 1,11411th grade: 61312th grade, no diploma: 1,204High school graduate (or equivalency): 7,962Less than 1 year of college: 2,567Some college more than 1 year, no degree: 4,578Associate degree: 3,368Bachelor's degree: 3,049Master's degree: 1,721Professional school degree: 355Doctorate degree: 321
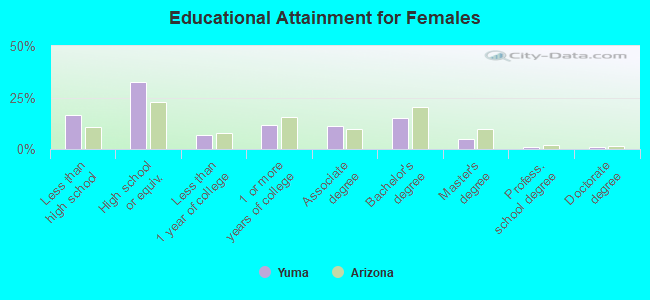
Education attainment for females 25 years and older:
No schooling: 1,445Nursery to 4th grade: 525th and 6th grade: 9337th and 8th grade: 3129th grade: 81610th grade: 17111th grade: 60012th grade, no diploma: 803High school graduate (or equivalency): 10,029Less than 1 year of college: 2,118Some college more than 1 year, no degree: 3,564Associate degree: 3,474Bachelor's degree: 4,712Master's degree: 1,530Professional school degree: 241Doctorate degree: 231
Housing units in structures:
One, detached: 24,244One, attached: 3,955Two: 1,6473 or 4: 2,6405 to 9: 1,65810 to 19: 1,99820 to 49: 84750 or more: 1,181Mobile homes: 6,818Boats, RVs, vans, etc.: 420Median worth of mobile homes: $50,400
Housing units lacking complete plumbing facilities in 2022: 0.1%Housing units lacking complete kitchen facilities in 2022: 0.5%House/condo owner moved in on average 7 years ago
Renter moved in on average 1 years ago
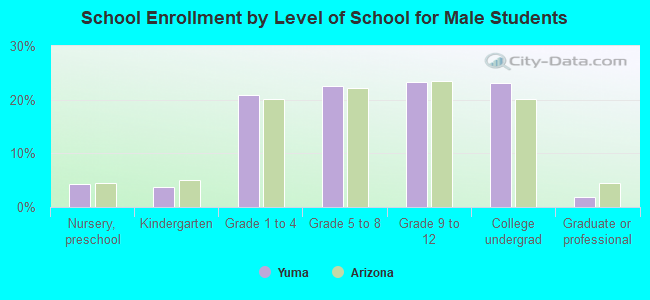
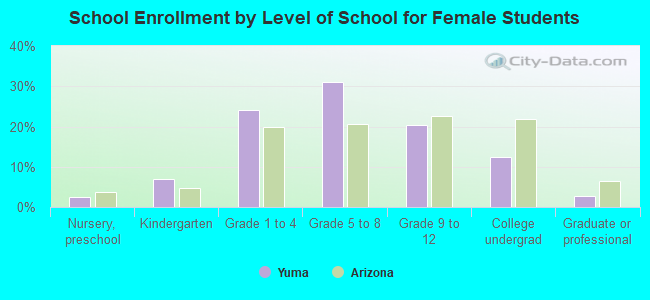
Private vs. public school enrollment:
Students in private schools in grades 1 to 8 (elementary and middle school): 1,846 Students in private schools in grades 9 to 12 (high school): 437 Students in private undergraduate colleges: 296