Allons, Tennessee (TN) income map, earnings map, and wages data
The median household income in Allons, TN in 2022 was $55,094, which was 18.4% less than the median annual income of $65,254 across the entire state of Tennessee. Compared to the median income of $30,757 in 2000 this represents an increase of 44.2%. The per capita income in 2022 was $23,618, which means an increase of 47.0% compared to 2000 when it was $12,522.
Income statistics for all residents
Median household income in Allons, TN in 2022:| Allons: | $55,095 |
| State: | $65,254 |
Change in median household income between 2000 and 2022:| Allons, Tennessee: | +79.1% |
| State: | +79.5% |
Number of households with income < $10k:| Allons: | 5.4% (65,377) |
| State: | 5.4% (154,793) |
Number of households with income $10k - 20k:| Allons: | 8.0% (96,690) |
| State: | 8.0% (228,599) |
Number of households with income $20k - 30k:| Allons: | 7.9% (95,086) |
| State: | 7.9% (224,908) |
Number of households with income $30k - 40k:| Allons: | 8.6% (103,213) |
| State: | 8.6% (244,297) |
Number of households with income $40k - 50k:| Allons: | 8.4% (100,941) |
| Tennessee: | 8.4% (238,949) |
Number of households with income $50k - 60k:| Allons: | 7.7% (92,288) |
| Tennessee: | 7.7% (218,438) |
Number of households with income $60k - 75k:| Allons: | 10.3% (124,302) |
| State: | 10.3% (294,172) |
Number of households with income $75k - 100k:| Allons: | 13.3% (159,421) |
| State: | 13.3% (377,310) |
Number of households with income $100k - 125k:| Allons: | 9.5% (113,772) |
| State: | 9.5% (269,124) |
Number of households with income $125k - 150k:| Allons: | 6.3% (75,299) |
| State: | 6.3% (178,328) |
Number of households with income $150k - 200k:| Allons: | 7.2% (86,115) |
| State: | 7.2% (204,030) |
Number of households with income > $200k:| Allons: | 7.5% (90,037) |
| Tennessee: | 7.5% (213,736) |
Aggregate household income in Allons in 2022: $1,285,467,150
Median family income in Allons in 2022:| Allons: | $62,263 |
| State: | $80,910 |
Median non-family income in Allons in 2022:| Allons: | $17,316 |
| State: | $40,285 |
Change in median non-family income between 2000 and 2022:| Allons, Tennessee: | +91.6% |
| State: | +91.5% |
Median per capita income in Allons in 2022:| Allons: | $23,618 |
| State: | $36,704 |
Change in median per capita income between 2000 and 2022:| Allons, Tennessee: | +88.6% |
| Tennessee: | +89.3% |
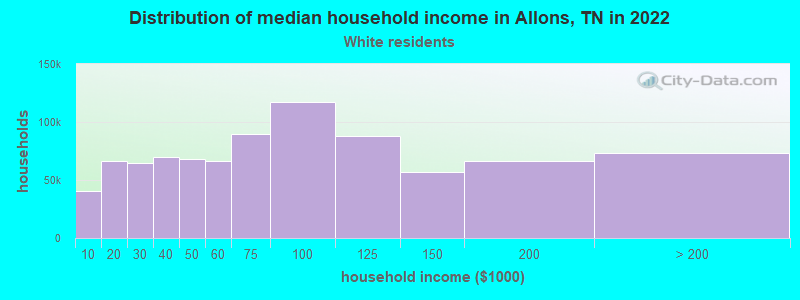
Income statistics for White residents
Median household income in Allons, TN in 2022:| Allons: | $55,623 |
| Tennessee: | $69,826 |
Change in median household income between 2000 and 2022:| Allons, Tennessee: | +80.8% |
| Tennessee: | +82.9% |
Number of households with income < $10k:| Allons: | 4.7% (40,466) |
| Tennessee: | 4.6% (100,279) |
Number of households with income $10k - 20k:| Allons: | 7.7% (66,703) |
| State: | 7.6% (165,031) |
Number of households with income $20k - 30k:| Allons: | 7.5% (64,739) |
| Tennessee: | 7.4% (160,229) |
Number of households with income $30k - 40k:| Allons: | 8.1% (70,242) |
| State: | 8.1% (174,784) |
Number of households with income $40k - 50k:| Allons: | 7.9% (68,256) |
| State: | 7.8% (169,622) |
Number of households with income $50k - 60k:| Allons: | 7.7% (66,440) |
| Tennessee: | 7.6% (165,508) |
Number of households with income $60k - 75k:| Allons: | 10.4% (90,018) |
| State: | 10.3% (223,937) |
Number of households with income $75k - 100k:| Allons: | 13.5% (117,373) |
| State: | 13.5% (292,688) |
Number of households with income $100k - 125k:| Allons: | 10.1% (87,923) |
| State: | 10.1% (219,251) |
Number of households with income $125k - 150k:| Allons: | 6.6% (56,972) |
| State: | 6.6% (142,574) |
Number of households with income $150k - 200k:| Allons: | 7.6% (66,195) |
| Tennessee: | 7.7% (166,039) |
Number of households with income > $200k:| Allons: | 8.4% (72,946) |
| State: | 8.5% (184,546) |
Aggregate household income in Allons in 2022: $1,033,937,914
Median family income in Allons in 2022:| Allons: | $62,518 |
| Tennessee: | $86,015 |
Number of families with income < $10k:| Allons: | 5.7% (19) |
| Tennessee: | 3.1% (43,751) |
Number of families with income $10k - 20k:| Allons: | 14.6% (48) |
| State: | 3.5% (49,925) |
Number of families with income $20k - 30k:| Allons: | 7.0% (23) |
| State: | 5.0% (70,431) |
Number of families with income $30k - 40k:| Allons: | 18.0% (59) |
| State: | 6.6% (93,498) |
Number of families with income $40k - 50k:| Allons: | 14.9% (49) |
| State: | 6.8% (96,726) |
Number of families with income $50k - 60k:| Allons: | 18.3% (60) |
| Tennessee: | 7.2% (101,879) |
Number of families with income $60k - 75k:| Allons: | 5.5% (18) |
| State: | 10.7% (151,997) |
Number of families with income $75k - 100k:| Allons: | 11.4% (38) |
| Tennessee: | 15.4% (218,373) |
Number of families with income $100k - 125k:| Allons: | 4.6% (15) |
| State: | 12.6% (178,761) |
Median non-family income in Allons in 2022:| Allons: | $17,270 |
| Tennessee: | $41,178 |
Change in median non-family income between 2000 and 2022:| Allons, Tennessee: | +91.1% |
| Tennessee: | +91.1% |
Median per capita income in Allons in 2022:| Allons: | $24,097 |
| State: | $40,126 |
Change in median per capita income between 2000 and 2022:| Allons, Tennessee: | +91.8% |
| Tennessee: | +92.6% |