The median household income in Arlington, KS in 2022 was $37,675, which was 82.9% less than the median annual income of $68,925 across the entire state of Kansas. Compared to the median income of $29,453 in 2000 this represents an increase of 21.8%. The per capita income in 2022 was $22,896, which means an increase of 37.6% compared to 2000 when it was $14,289.
Whole page based on the data from 2000 / 2022 when the population of Arlington, Kansas was 459 / 475
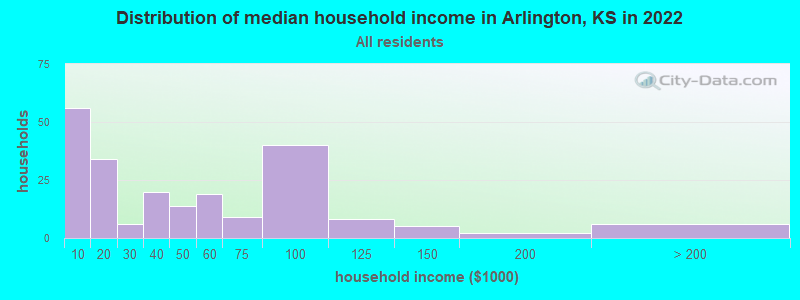
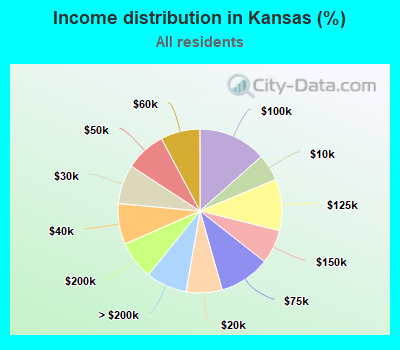
Income statistics for all residents
Median household income in Arlington, KS in 2022:
Arlington:
$37,676
State:
$68,925
Change in median household income between 2000 and 2022:
Arlington, Kansas:
+27.9%
State:
+69.7%
Number of households with income < $10k:
Arlington:
25.6% (56)
State:
5.3% (62,150)
Number of households with income $10k - 20k:
Arlington:
15.5% (34)
State:
7.1% (83,216)
Number of households with income $20k - 30k:
Arlington:
2.7% (6)
State:
7.8% (91,088)
Number of households with income $30k - 40k:
Arlington:
9.1% (20)
State:
8.0% (94,460)
Number of households with income $40k - 50k:
Arlington:
6.4% (14)
Kansas:
8.0% (93,996)
Number of households with income $50k - 60k:
Arlington:
8.7% (19)
Kansas:
7.8% (91,448)
Number of households with income $60k - 75k:
Arlington:
4.1% (9)
State:
10.0% (118,030)
Number of households with income $75k - 100k:
Arlington:
18.3% (40)
State:
13.5% (158,162)
Number of households with income $100k - 125k:
Arlington:
3.7% (8)
State:
10.1% (119,120)
Number of households with income $125k - 150k:
Arlington:
2.3% (5)
State:
6.7% (79,026)
Number of households with income $150k - 200k:
Arlington:
0.9% (2)
State:
7.6% (89,342)
Number of households with income > $200k:
Arlington:
2.7% (6)
Kansas:
8.1% (95,256)
Aggregate household income in Arlington in 2022: $10,567,985
Median non-family income in Arlington in 2022:
Arlington:
$35,548
State:
$39,735
Median per capita income in Arlington in 2022:
Arlington:
$22,897
State:
$37,919
Change in median per capita income between 2000 and 2022:
Arlington, Kansas:
+60.2%
State:
+84.9%
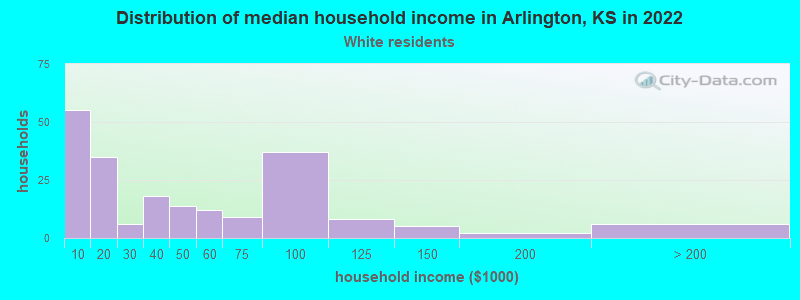
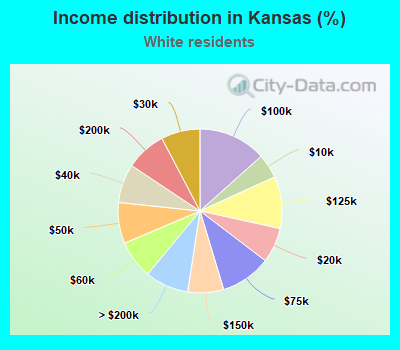
Income statistics for White residents
Median household income in Arlington, KS in 2022:
Arlington:
$35,504
State:
$70,867
Change in median household income between 2000 and 2022:
Arlington, Kansas:
+19.9%
Kansas:
+70.0%
Number of households with income < $10k:
Arlington:
26.6% (55)
Kansas:
4.8% (45,776)
Number of households with income $10k - 20k:
Arlington:
16.9% (35)
Kansas:
6.9% (65,871)
Number of households with income $20k - 30k:
Arlington:
2.9% (6)
Kansas:
7.7% (73,347)
Number of households with income $30k - 40k:
Arlington:
8.7% (18)
State:
7.7% (73,088)
Number of households with income $40k - 50k:
Arlington:
6.8% (14)
Kansas:
8.1% (77,163)
Number of households with income $50k - 60k:
Arlington:
5.8% (12)
State:
7.6% (72,222)
Number of households with income $60k - 75k:
Arlington:
4.3% (9)
State:
10.0% (95,343)
Number of households with income $75k - 100k:
Arlington:
17.9% (37)
Kansas:
13.4% (127,944)
Number of households with income $100k - 125k:
Arlington:
3.9% (8)
State:
10.3% (97,946)
Number of households with income $125k - 150k:
Arlington:
2.4% (5)
State:
7.1% (67,594)
Number of households with income $150k - 200k:
Arlington:
1.0% (2)
State:
8.0% (76,160)
Number of households with income > $200k:
Arlington:
2.9% (6)
State:
8.6% (82,143)
Aggregate household income in Arlington in 2022: $9,880,802
Median non-family income in Arlington in 2022:
Arlington:
$33,752
Kansas:
$40,531
Change in median non-family income between 2000 and 2022:
Arlington, Kansas:
+129.8%
State:
+72.5%
Median per capita income in Arlington in 2022:
Arlington:
$22,784
Kansas:
$41,198
Change in median per capita income between 2000 and 2022:
Arlington, Kansas:
+56.8%
Kansas:
+90.0%
Income statistics for Hispanic or Latino residents
Aggregate household income in Arlington in 2022: $421,069
Median per capita income in Arlington in 2022:
Arlington:
$9,199
State:
$21,756
Change in median per capita income between 2000 and 2022:
Arlington, Kansas:
+131.1%
State:
+94.6%
Income statistics for Multirace residents
Aggregate household income in Arlington in 2022: $81,147
Median per capita income in Arlington in 2022:
Arlington:
$26,538
State:
$24,379
Income statistics for other residents
Median per capita income in Arlington in 2022:
Arlington:
$8,916
State:
$22,862
Change in median per capita income between 2000 and 2022:
Arlington, Kansas:
+124.0%
Kansas:
+109.5%
Discuss Arlington, Kansas (KS) on our hugely popular Kansas forum.