The median household income in Arlington, TX in 2022 was $70,433, which was 2.6% less than the median annual income of $72,284 across the entire state of Texas. Compared to the median income of $47,622 in 2000 this represents an increase of 32.4%. The per capita income in 2022 was $32,995, which means an increase of 32.0% compared to 2000 when it was $22,445.
Whole page based on the data from 2000 / 2022 when the population of Arlington, Texas was 332,969 / 394,573
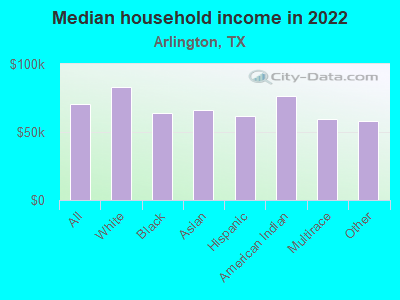
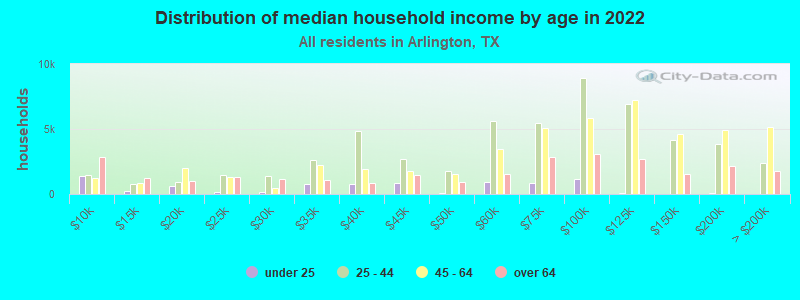
Income statistics for all residents
Median household income in Arlington, TX in 2022:
Arlington:
$70,433
State:
$72,284
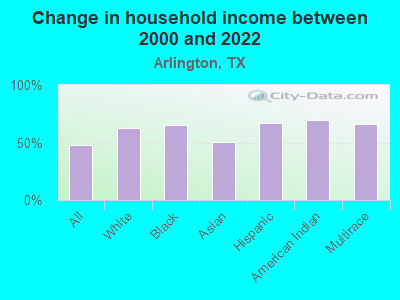
Change in median household income between 2000 and 2022:
Arlington, Texas:
+47.9%
State:
+81.0%
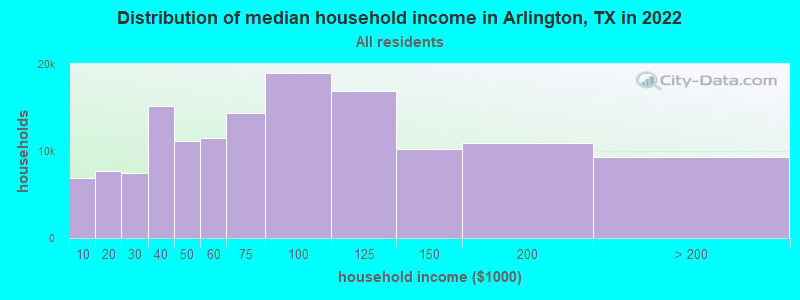
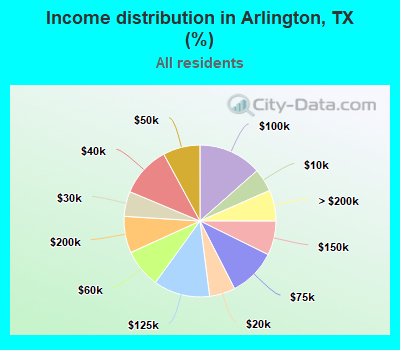
Number of households with income < $10k:
Arlington:
4.9% (6,926)
State:
5.5% (611,011)
Number of households with income $10k - 20k:
Arlington:
5.5% (7,708)
State:
6.7% (743,157)
Number of households with income $20k - 30k:
Arlington:
5.3% (7,476)
Texas:
7.2% (803,381)
Number of households with income $30k - 40k:
Arlington:
10.8% (15,153)
Texas:
7.8% (866,080)
Number of households with income $40k - 50k:
Arlington:
7.9% (11,102)
State:
7.3% (810,440)
Number of households with income $50k - 60k:
Arlington:
8.2% (11,542)
State:
7.2% (799,783)
Number of households with income $60k - 75k:
Arlington:
10.2% (14,315)
State:
9.9% (1,095,384)
Number of households with income $75k - 100k:
Arlington:
13.5% (18,969)
State:
12.8% (1,419,057)
Number of households with income $100k - 125k:
Arlington:
12.0% (16,886)
State:
9.5% (1,054,577)
Number of households with income $125k - 150k:
Arlington:
7.3% (10,225)
Texas:
6.7% (741,518)
Number of households with income $150k - 200k:
Arlington:
7.8% (10,940)
Texas:
8.7% (961,776)
Number of households with income > $200k:
Arlington:
6.6% (9,283)
State:
10.7% (1,181,544)
Aggregate household income in Arlington in 2022: $12,664,985,100
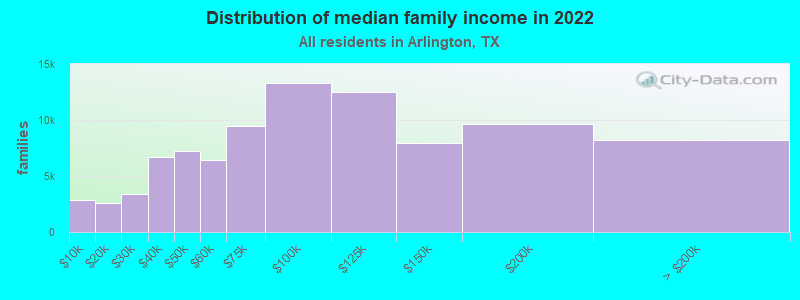
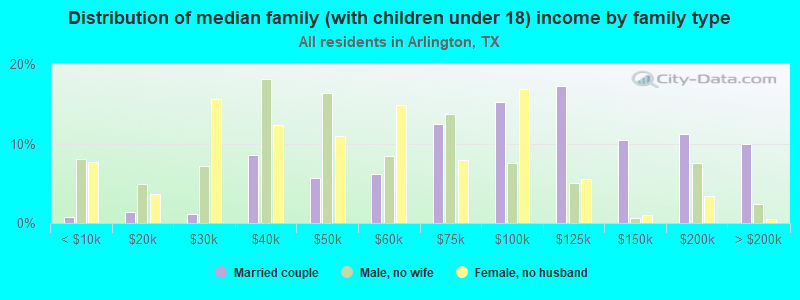
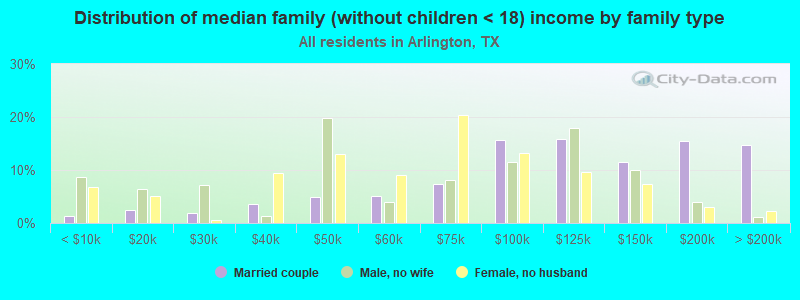
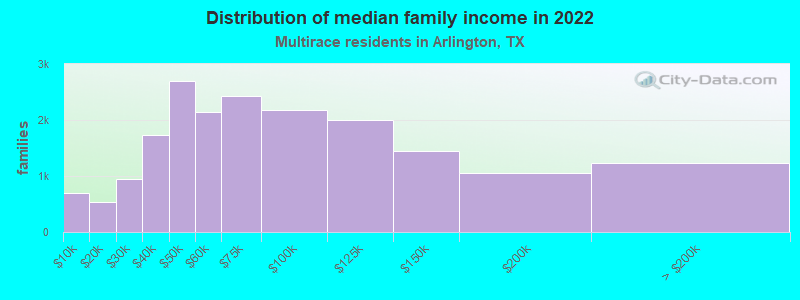
Median family income in Arlington in 2022:
Arlington:
$86,261
Texas:
$86,267
Number of families with income < $10k:
Arlington:
3.1% (2,822)
State:
4.0% (297,884)
Number of families with income $10k - 20k:
Arlington:
2.9% (2,579)
State:
4.3% (324,514)
Number of families with income $20k - 30k:
Arlington:
3.8% (3,435)
Texas:
5.8% (430,949)
Number of families with income $30k - 40k:
Arlington:
7.4% (6,692)
Texas:
6.6% (493,535)
Number of families with income $40k - 50k:
Arlington:
8.0% (7,192)
Texas:
6.7% (499,663)
Number of families with income $50k - 60k:
Arlington:
7.1% (6,403)
Texas:
6.6% (492,203)
Number of families with income $60k - 75k:
Arlington:
10.5% (9,487)
State:
9.5% (710,229)
Number of families with income $75k - 100k:
Arlington:
14.7% (13,293)
State:
13.6% (1,015,480)
Number of families with income $100k - 125k:
Arlington:
13.9% (12,544)
Texas:
10.7% (797,961)
Number of families with income $125k - 150k:
Arlington:
8.8% (7,980)
State:
8.1% (602,985)
Number of families with income $150k - 200k:
Arlington:
10.7% (9,622)
State:
10.7% (804,459)
Number of families with income > $200k:
Arlington:
9.1% (8,215)
State:
13.5% (1,013,514)
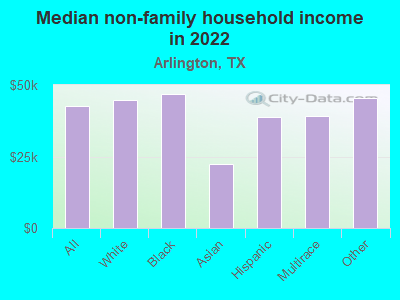
Median non-family income in Arlington in 2022:
Arlington:
$42,492
Texas:
$45,999
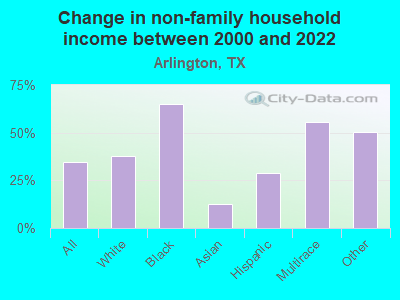
Change in median non-family income between 2000 and 2022:
Arlington, Texas:
+34.8%
State:
+79.5%
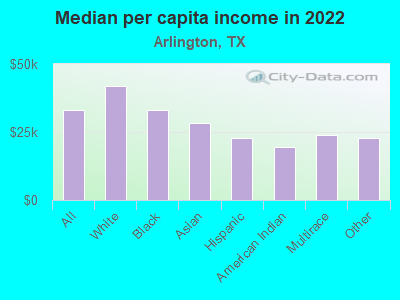
Median per capita income in Arlington in 2022:
Arlington:
$32,995
State:
$38,123
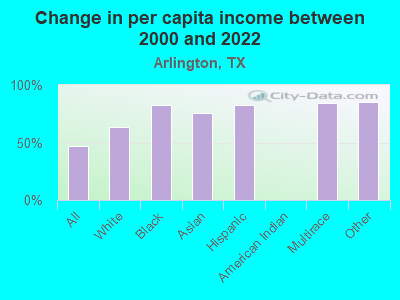
Change in median per capita income between 2000 and 2022:
Arlington, Texas:
+47.0%
Texas:
+94.3%
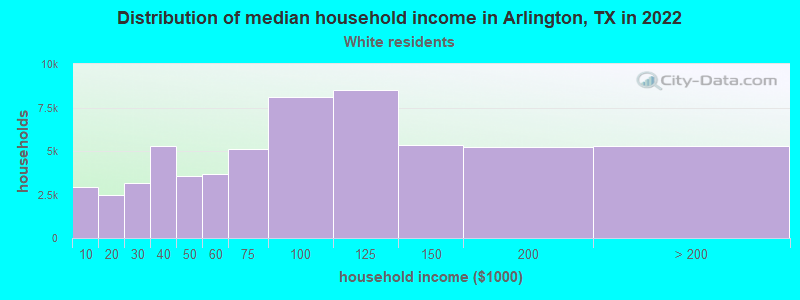
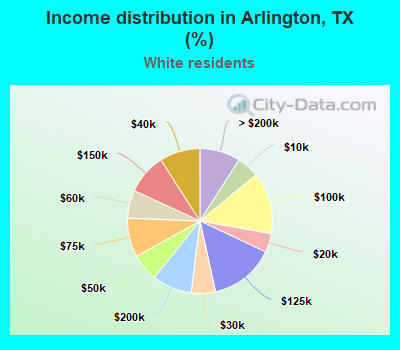
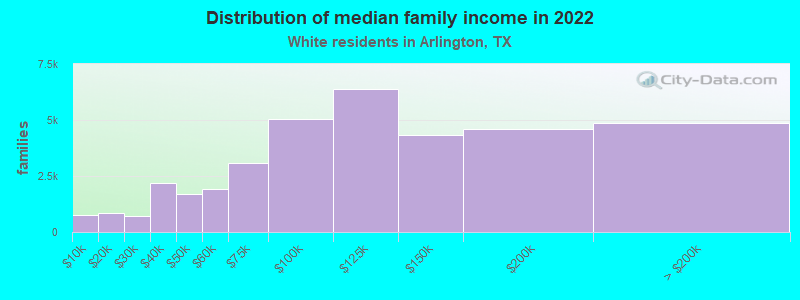
Income statistics for White residents
Median household income in Arlington, TX in 2022:
Arlington:
$83,245
State:
$82,032
Change in median household income between 2000 and 2022:
Arlington, Texas:
+62.2%
State:
+91.0%
Number of households with income < $10k:
Arlington:
5.0% (2,920)
State:
4.7% (273,716)
Number of households with income $10k - 20k:
Arlington:
4.2% (2,455)
State:
5.5% (322,702)
Number of households with income $20k - 30k:
Arlington:
5.4% (3,175)
State:
6.2% (363,947)
Number of households with income $30k - 40k:
Arlington:
9.0% (5,308)
Texas:
6.8% (399,275)
Number of households with income $40k - 50k:
Arlington:
6.1% (3,572)
State:
6.5% (383,417)
Number of households with income $50k - 60k:
Arlington:
6.2% (3,658)
State:
6.6% (388,535)
Number of households with income $60k - 75k:
Arlington:
8.7% (5,121)
State:
9.7% (566,295)
Number of households with income $75k - 100k:
Arlington:
13.8% (8,109)
Texas:
13.0% (760,276)
Number of households with income $100k - 125k:
Arlington:
14.5% (8,524)
State:
10.2% (597,596)
Number of households with income $125k - 150k:
Arlington:
9.1% (5,318)
State:
7.4% (436,830)
Number of households with income $150k - 200k:
Arlington:
8.9% (5,214)
Texas:
9.9% (583,067)
Number of households with income > $200k:
Arlington:
9.0% (5,304)
State:
13.5% (792,647)
Aggregate household income in Arlington in 2022: $6,031,239,700
Median family income in Arlington in 2022:
Arlington:
$108,210
State:
$101,788
Number of families with income < $10k:
Arlington:
2.1% (766)
Texas:
2.8% (108,142)
Number of families with income $10k - 20k:
Arlington:
2.3% (828)
Texas:
2.9% (113,421)
Number of families with income $20k - 30k:
Arlington:
2.0% (735)
State:
4.1% (157,688)
Number of families with income $30k - 40k:
Arlington:
5.9% (2,166)
State:
5.2% (198,847)
Number of families with income $40k - 50k:
Arlington:
4.7% (1,712)
State:
5.6% (216,490)
Number of families with income $50k - 60k:
Arlington:
5.3% (1,925)
State:
5.7% (220,689)
Number of families with income $60k - 75k:
Arlington:
8.5% (3,090)
State:
9.0% (346,106)
Number of families with income $75k - 100k:
Arlington:
13.8% (5,037)
Texas:
13.7% (527,363)
Number of families with income $100k - 125k:
Arlington:
17.5% (6,382)
State:
11.6% (448,411)
Number of families with income $125k - 150k:
Arlington:
11.9% (4,351)
State:
9.2% (355,798)
Number of families with income $150k - 200k:
Arlington:
12.6% (4,601)
State:
12.5% (480,185)
Number of families with income > $200k:
Arlington:
13.4% (4,884)
State:
17.6% (677,490)
Median non-family income in Arlington in 2022:
Arlington:
$44,707
Texas:
$50,587
Change in median non-family income between 2000 and 2022:
Arlington, Texas:
+37.7%
State:
+87.7%
Median per capita income in Arlington in 2022:
Arlington:
$42,090
Texas:
$47,740
Change in median per capita income between 2000 and 2022:
Arlington, Texas:
+63.9%
State:
+114.3%
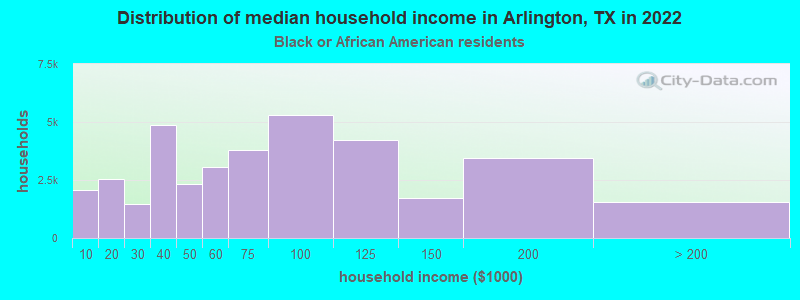
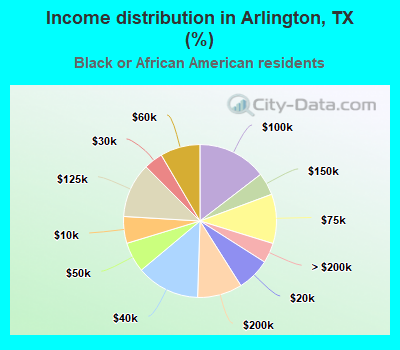
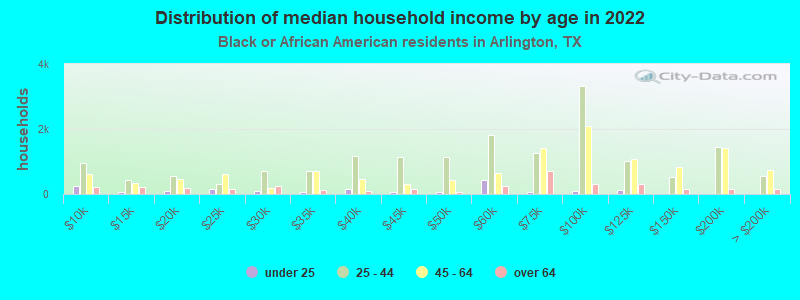
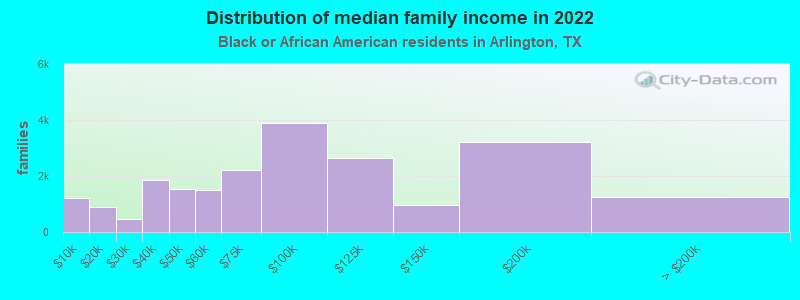
Income statistics for Black or African American residents
Median household income in Arlington, TX in 2022:
Arlington:
$64,116
Texas:
$55,759
Change in median household income between 2000 and 2022:
Arlington, Texas:
+64.8%
State:
+90.3%
Number of households with income < $10k:
Arlington:
5.7% (2,061)
State:
8.9% (126,378)
Number of households with income $10k - 20k:
Arlington:
7.0% (2,554)
State:
9.9% (140,369)
Number of households with income $20k - 30k:
Arlington:
4.0% (1,464)
Texas:
8.5% (120,639)
Number of households with income $30k - 40k:
Arlington:
13.4% (4,878)
State:
9.7% (137,517)
Number of households with income $40k - 50k:
Arlington:
6.4% (2,324)
State:
8.0% (112,973)
Number of households with income $50k - 60k:
Arlington:
8.4% (3,071)
Texas:
8.3% (117,156)
Number of households with income $60k - 75k:
Arlington:
10.5% (3,804)
State:
10.4% (147,462)
Number of households with income $75k - 100k:
Arlington:
14.6% (5,302)
Texas:
11.5% (162,718)
Number of households with income $100k - 125k:
Arlington:
11.6% (4,213)
State:
8.2% (115,829)
Number of households with income $125k - 150k:
Arlington:
4.8% (1,732)
State:
4.9% (69,556)
Number of households with income $150k - 200k:
Arlington:
9.5% (3,449)
State:
6.4% (90,701)
Number of households with income > $200k:
Arlington:
4.2% (1,542)
State:
5.5% (77,988)
Aggregate household income in Arlington in 2022: $3,070,097,500
Median family income in Arlington in 2022:
Arlington:
$82,301
State:
$69,134
Number of families with income < $10k:
Arlington:
5.7% (1,226)
State:
6.8% (55,625)
Number of families with income $10k - 20k:
Arlington:
4.2% (906)
Texas:
6.8% (55,300)
Number of families with income $20k - 30k:
Arlington:
2.2% (476)
Texas:
7.1% (57,877)
Number of families with income $30k - 40k:
Arlington:
8.6% (1,859)
Texas:
8.5% (68,776)
Number of families with income $40k - 50k:
Arlington:
7.0% (1,520)
Texas:
7.1% (57,907)
Number of families with income $50k - 60k:
Arlington:
6.9% (1,495)
Texas:
7.3% (59,511)
Number of families with income $60k - 75k:
Arlington:
10.2% (2,211)
State:
10.1% (81,994)
Number of families with income $75k - 100k:
Arlington:
17.9% (3,883)
State:
12.7% (103,723)
Number of families with income $100k - 125k:
Arlington:
12.3% (2,660)
Texas:
9.4% (76,609)
Number of families with income $125k - 150k:
Arlington:
4.5% (974)
State:
6.8% (55,615)
Number of families with income $150k - 200k:
Arlington:
14.8% (3,213)
State:
9.4% (76,146)
Number of families with income > $200k:
Arlington:
5.8% (1,256)
Texas:
7.9% (64,439)
Median non-family income in Arlington in 2022:
Arlington:
$47,024
State:
$40,133
Change in median non-family income between 2000 and 2022:
Arlington, Texas:
+65.0%
Texas:
+102.2%
Median per capita income in Arlington in 2022:
Arlington:
$33,052
State:
$30,490
Change in median per capita income between 2000 and 2022:
Arlington, Texas:
+82.2%
State:
+113.9%
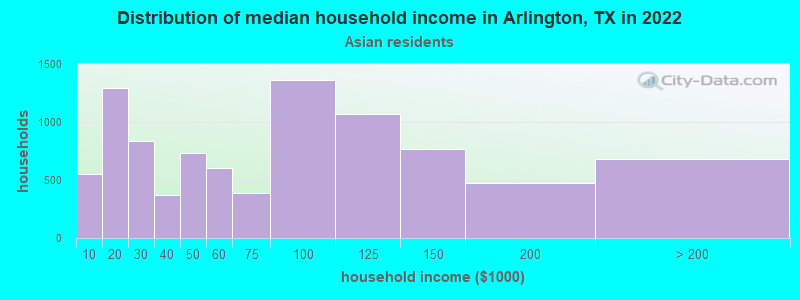
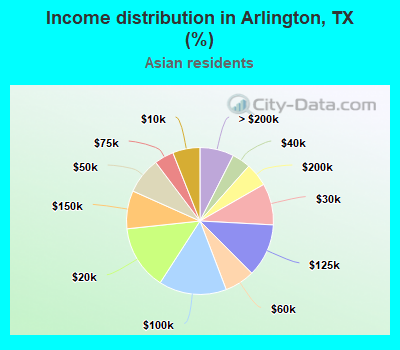
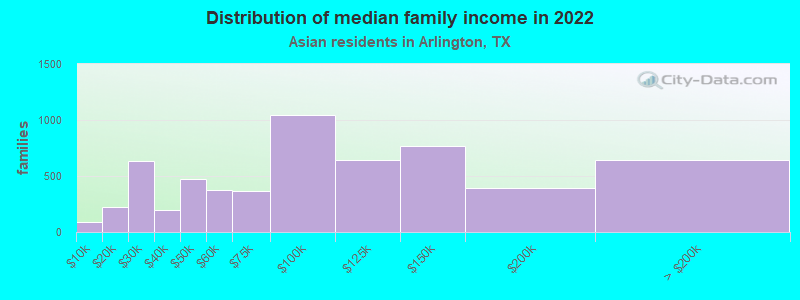
Income statistics for Asian residents
Median household income in Arlington, TX in 2022:
Arlington:
$66,075
State:
$107,673
Change in median household income between 2000 and 2022:
Arlington, Texas:
+50.1%
State:
+115.1%
Number of households with income < $10k:
Arlington:
6.0% (548)
State:
5.2% (29,885)
Number of households with income $10k - 20k:
Arlington:
14.2% (1,293)
Texas:
4.7% (27,044)
Number of households with income $20k - 30k:
Arlington:
9.1% (833)
State:
4.1% (23,363)
Number of households with income $30k - 40k:
Arlington:
4.1% (371)
State:
4.1% (23,309)
Number of households with income $40k - 50k:
Arlington:
8.0% (733)
Texas:
5.2% (29,826)
Number of households with income $50k - 60k:
Arlington:
6.6% (604)
Texas:
4.7% (26,512)
Number of households with income $60k - 75k:
Arlington:
4.3% (390)
State:
6.5% (36,905)
Number of households with income $75k - 100k:
Arlington:
14.9% (1,363)
State:
11.3% (64,350)
Number of households with income $100k - 125k:
Arlington:
11.7% (1,069)
State:
11.4% (64,714)
Number of households with income $125k - 150k:
Arlington:
8.4% (765)
State:
9.3% (52,719)
Number of households with income $150k - 200k:
Arlington:
5.2% (471)
State:
12.5% (70,953)
Number of households with income > $200k:
Arlington:
7.5% (684)
State:
21.1% (120,260)
Aggregate household income in Arlington in 2022: $750,024,500
Median family income in Arlington in 2022:
Arlington:
$85,091
Texas:
$123,328
Number of families with income < $10k:
Arlington:
1.6% (91)
State:
3.1% (13,567)
Number of families with income $10k - 20k:
Arlington:
3.8% (222)
State:
3.0% (13,043)
Number of families with income $20k - 30k:
Arlington:
10.9% (633)
State:
3.4% (14,738)
Number of families with income $30k - 40k:
Arlington:
3.3% (193)
State:
3.4% (15,033)
Number of families with income $40k - 50k:
Arlington:
8.1% (471)
State:
4.9% (21,622)
Number of families with income $50k - 60k:
Arlington:
6.4% (372)
Texas:
4.7% (20,568)
Number of families with income $60k - 75k:
Arlington:
6.3% (370)
State:
6.1% (26,637)
Number of families with income $75k - 100k:
Arlington:
17.9% (1,041)
State:
10.7% (46,626)
Number of families with income $100k - 125k:
Arlington:
11.0% (643)
Texas:
11.3% (49,585)
Number of families with income $125k - 150k:
Arlington:
13.1% (765)
State:
9.8% (43,043)
Number of families with income $150k - 200k:
Arlington:
6.7% (390)
State:
14.7% (64,203)
Number of families with income > $200k:
Arlington:
11.0% (639)
State:
24.8% (108,511)
Median non-family income in Arlington in 2022:
Arlington:
$22,500
Texas:
$64,320
Change in median non-family income between 2000 and 2022:
Arlington, Texas:
+12.8%
State:
+131.1%
Median per capita income in Arlington in 2022:
Arlington:
$28,358
Texas:
$48,626
Change in median per capita income between 2000 and 2022:
Arlington, Texas:
+76.0%
Texas:
+132.0%
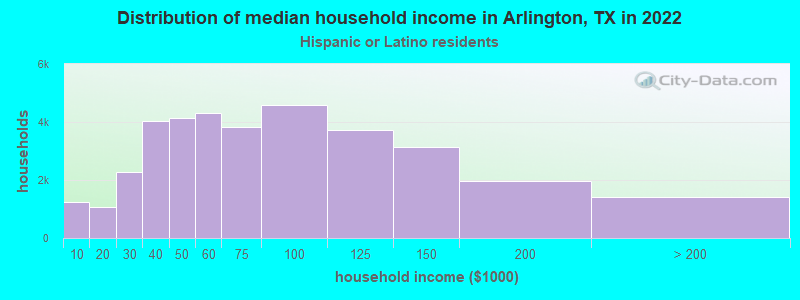
Income statistics for Hispanic or Latino residents
Median household income in Arlington, TX in 2022:
Arlington:
$61,591
State:
$60,504
Change in median household income between 2000 and 2022:
Arlington, Texas:
+67.3%
Texas:
+102.5%
Number of households with income < $10k:
Arlington:
3.4% (1,229)
State:
5.8% (213,953)
Number of households with income $10k - 20k:
Arlington:
3.0% (1,069)
State:
8.0% (297,456)
Number of households with income $20k - 30k:
Arlington:
6.4% (2,273)
State:
9.2% (340,166)
Number of households with income $30k - 40k:
Arlington:
11.3% (4,037)
Texas:
9.5% (354,336)
Number of households with income $40k - 50k:
Arlington:
11.6% (4,140)
Texas:
8.8% (327,013)
Number of households with income $50k - 60k:
Arlington:
12.1% (4,309)
Texas:
8.3% (308,818)
Number of households with income $60k - 75k:
Arlington:
10.7% (3,836)
Texas:
10.9% (405,109)
Number of households with income $75k - 100k:
Arlington:
12.9% (4,603)
State:
13.8% (511,639)
Number of households with income $100k - 125k:
Arlington:
10.4% (3,730)
State:
8.6% (319,728)
Number of households with income $125k - 150k:
Arlington:
8.8% (3,136)
State:
5.7% (210,932)
Number of households with income $150k - 200k:
Arlington:
5.5% (1,951)
State:
6.4% (236,055)
Number of households with income > $200k:
Arlington:
4.0% (1,431)
State:
5.1% (189,259)
Aggregate household income in Arlington in 2022: $2,840,478,200
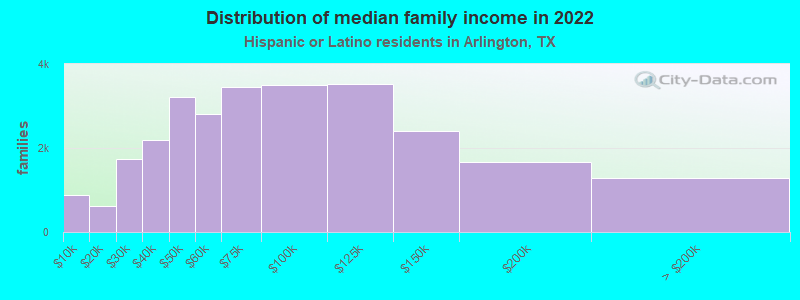
Median family income in Arlington in 2022:
Arlington:
$65,588
State:
$65,080
Number of families with income < $10k:
Arlington:
3.2% (883)
State:
5.3% (147,493)
Number of families with income $10k - 20k:
Arlington:
2.3% (623)
Texas:
6.3% (174,531)
Number of families with income $20k - 30k:
Arlington:
6.4% (1,732)
Texas:
8.6% (238,528)
Number of families with income $30k - 40k:
Arlington:
8.0% (2,185)
State:
9.1% (251,999)
Number of families with income $40k - 50k:
Arlington:
11.8% (3,225)
State:
8.6% (240,188)
Number of families with income $50k - 60k:
Arlington:
10.3% (2,819)
State:
8.0% (223,566)
Number of families with income $60k - 75k:
Arlington:
12.6% (3,441)
State:
10.9% (302,688)
Number of families with income $75k - 100k:
Arlington:
12.9% (3,506)
State:
14.3% (398,554)
Number of families with income $100k - 125k:
Arlington:
12.9% (3,522)
State:
9.5% (264,007)
Number of families with income $125k - 150k:
Arlington:
8.8% (2,401)
State:
6.2% (171,274)
Number of families with income $150k - 200k:
Arlington:
6.1% (1,658)
State:
7.3% (202,259)
Number of families with income > $200k:
Arlington:
4.7% (1,280)
Texas:
5.9% (165,129)
Median non-family income in Arlington in 2022:
Arlington:
$38,637
State:
$39,934
Change in median non-family income between 2000 and 2022:
Arlington, Texas:
+28.9%
State:
+109.1%
Median per capita income in Arlington in 2022:
Arlington:
$22,774
Texas:
$24,862
Change in median per capita income between 2000 and 2022:
Arlington, Texas:
+82.4%
State:
+130.8%
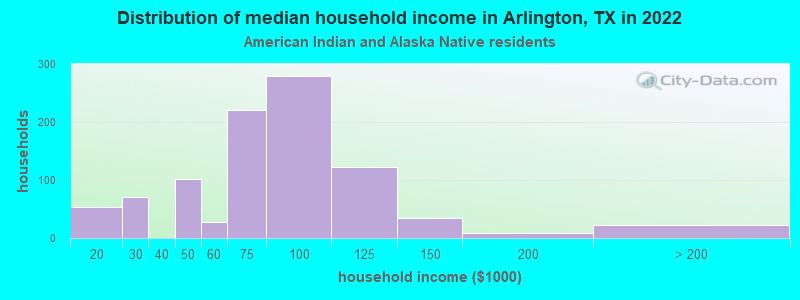
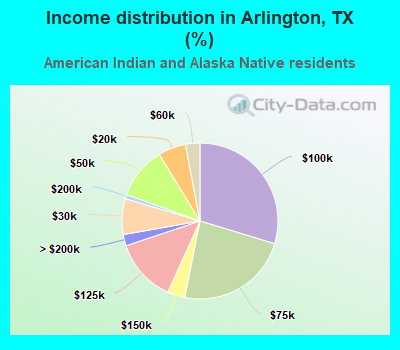
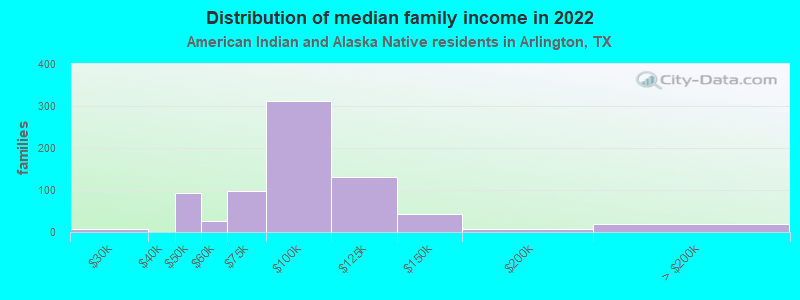
Income statistics for American Indian and Alaska Native residents
Median household income in Arlington, TX in 2022:
Arlington:
$76,192
Texas:
$65,765
Change in median household income between 2000 and 2022:
Arlington, Texas:
+69.5%
State:
+88.3%
Number of households with income < $10k:
Arlington:
0.0% (0)
Texas:
4.1% (3,398)
Number of households with income $10k - 20k:
Arlington:
5.8% (54)
Texas:
8.3% (6,949)
Number of households with income $20k - 30k:
Arlington:
7.5% (70)
State:
9.3% (7,742)
Number of households with income $30k - 40k:
Arlington:
0.0% (0)
State:
9.1% (7,627)
Number of households with income $40k - 50k:
Arlington:
10.8% (101)
State:
7.1% (5,922)
Number of households with income $50k - 60k:
Arlington:
3.0% (28)
State:
8.1% (6,761)
Number of households with income $60k - 75k:
Arlington:
23.4% (220)
State:
12.7% (10,588)
Number of households with income $75k - 100k:
Arlington:
29.7% (279)
State:
13.0% (10,903)
Number of households with income $100k - 125k:
Arlington:
13.1% (123)
Texas:
9.9% (8,256)
Number of households with income $125k - 150k:
Arlington:
3.6% (34)
Texas:
5.2% (4,355)
Number of households with income $150k - 200k:
Arlington:
0.9% (8)
Texas:
6.7% (5,623)
Number of households with income > $200k:
Arlington:
2.3% (22)
State:
6.6% (5,522)
Aggregate household income in Arlington in 2022: $105,695,100
Median family income in Arlington in 2022:
Arlington:
$76,366
Texas:
$72,369
Number of families with income $20k - 30k:
Arlington:
0.9% (6)
State:
7.3% (4,502)
Number of families with income $40k - 50k:
Arlington:
12.5% (92)
Texas:
7.9% (4,855)
Number of families with income $50k - 60k:
Arlington:
3.6% (26)
State:
7.1% (4,347)
Number of families with income $60k - 75k:
Arlington:
13.2% (97)
State:
12.1% (7,429)
Number of families with income $75k - 100k:
Arlington:
42.6% (313)
State:
14.4% (8,852)
Number of families with income $100k - 125k:
Arlington:
17.9% (132)
Texas:
11.4% (6,997)
Number of families with income $125k - 150k:
Arlington:
5.7% (42)
State:
7.5% (4,609)
Number of families with income $150k - 200k:
Arlington:
0.9% (7)
State:
6.9% (4,246)
Number of families with income > $200k:
Arlington:
2.7% (20)
State:
7.0% (4,287)
Median per capita income in Arlington in 2022:
Arlington:
$19,655
State:
$28,166
Change in median per capita income between 2000 and 2022:
Arlington, Texas:
+0.2%
State:
+77.2%
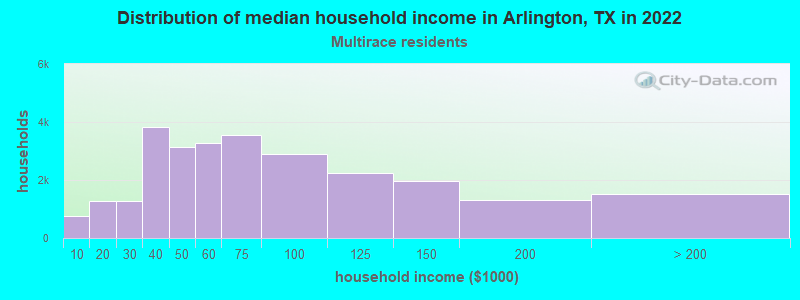
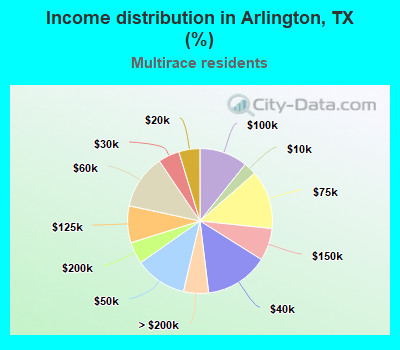
Income statistics for Multirace residents
Median household income in Arlington, TX in 2022:
Arlington:
$59,685
State:
$62,748
Change in median household income between 2000 and 2022:
Arlington, Texas:
+66.3%
Texas:
+92.3%
Number of households with income < $10k:
Arlington:
2.8% (763)
State:
5.5% (122,324)
Number of households with income $10k - 20k:
Arlington:
4.7% (1,276)
State:
8.2% (182,232)
Number of households with income $20k - 30k:
Arlington:
4.8% (1,287)
Texas:
8.5% (189,456)
Number of households with income $30k - 40k:
Arlington:
14.2% (3,833)
Texas:
8.9% (197,499)
Number of households with income $40k - 50k:
Arlington:
11.6% (3,130)
Texas:
8.7% (191,735)
Number of households with income $50k - 60k:
Arlington:
12.1% (3,287)
Texas:
8.0% (177,535)
Number of households with income $60k - 75k:
Arlington:
13.1% (3,550)
State:
10.5% (232,479)
Number of households with income $75k - 100k:
Arlington:
10.7% (2,908)
State:
13.1% (290,448)
Number of households with income $100k - 125k:
Arlington:
8.2% (2,227)
State:
8.6% (191,595)
Number of households with income $125k - 150k:
Arlington:
7.2% (1,960)
State:
6.0% (133,361)
Number of households with income $150k - 200k:
Arlington:
4.9% (1,322)
State:
7.2% (159,195)
Number of households with income > $200k:
Arlington:
5.6% (1,517)
State:
6.7% (148,064)
Aggregate household income in Arlington in 2022: $2,134,779,600
Median family income in Arlington in 2022:
Arlington:
$62,727
State:
$69,780
Number of families with income < $10k:
Arlington:
3.6% (692)
Texas:
4.4% (70,825)
Number of families with income $10k - 20k:
Arlington:
2.8% (536)
Texas:
5.9% (95,279)
Number of families with income $20k - 30k:
Arlington:
5.0% (952)
State:
7.8% (126,627)
Number of families with income $30k - 40k:
Arlington:
9.1% (1,740)
State:
8.5% (137,626)
Number of families with income $40k - 50k:
Arlington:
14.1% (2,702)
State:
8.4% (135,809)
Number of families with income $50k - 60k:
Arlington:
11.2% (2,137)
Texas:
7.9% (127,739)
Number of families with income $60k - 75k:
Arlington:
12.7% (2,435)
State:
10.5% (169,549)
Number of families with income $75k - 100k:
Arlington:
11.4% (2,175)
State:
14.0% (226,284)
Number of families with income $100k - 125k:
Arlington:
10.5% (2,006)
State:
9.5% (153,597)
Number of families with income $125k - 150k:
Arlington:
7.5% (1,440)
Texas:
6.7% (107,900)
Number of families with income $150k - 200k:
Arlington:
5.5% (1,052)
State:
8.5% (137,607)
Number of families with income > $200k:
Arlington:
6.5% (1,239)
Texas:
7.9% (127,299)
Median non-family income in Arlington in 2022:
Arlington:
$39,324
State:
$40,634
Change in median non-family income between 2000 and 2022:
Arlington, Texas:
+55.5%
State:
+77.2%
Median per capita income in Arlington in 2022:
Arlington:
$23,760
State:
$26,785
Change in median per capita income between 2000 and 2022:
Arlington, Texas:
+84.0%
State:
+110.9%
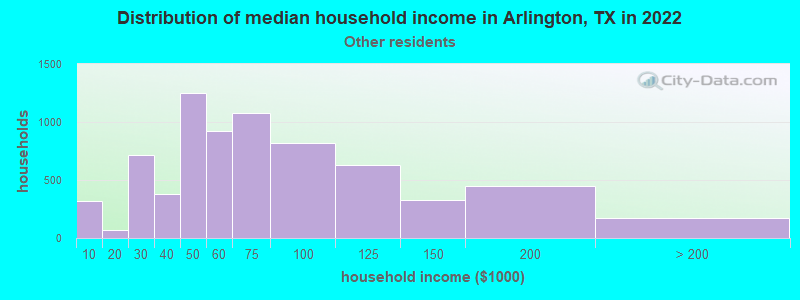
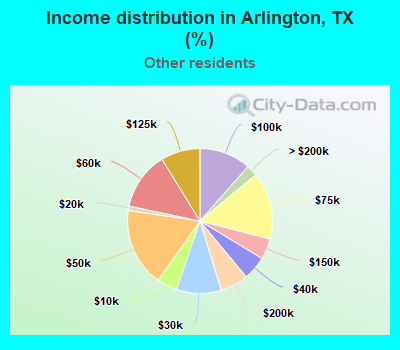
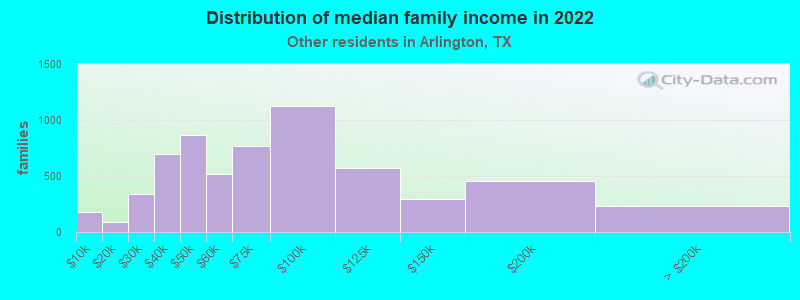
Income statistics for other residents
Median household income in Arlington, TX in 2022:
Arlington:
$58,346
State:
$57,114
Number of households with income < $10k:
Arlington:
4.5% (323)
State:
5.9% (54,162)
Number of households with income $10k - 20k:
Arlington:
1.0% (71)
State:
6.8% (62,891)
Number of households with income $20k - 30k:
Arlington:
10.0% (717)
Texas:
10.6% (97,294)
Number of households with income $30k - 40k:
Arlington:
5.3% (379)
State:
10.8% (99,670)
Number of households with income $40k - 50k:
Arlington:
17.5% (1,250)
Texas:
9.3% (85,548)
Number of households with income $50k - 60k:
Arlington:
12.9% (922)
State:
9.0% (82,757)
Number of households with income $60k - 75k:
Arlington:
15.1% (1,076)
Texas:
10.9% (100,326)
Number of households with income $75k - 100k:
Arlington:
11.5% (823)
State:
14.0% (128,767)
Number of households with income $100k - 125k:
Arlington:
8.8% (627)
State:
8.2% (75,218)
Number of households with income $125k - 150k:
Arlington:
4.6% (331)
State:
4.8% (44,223)
Number of households with income $150k - 200k:
Arlington:
6.3% (449)
State:
5.6% (51,376)
Number of households with income > $200k:
Arlington:
2.5% (176)
State:
4.0% (36,393)
Aggregate household income in Arlington in 2022: $532,177,000
Median family income in Arlington in 2022:
Arlington:
$66,228
State:
$60,064
Number of families with income < $10k:
Arlington:
2.9% (180)
Texas:
6.8% (47,502)
Number of families with income $10k - 20k:
Arlington:
1.4% (88)
State:
6.0% (41,763)
Number of families with income $20k - 30k:
Arlington:
5.5% (340)
State:
9.9% (68,761)
Number of families with income $30k - 40k:
Arlington:
11.4% (698)
State:
9.7% (67,685)
Number of families with income $40k - 50k:
Arlington:
14.1% (868)
Texas:
9.0% (62,441)
Number of families with income $50k - 60k:
Arlington:
8.5% (520)
State:
8.5% (59,321)
Number of families with income $60k - 75k:
Arlington:
12.5% (767)
State:
11.2% (77,588)
Number of families with income $75k - 100k:
Arlington:
18.4% (1,129)
State:
14.5% (101,032)
Number of families with income $100k - 125k:
Arlington:
9.2% (568)
State:
8.8% (61,439)
Number of families with income $125k - 150k:
Arlington:
4.9% (298)
State:
5.1% (35,727)
Number of families with income $150k - 200k:
Arlington:
7.4% (452)
State:
5.9% (41,211)
Number of families with income > $200k:
Arlington:
3.8% (233)
Texas:
4.5% (31,243)
Median non-family income in Arlington in 2022:
Arlington:
$45,617
Texas:
$38,690
Change in median non-family income between 2000 and 2022:
Arlington, Texas:
+50.2%
State:
+90.2%
Median per capita income in Arlington in 2022:
Arlington:
$22,750
State:
$23,899
Change in median per capita income between 2000 and 2022:
Arlington, Texas:
+85.0%
State:
+135.2%
Discuss Arlington, Texas (TX) on our hugely popular Texas forum.