The median household income in Baring, WA in 2022 was $74,831, which was 22.0% less than the median annual income of $91,306 across the entire state of Washington. Compared to the median income of $40,875 in 2000 this represents an increase of 45.4%. The per capita income in 2022 was $50,464, which means an increase of 55.3% compared to 2000 when it was $22,571.
Whole page based on the data from 2000 / 2022 when the population of Baring, Washington was 233 / 207
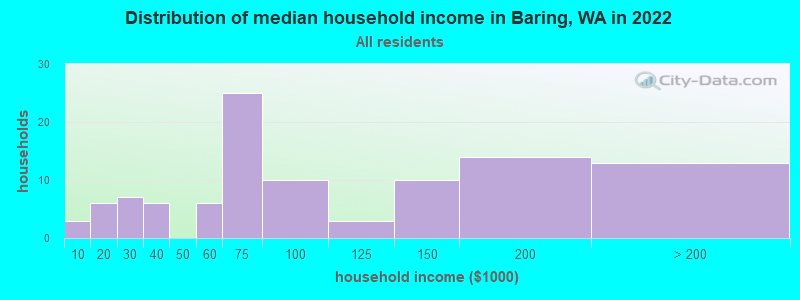
Income statistics for all residents
Median household income in Baring, WA in 2022:
Baring:
$74,831
State:
$91,306
Change in median household income between 2000 and 2022:
Baring, Washington:
+83.1%
State:
+99.5%
Number of households with income < $10k:
Baring:
2.9% (3)
State:
4.5% (139,331)
Number of households with income $10k - 20k:
Baring:
5.8% (6)
Washington:
5.0% (154,508)
Number of households with income $20k - 30k:
Baring:
6.8% (7)
State:
5.4% (166,555)
Number of households with income $30k - 40k:
Baring:
5.8% (6)
Washington:
5.5% (170,324)
Number of households with income $40k - 50k:
Baring:
0.0% (0)
State:
6.0% (183,941)
Number of households with income $50k - 60k:
Baring:
5.8% (6)
State:
6.1% (187,395)
Number of households with income $60k - 75k:
Baring:
24.3% (25)
Washington:
8.7% (266,771)
Number of households with income $75k - 100k:
Baring:
9.7% (10)
Washington:
13.1% (404,672)
Number of households with income $100k - 125k:
Baring:
2.9% (3)
Washington:
11.0% (337,911)
Number of households with income $125k - 150k:
Baring:
9.7% (10)
State:
8.0% (244,934)
Number of households with income $150k - 200k:
Baring:
13.6% (14)
Washington:
10.5% (323,812)
Number of households with income > $200k:
Baring:
12.6% (13)
State:
16.2% (499,799)
Aggregate household income in Baring in 2022: $10,510,010
Median family income in Baring in 2022:
Baring:
$73,913
Washington:
$109,192
Number of families with income $20k - 30k:
Baring:
4.9% (2)
State:
3.2% (61,974)
Number of families with income $30k - 40k:
Baring:
17.0% (7)
Washington:
4.1% (80,240)
Number of families with income $40k - 50k:
Baring:
7.2% (3)
State:
4.9% (94,310)
Number of families with income $50k - 60k:
Baring:
9.0% (4)
State:
5.3% (101,674)
Number of families with income $60k - 75k:
Baring:
39.6% (16)
State:
8.2% (158,348)
Number of families with income $125k - 150k:
Baring:
22.3% (9)
State:
9.3% (180,011)
Median income for 2 person families:
Baring:
$72,039
State:
$96,815
Median per capita income in Baring in 2022:
Baring:
$50,464
State:
$50,764
Change in median per capita income between 2000 and 2022:
Baring, Washington:
+123.6%
State:
+121.0%
Income statistics for White residents
Median household income in Baring, WA in 2022:
Baring:
$74,408
State:
$91,916
Change in median household income between 2000 and 2022:
Baring, Washington:
+83.7%
Washington:
+95.4%
Number of households with income < $10k:
Baring:
3.3% (3)
Washington:
4.3% (95,850)
Number of households with income $10k - 20k:
Baring:
5.5% (5)
State:
4.8% (106,421)
Number of households with income $20k - 30k:
Baring:
7.7% (7)
Washington:
5.5% (122,860)
Number of households with income $30k - 40k:
Baring:
6.6% (6)
State:
5.4% (119,627)
Number of households with income $40k - 50k:
Baring:
0.0% (0)
State:
5.9% (132,276)
Number of households with income $50k - 60k:
Baring:
5.5% (5)
Washington:
6.1% (136,212)
Number of households with income $60k - 75k:
Baring:
24.2% (22)
Washington:
8.8% (196,086)
Number of households with income $75k - 100k:
Baring:
11.0% (10)
Washington:
13.4% (299,192)
Number of households with income $100k - 125k:
Baring:
0.0% (0)
Washington:
11.3% (252,209)
Number of households with income $125k - 150k:
Baring:
9.9% (9)
State:
7.9% (175,962)
Number of households with income $150k - 200k:
Baring:
13.2% (12)
State:
10.7% (239,156)
Number of households with income > $200k:
Baring:
13.2% (12)
Washington:
16.1% (359,917)
Aggregate household income in Baring in 2022: $9,526,834
Median family income in Baring in 2022:
Baring:
$74,639
State:
$112,511
Number of families with income $20k - 30k:
Baring:
5.4% (2)
State:
2.9% (39,288)
Number of families with income $30k - 40k:
Baring:
15.4% (5)
State:
3.6% (50,190)
Number of families with income $50k - 60k:
Baring:
9.4% (3)
State:
5.0% (69,270)
Number of families with income $60k - 75k:
Baring:
44.1% (14)
Washington:
8.2% (112,369)
Number of families with income $125k - 150k:
Baring:
25.7% (8)
Washington:
9.5% (130,928)
Median per capita income in Baring in 2022:
Baring:
$47,579
State:
$55,212
Change in median per capita income between 2000 and 2022:
Baring, Washington:
+117.7%
Washington:
+123.8%
Income statistics for Hispanic or Latino residents
Aggregate household income in Baring in 2022: $531,880
Income statistics for Multirace residents
Aggregate household income in Baring in 2022: $5,689,290
Median per capita income in Baring in 2022:
Baring:
$25,837
Washington:
$32,496
Change in median per capita income between 2000 and 2022:: -46.6%
Baring, Washington:
-46.6%
Washington:
+156.8%
Discuss Baring, Washington (WA) on our hugely popular Washington forum.