Barrington, New York (NY) income map, earnings map, and wages data
The median household income in Barrington, NY in 2022 was $65,872, which was 20.8% less than the median annual income of $79,557 across the entire state of New York. Compared to the median income of $36,184 in 2000 this represents an increase of 45.1%. The per capita income in 2022 was $31,414, which means an increase of 50.9% compared to 2000 when it was $15,416.
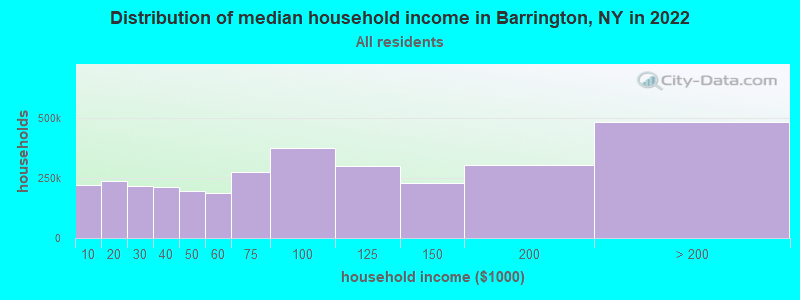
Income statistics for all residents
Median household income in Barrington, NY in 2022:| Barrington: | $65,872 |
| State: | $79,557 |
Change in median household income between 2000 and 2022:| Barrington, New York: | +82.0% |
| State: | +83.3% |
Number of households with income < $10k:| Barrington: | 6.8% (220,084) |
| New York: | 6.8% (527,598) |
Number of households with income $10k - 20k:| Barrington: | 7.4% (239,791) |
| State: | 7.4% (574,940) |
Number of households with income $20k - 30k:| Barrington: | 6.7% (215,908) |
| New York: | 6.7% (517,718) |
Number of households with income $30k - 40k:| Barrington: | 6.5% (211,287) |
| State: | 6.5% (506,674) |
Number of households with income $40k - 50k:| Barrington: | 6.1% (196,162) |
| State: | 6.1% (470,439) |
Number of households with income $50k - 60k:| Barrington: | 5.8% (189,323) |
| State: | 5.8% (454,042) |
Number of households with income $60k - 75k:| Barrington: | 8.5% (274,157) |
| State: | 8.5% (657,508) |
Number of households with income $75k - 100k:| Barrington: | 11.6% (375,191) |
| State: | 11.6% (899,824) |
Number of households with income $100k - 125k:| Barrington: | 9.3% (301,812) |
| State: | 9.3% (723,825) |
Number of households with income $125k - 150k:| Barrington: | 7.1% (230,353) |
| New York: | 7.1% (552,420) |
Number of households with income $150k - 200k:| Barrington: | 9.4% (303,207) |
| New York: | 9.4% (727,051) |
Number of households with income > $200k:| Barrington: | 15.0% (484,807) |
| New York: | 15.0% (1,162,269) |
Aggregate household income in Barrington in 2022: $4,607,089,275
Median family income in Barrington in 2022:| Barrington: | $74,192 |
| New York: | $99,066 |
Median non-family income in Barrington in 2022:| Barrington: | $47,594 |
| New York: | $50,181 |
Change in median non-family income between 2000 and 2022:| Barrington, New York: | +81.3% |
| State: | +85.4% |
Median per capita income in Barrington in 2022:| Barrington: | $31,414 |
| State: | $47,421 |
Change in median per capita income between 2000 and 2022:| Barrington, New York: | +103.8% |
| New York: | +102.7% |
Income statistics for White residents
Median household income in Barrington, NY in 2022:| Barrington: | $67,180 |
| State: | $89,408 |
Change in median household income between 2000 and 2022:| Barrington, New York: | +83.3% |
| State: | +85.5% |
Number of households with income < $10k:| Barrington: | 4.8% (85,369) |
| New York: | 4.8% (225,550) |
Number of households with income $10k - 20k:| Barrington: | 6.1% (109,991) |
| State: | 6.1% (289,425) |
Number of households with income $20k - 30k:| Barrington: | 6.0% (106,688) |
| New York: | 5.9% (280,254) |
Number of households with income $30k - 40k:| Barrington: | 6.1% (109,860) |
| State: | 6.1% (288,263) |
Number of households with income $40k - 50k:| Barrington: | 5.9% (106,086) |
| State: | 5.9% (278,079) |
Number of households with income $50k - 60k:| Barrington: | 5.7% (102,129) |
| State: | 5.7% (267,554) |
Number of households with income $60k - 75k:| Barrington: | 8.5% (152,090) |
| State: | 8.4% (398,344) |
Number of households with income $75k - 100k:| Barrington: | 11.8% (211,800) |
| State: | 11.8% (554,841) |
Number of households with income $100k - 125k:| Barrington: | 10.0% (178,825) |
| New York: | 10.0% (469,794) |
Number of households with income $125k - 150k:| Barrington: | 7.7% (137,137) |
| State: | 7.6% (360,467) |
Number of households with income $150k - 200k:| Barrington: | 10.1% (180,642) |
| State: | 10.1% (477,078) |
Number of households with income > $200k:| Barrington: | 17.4% (311,596) |
| New York: | 17.6% (829,233) |
Aggregate household income in Barrington in 2022: $3,105,590,424
Median family income in Barrington in 2022:| Barrington: | $76,265 |
| New York: | $115,170 |
Number of families with income < $10k:| Barrington: | 5.6% (13) |
| State: | 2.5% (68,851) |
Number of families with income $10k - 20k:| Barrington: | 8.1% (19) |
| State: | 3.0% (83,127) |
Number of families with income $20k - 30k:| Barrington: | 8.5% (20) |
| State: | 3.5% (97,578) |
Number of families with income $30k - 40k:| Barrington: | 9.0% (21) |
| State: | 4.1% (114,108) |
Number of families with income $40k - 50k:| Barrington: | 8.2% (19) |
| State: | 4.7% (130,902) |
Number of families with income $50k - 60k:| Barrington: | 12.6% (29) |
| State: | 4.9% (135,118) |
Number of families with income $60k - 75k:| Barrington: | 6.9% (16) |
| New York: | 7.8% (216,254) |
Number of families with income $75k - 100k:| Barrington: | 12.9% (30) |
| State: | 12.4% (342,382) |
Number of families with income $100k - 125k:| Barrington: | 6.8% (16) |
| State: | 11.4% (314,917) |
Number of families with income $150k - 200k:| Barrington: | 6.7% (16) |
| State: | 13.2% (365,586) |
Number of families with income > $200k:| Barrington: | 14.9% (35) |
| State: | 23.2% (642,319) |
Median non-family income in Barrington in 2022:| Barrington: | $51,561 |
| State: | $54,783 |
Change in median non-family income between 2000 and 2022:| Barrington, New York: | +83.9% |
| New York: | +87.9% |
Median per capita income in Barrington in 2022:| Barrington: | $32,610 |
| State: | $57,640 |
Change in median per capita income between 2000 and 2022:| Barrington, New York: | +111.0% |
| State: | +111.6% |
Income statistics for Asian residents
Median household income in Barrington, NY in 2022:| Barrington: | $27,332 |
| New York: | $89,947 |
Change in median household income between 2000 and 2022:| Barrington, New York: | +77.3% |
| State: | +98.1% |
Number of households with income < $10k:| Barrington: | 6.9% (7,221) |
| State: | 6.9% (42,537) |
Number of households with income $10k - 20k:| Barrington: | 7.3% (7,598) |
| State: | 7.3% (44,745) |
Number of households with income $20k - 30k:| Barrington: | 6.2% (6,505) |
| New York: | 6.2% (38,249) |
Number of households with income $30k - 40k:| Barrington: | 5.5% (5,772) |
| State: | 5.5% (33,993) |
Number of households with income $40k - 50k:| Barrington: | 4.9% (5,066) |
| New York: | 4.8% (29,795) |
Number of households with income $50k - 60k:| Barrington: | 5.2% (5,418) |
| New York: | 5.2% (32,100) |
Number of households with income $60k - 75k:| Barrington: | 7.3% (7,570) |
| State: | 7.3% (44,615) |
Number of households with income $75k - 100k:| Barrington: | 10.9% (11,319) |
| New York: | 10.8% (66,687) |
Number of households with income $100k - 125k:| Barrington: | 8.2% (8,504) |
| State: | 8.2% (50,233) |
Number of households with income $125k - 150k:| Barrington: | 7.2% (7,515) |
| State: | 7.2% (44,299) |
Number of households with income $150k - 200k:| Barrington: | 10.4% (10,811) |
| State: | 10.4% (63,837) |
Number of households with income > $200k:| Barrington: | 20.1% (20,981) |
| New York: | 20.1% (123,891) |
Aggregate household income in Barrington in 2022: $793,264
Median non-family income in Barrington in 2022:| Barrington: | $31,496 |
| New York: | $63,573 |
Change in median non-family income between 2000 and 2022:| Barrington, New York: | +104.3% |
| New York: | +101.1% |
Median per capita income in Barrington in 2022:| Barrington: | $16,628 |
| New York: | $46,726 |
Change in median per capita income between 2000 and 2022:| Barrington, New York: | +126.5% |
| State: | +126.6% |
Income statistics for Multirace residents
Median household income in Barrington, NY in 2022:| Barrington: | $51,430 |
| State: | $73,557 |
Change in median household income between 2000 and 2022:| Barrington, New York: | +116.5% |
| State: | +123.9% |
Number of households with income < $10k:| Barrington: | 8.9% (20,964) |
| State: | 8.9% (57,924) |
Number of households with income $10k - 20k:| Barrington: | 8.7% (20,445) |
| State: | 8.7% (56,590) |
Number of households with income $20k - 30k:| Barrington: | 7.1% (16,712) |
| State: | 7.1% (46,287) |
Number of households with income $30k - 40k:| Barrington: | 6.9% (16,278) |
| State: | 6.9% (45,132) |
Number of households with income $40k - 50k:| Barrington: | 5.8% (13,660) |
| New York: | 5.8% (37,946) |
Number of households with income $50k - 60k:| Barrington: | 5.6% (13,124) |
| New York: | 5.6% (36,410) |
Number of households with income $60k - 75k:| Barrington: | 7.8% (18,307) |
| State: | 7.8% (50,819) |
Number of households with income $75k - 100k:| Barrington: | 11.7% (27,433) |
| State: | 11.7% (76,024) |
Number of households with income $100k - 125k:| Barrington: | 9.3% (21,830) |
| State: | 9.3% (60,635) |
Number of households with income $125k - 150k:| Barrington: | 6.2% (14,627) |
| State: | 6.2% (40,533) |
Number of households with income $150k - 200k:| Barrington: | 8.6% (20,347) |
| State: | 8.6% (56,409) |
Number of households with income > $200k:| Barrington: | 13.4% (31,589) |
| State: | 13.4% (87,442) |
Aggregate household income in Barrington in 2022: $1,080,656
Median family income in Barrington in 2022:| Barrington: | $55,475 |
| State: | $85,788 |
Median per capita income in Barrington in 2022:| Barrington: | $31,254 |
| State: | $36,931 |