The median household income in Bartonville, TX in 2022 was $140,922, which was 48.7% greater than the median annual income of $72,284 across the entire state of Texas. Compared to the median income of $95,259 in 2000 this represents an increase of 32.4%. The per capita income in 2022 was $79,047, which means an increase of 44.7% compared to 2000 when it was $43,706.
Whole page based on the data from 2000 / 2022 when the population of Bartonville, Texas was 1,093 / 2,091
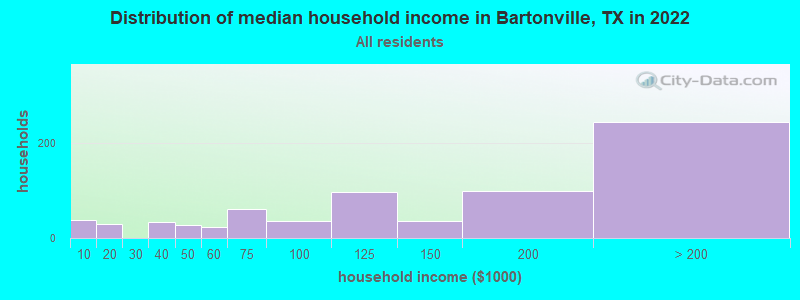
Income statistics for all residents
Median household income in Bartonville, TX in 2022:
Bartonville:
$140,923
State:
$72,284
Change in median household income between 2000 and 2022:
Bartonville, Texas:
+47.9%
State:
+81.0%
Number of households with income < $10k:
Bartonville:
5.1% (37)
State:
5.5% (611,011)
Number of households with income $10k - 20k:
Bartonville:
4.2% (30)
Texas:
6.7% (743,157)
Number of households with income $20k - 30k:
Bartonville:
0.0% (0)
State:
7.2% (803,381)
Number of households with income $30k - 40k:
Bartonville:
4.7% (34)
State:
7.8% (866,080)
Number of households with income $40k - 50k:
Bartonville:
3.7% (27)
State:
7.3% (810,440)
Number of households with income $50k - 60k:
Bartonville:
3.3% (24)
Texas:
7.2% (799,783)
Number of households with income $60k - 75k:
Bartonville:
8.3% (60)
State:
9.9% (1,095,384)
Number of households with income $75k - 100k:
Bartonville:
5.0% (36)
State:
12.8% (1,419,057)
Number of households with income $100k - 125k:
Bartonville:
13.3% (96)
State:
9.5% (1,054,577)
Number of households with income $125k - 150k:
Bartonville:
4.9% (35)
State:
6.7% (741,518)
Number of households with income $150k - 200k:
Bartonville:
13.6% (98)
State:
8.7% (961,776)
Number of households with income > $200k:
Bartonville:
33.8% (244)
Texas:
10.7% (1,181,544)
Aggregate household income in Bartonville in 2022: $157,640,373
Median family income in Bartonville in 2022:
Bartonville:
$168,870
Texas:
$86,267
Number of families with income < $10k:
Bartonville:
5.8% (33)
Texas:
4.0% (297,884)
Number of families with income $10k - 20k:
Bartonville:
3.3% (19)
State:
4.3% (324,514)
Number of families with income $30k - 40k:
Bartonville:
1.1% (6)
Texas:
6.6% (493,535)
Number of families with income $40k - 50k:
Bartonville:
2.5% (14)
State:
6.7% (499,663)
Number of families with income $50k - 60k:
Bartonville:
1.3% (7)
State:
6.6% (492,203)
Number of families with income $60k - 75k:
Bartonville:
11.2% (65)
Texas:
9.5% (710,229)
Number of families with income $75k - 100k:
Bartonville:
7.3% (42)
State:
13.6% (1,015,480)
Number of families with income $100k - 125k:
Bartonville:
10.4% (60)
Texas:
10.7% (797,961)
Number of families with income $125k - 150k:
Bartonville:
4.6% (27)
State:
8.1% (602,985)
Number of families with income $150k - 200k:
Bartonville:
13.7% (79)
State:
10.7% (804,459)
Number of families with income > $200k:
Bartonville:
38.9% (225)
State:
13.5% (1,013,514)
Median per capita income in Bartonville in 2022:
Bartonville:
$79,048
State:
$38,123
Change in median per capita income between 2000 and 2022:
Bartonville, Texas:
+80.9%
State:
+94.3%
Income statistics for White residents
Median household income in Bartonville, TX in 2022:
Bartonville:
$156,465
Texas:
$82,032
Change in median household income between 2000 and 2022:
Bartonville, Texas:
+65.9%
Texas:
+91.0%
Number of households with income < $10k:
Bartonville:
4.1% (25)
State:
4.7% (273,716)
Number of households with income $10k - 20k:
Bartonville:
5.3% (32)
Texas:
5.5% (322,702)
Number of households with income $20k - 30k:
Bartonville:
0.0% (0)
State:
6.2% (363,947)
Number of households with income $30k - 40k:
Bartonville:
5.3% (32)
State:
6.8% (399,275)
Number of households with income $40k - 50k:
Bartonville:
3.6% (22)
State:
6.5% (383,417)
Number of households with income $50k - 60k:
Bartonville:
3.1% (19)
State:
6.6% (388,535)
Number of households with income $60k - 75k:
Bartonville:
6.2% (38)
State:
9.7% (566,295)
Number of households with income $75k - 100k:
Bartonville:
5.1% (31)
Texas:
13.0% (760,276)
Number of households with income $100k - 125k:
Bartonville:
11.7% (71)
State:
10.2% (597,596)
Number of households with income $125k - 150k:
Bartonville:
3.3% (20)
State:
7.4% (436,830)
Number of households with income $150k - 200k:
Bartonville:
14.0% (85)
State:
9.9% (583,067)
Number of households with income > $200k:
Bartonville:
38.3% (233)
State:
13.5% (792,647)
Aggregate household income in Bartonville in 2022: $140,614,387
Median family income in Bartonville in 2022:
Bartonville:
$180,958
State:
$101,788
Number of families with income < $10k:
Bartonville:
5.5% (27)
State:
2.8% (108,142)
Number of families with income $10k - 20k:
Bartonville:
4.2% (21)
State:
2.9% (113,421)
Number of families with income $30k - 40k:
Bartonville:
1.1% (5)
Texas:
5.2% (198,847)
Number of families with income $40k - 50k:
Bartonville:
2.2% (11)
State:
5.6% (216,490)
Number of families with income $50k - 60k:
Bartonville:
1.1% (5)
State:
5.7% (220,689)
Number of families with income $60k - 75k:
Bartonville:
8.5% (42)
State:
9.0% (346,106)
Number of families with income $75k - 100k:
Bartonville:
6.2% (31)
State:
13.7% (527,363)
Number of families with income $100k - 125k:
Bartonville:
8.1% (40)
State:
11.6% (448,411)
Number of families with income $125k - 150k:
Bartonville:
4.5% (22)
State:
9.2% (355,798)
Number of families with income $150k - 200k:
Bartonville:
14.6% (72)
Texas:
12.5% (480,185)
Number of families with income > $200k:
Bartonville:
44.0% (217)
State:
17.6% (677,490)
Median per capita income in Bartonville in 2022:
Bartonville:
$94,510
State:
$47,740
Change in median per capita income between 2000 and 2022:
Bartonville, Texas:
+123.0%
State:
+114.3%
Income statistics for Black or African American residents
Median per capita income in Bartonville in 2022:
Bartonville:
$81,482
State:
$30,490
Income statistics for Asian residents
Aggregate household income in Bartonville in 2022: $4,193,855
Median per capita income in Bartonville in 2022:
Bartonville:
$45,419
State:
$48,626
Income statistics for Hispanic or Latino residents
Median household income in Bartonville, TX in 2022:
Bartonville:
$105,285
Texas:
$60,504
Change in median household income between 2000 and 2022:
Bartonville, Texas:
+87.2%
State:
+102.5%
Number of households with income < $10k:
Bartonville:
0.0% (0)
Texas:
5.8% (213,953)
Number of households with income $10k - 20k:
Bartonville:
0.0% (0)
Texas:
8.0% (297,456)
Number of households with income $20k - 30k:
Bartonville:
0.0% (0)
State:
9.2% (340,166)
Number of households with income $30k - 40k:
Bartonville:
0.0% (0)
Texas:
9.5% (354,336)
Number of households with income $40k - 50k:
Bartonville:
0.0% (0)
State:
8.8% (327,013)
Number of households with income $50k - 60k:
Bartonville:
0.0% (0)
State:
8.3% (308,818)
Number of households with income $60k - 75k:
Bartonville:
31.7% (13)
State:
10.9% (405,109)
Number of households with income $75k - 100k:
Bartonville:
0.0% (0)
State:
13.8% (511,639)
Number of households with income $100k - 125k:
Bartonville:
36.6% (15)
State:
8.6% (319,728)
Number of households with income $125k - 150k:
Bartonville:
0.0% (0)
State:
5.7% (210,932)
Number of households with income $150k - 200k:
Bartonville:
22.0% (9)
State:
6.4% (236,055)
Number of households with income > $200k:
Bartonville:
9.8% (4)
State:
5.1% (189,259)
Aggregate household income in Bartonville in 2022: $4,913,481
Median family income in Bartonville in 2022:
Bartonville:
$80,493
State:
$65,080
Number of families with income $60k - 75k:
Bartonville:
37.7% (13)
Texas:
10.9% (302,688)
Number of families with income $75k - 100k:
Bartonville:
16.9% (6)
State:
14.3% (398,554)
Number of families with income $100k - 125k:
Bartonville:
38.5% (13)
State:
9.5% (264,007)
Number of families with income $150k - 200k:
Bartonville:
6.9% (2)
State:
7.3% (202,259)
Median per capita income in Bartonville in 2022:
Bartonville:
$18,000
State:
$24,862
Change in median per capita income between 2000 and 2022:: -49.5%
Bartonville, Texas:
-49.5%
State:
+130.8%
Income statistics for American Indian and Alaska Native residents
Median household income in Bartonville, TX in 2022:
Bartonville:
$109,683
State:
$65,765
Number of households with income < $10k:
Bartonville:
0.0% (0)
State:
4.1% (3,398)
Number of households with income $10k - 20k:
Bartonville:
0.0% (0)
State:
8.3% (6,949)
Number of households with income $20k - 30k:
Bartonville:
0.0% (0)
State:
9.3% (7,742)
Number of households with income $30k - 40k:
Bartonville:
0.0% (0)
State:
9.1% (7,627)
Number of households with income $40k - 50k:
Bartonville:
0.0% (0)
State:
7.1% (5,922)
Number of households with income $50k - 60k:
Bartonville:
0.0% (0)
State:
8.1% (6,761)
Number of households with income $60k - 75k:
Bartonville:
36.4% (8)
State:
12.7% (10,588)
Number of households with income $75k - 100k:
Bartonville:
4.5% (1)
State:
13.0% (10,903)
Number of households with income $100k - 125k:
Bartonville:
0.0% (0)
Texas:
9.9% (8,256)
Number of households with income $125k - 150k:
Bartonville:
59.1% (13)
State:
5.2% (4,355)
Number of households with income $150k - 200k:
Bartonville:
0.0% (0)
State:
6.7% (5,623)
Number of households with income > $200k:
Bartonville:
0.0% (0)
State:
6.6% (5,522)
Aggregate household income in Bartonville in 2022: $1,888,485
Median per capita income in Bartonville in 2022:
Bartonville:
$30,208
State:
$28,166
Income statistics for Multirace residents
Median household income in Bartonville, TX in 2022:
Bartonville:
$108,504
State:
$62,748
Change in median household income between 2000 and 2022:: -45.7%
Bartonville, Texas:
-45.7%
State:
+92.3%
Number of households with income < $10k:
Bartonville:
0.0% (0)
State:
5.5% (122,324)
Number of households with income $10k - 20k:
Bartonville:
4.7% (2)
State:
8.2% (182,232)
Number of households with income $20k - 30k:
Bartonville:
0.0% (0)
State:
8.5% (189,456)
Number of households with income $30k - 40k:
Bartonville:
0.0% (0)
Texas:
8.9% (197,499)
Number of households with income $40k - 50k:
Bartonville:
0.0% (0)
State:
8.7% (191,735)
Number of households with income $50k - 60k:
Bartonville:
0.0% (0)
State:
8.0% (177,535)
Number of households with income $60k - 75k:
Bartonville:
30.2% (13)
State:
10.5% (232,479)
Number of households with income $75k - 100k:
Bartonville:
0.0% (0)
Texas:
13.1% (290,448)
Number of households with income $100k - 125k:
Bartonville:
27.9% (12)
State:
8.6% (191,595)
Number of households with income $125k - 150k:
Bartonville:
0.0% (0)
State:
6.0% (133,361)
Number of households with income $150k - 200k:
Bartonville:
23.3% (10)
State:
7.2% (159,195)
Number of households with income > $200k:
Bartonville:
14.0% (6)
Texas:
6.7% (148,064)
Aggregate household income in Bartonville in 2022: $5,700,863
Median family income in Bartonville in 2022:
Bartonville:
$86,313
State:
$69,780
Number of families with income $60k - 75k:
Bartonville:
35.0% (12)
Texas:
10.5% (169,549)
Number of families with income $75k - 100k:
Bartonville:
27.5% (9)
State:
14.0% (226,284)
Number of families with income $100k - 125k:
Bartonville:
37.6% (12)
State:
9.5% (153,597)
Median per capita income in Bartonville in 2022:
Bartonville:
$23,658
State:
$26,785
Change in median per capita income between 2000 and 2022:: -83.9%
Bartonville, Texas:
-83.9%
State:
+110.9%
Discuss Bartonville, Texas (TX) on our hugely popular Texas forum.