The median household income in Belle Haven, VA in 2022 was $53,825, which was 59.5% less than the median annual income of $85,873 across the entire state of Virginia. Compared to the median income of $33,500 in 2000 this represents an increase of 37.8%. The per capita income in 2022 was $25,477, which means an increase of 33.2% compared to 2000 when it was $17,009.
Whole page based on the data from 2000 / 2022 when the population of Belle Haven, Virginia was 480 / 752
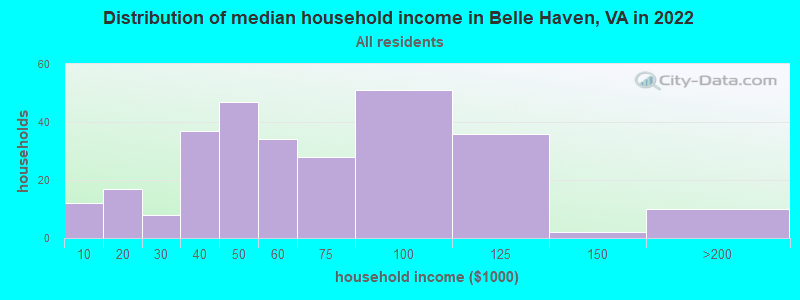
Income statistics for all residents
Median household income in Belle Haven, VA in 2022:
Belle Haven:
$53,826
State:
$85,873
Change in median household income between 2000 and 2022:
Belle Haven, Virginia:
+60.7%
State:
+84.0%
Number of households with income < $10k:
Belle Haven:
4.3% (12)
State:
4.9% (165,315)
Number of households with income $10k - 20k:
Belle Haven:
6.0% (17)
State:
5.9% (199,380)
Number of households with income $20k - 30k:
Belle Haven:
2.8% (8)
State:
6.0% (202,243)
Number of households with income $30k - 40k:
Belle Haven:
13.1% (37)
State:
6.1% (205,967)
Number of households with income $40k - 50k:
Belle Haven:
16.7% (47)
Virginia:
6.4% (215,648)
Number of households with income $50k - 60k:
Belle Haven:
12.1% (34)
Virginia:
6.2% (210,516)
Number of households with income $60k - 75k:
Belle Haven:
9.9% (28)
State:
8.6% (292,112)
Number of households with income $75k - 100k:
Belle Haven:
18.1% (51)
State:
12.2% (412,198)
Number of households with income $100k - 125k:
Belle Haven:
12.8% (36)
State:
10.3% (348,998)
Number of households with income $125k - 150k:
Belle Haven:
0.7% (2)
State:
7.7% (261,236)
Number of households with income $150k - 200k:
Belle Haven:
3.5% (10)
State:
10.3% (347,282)
Number of households with income > $200k:
Belle Haven:
0.0% (0)
Virginia:
15.4% (519,712)
Aggregate household income in Belle Haven in 2022: $17,713,259
Median family income in Belle Haven in 2022:
Belle Haven:
$54,378
State:
$107,101
Number of families with income < $10k:
Belle Haven:
4.0% (7)
State:
2.8% (61,637)
Number of families with income $20k - 30k:
Belle Haven:
11.7% (20)
State:
4.0% (87,860)
Number of families with income $40k - 50k:
Belle Haven:
23.0% (39)
State:
5.4% (118,579)
Number of families with income $50k - 60k:
Belle Haven:
19.7% (34)
Virginia:
5.5% (120,924)
Number of families with income $75k - 100k:
Belle Haven:
13.6% (23)
Virginia:
12.6% (277,221)
Number of families with income $100k - 125k:
Belle Haven:
20.9% (36)
Virginia:
11.3% (248,485)
Number of families with income $125k - 150k:
Belle Haven:
1.2% (2)
Virginia:
9.0% (197,999)
Number of families with income $150k - 200k:
Belle Haven:
5.9% (10)
State:
12.7% (278,323)
Median non-family income in Belle Haven in 2022:
Belle Haven:
$33,756
State:
$51,436
Change in median non-family income between 2000 and 2022:
Belle Haven, Virginia:
+58.9%
State:
+73.5%
Median per capita income in Belle Haven in 2022:
Belle Haven:
$25,477
Virginia:
$47,199
Change in median per capita income between 2000 and 2022:
Belle Haven, Virginia:
+49.8%
State:
+96.9%
Income statistics for White residents
Median household income in Belle Haven, VA in 2022:
Belle Haven:
$56,906
Virginia:
$91,924
Change in median household income between 2000 and 2022:
Belle Haven, Virginia:
+55.9%
Virginia:
+81.9%
Number of households with income < $10k:
Belle Haven:
4.2% (8)
State:
4.1% (90,549)
Number of households with income $10k - 20k:
Belle Haven:
7.8% (15)
State:
5.2% (114,324)
Number of households with income $20k - 30k:
Belle Haven:
0.0% (0)
State:
5.7% (125,676)
Number of households with income $30k - 40k:
Belle Haven:
17.2% (33)
State:
5.5% (121,220)
Number of households with income $40k - 50k:
Belle Haven:
8.3% (16)
Virginia:
6.0% (133,011)
Number of households with income $50k - 60k:
Belle Haven:
16.7% (32)
State:
6.2% (136,856)
Number of households with income $60k - 75k:
Belle Haven:
4.2% (8)
Virginia:
8.4% (186,094)
Number of households with income $75k - 100k:
Belle Haven:
20.3% (39)
State:
12.5% (277,077)
Number of households with income $100k - 125k:
Belle Haven:
15.1% (29)
Virginia:
10.8% (237,562)
Number of households with income $125k - 150k:
Belle Haven:
1.0% (2)
Virginia:
8.0% (177,532)
Number of households with income $150k - 200k:
Belle Haven:
5.2% (10)
State:
11.0% (242,106)
Number of households with income > $200k:
Belle Haven:
0.0% (0)
Virginia:
16.6% (366,064)
Aggregate household income in Belle Haven in 2022: $12,691,307
Median family income in Belle Haven in 2022:
Belle Haven:
$89,556
State:
$114,708
Number of families with income $40k - 50k:
Belle Haven:
12.2% (12)
State:
4.7% (66,206)
Number of families with income $50k - 60k:
Belle Haven:
32.5% (31)
State:
5.2% (74,438)
Number of families with income $75k - 100k:
Belle Haven:
12.5% (12)
State:
12.9% (183,581)
Number of families with income $100k - 125k:
Belle Haven:
30.4% (29)
State:
11.9% (168,950)
Number of families with income $125k - 150k:
Belle Haven:
2.0% (2)
State:
9.5% (134,452)
Number of families with income $150k - 200k:
Belle Haven:
10.4% (10)
Virginia:
13.8% (195,800)
Median non-family income in Belle Haven in 2022:
Belle Haven:
$36,271
Virginia:
$53,785
Change in median non-family income between 2000 and 2022:
Belle Haven, Virginia:
+36.9%
State:
+70.5%
Median per capita income in Belle Haven in 2022:
Belle Haven:
$33,796
State:
$53,456
Change in median per capita income between 2000 and 2022:
Belle Haven, Virginia:
+80.2%
Virginia:
+99.2%
Income statistics for Black or African American residents
Median household income in Belle Haven, VA in 2022:
Belle Haven:
$63,499
State:
$60,526
Number of households with income < $10k:
Belle Haven:
6.2% (4)
State:
8.3% (52,649)
Number of households with income $10k - 20k:
Belle Haven:
1.6% (1)
State:
9.6% (60,583)
Number of households with income $20k - 30k:
Belle Haven:
6.2% (4)
State:
8.1% (51,220)
Number of households with income $30k - 40k:
Belle Haven:
4.7% (3)
State:
8.6% (54,185)
Number of households with income $40k - 50k:
Belle Haven:
20.3% (13)
Virginia:
8.1% (51,156)
Number of households with income $50k - 60k:
Belle Haven:
3.1% (2)
Virginia:
7.0% (44,637)
Number of households with income $60k - 75k:
Belle Haven:
31.2% (20)
State:
9.8% (62,332)
Number of households with income $75k - 100k:
Belle Haven:
17.2% (11)
State:
11.4% (72,479)
Number of households with income $100k - 125k:
Belle Haven:
9.4% (6)
State:
8.5% (53,997)
Number of households with income $125k - 150k:
Belle Haven:
0.0% (0)
State:
6.3% (40,032)
Number of households with income $150k - 200k:
Belle Haven:
0.0% (0)
State:
6.9% (43,513)
Number of households with income > $200k:
Belle Haven:
0.0% (0)
State:
7.4% (46,851)
Aggregate household income in Belle Haven in 2022: $3,726,723
Median family income in Belle Haven in 2022:
Belle Haven:
$40,767
Virginia:
$74,125
Number of families with income < $10k:
Belle Haven:
6.4% (3)
State:
5.7% (21,574)
Number of families with income $20k - 30k:
Belle Haven:
34.0% (18)
Virginia:
6.6% (24,902)
Number of families with income $40k - 50k:
Belle Haven:
24.5% (13)
State:
7.9% (29,836)
Number of families with income $50k - 60k:
Belle Haven:
3.7% (2)
State:
6.9% (26,158)
Number of families with income $75k - 100k:
Belle Haven:
20.3% (11)
Virginia:
13.0% (49,024)
Number of families with income $100k - 125k:
Belle Haven:
11.1% (6)
Virginia:
9.9% (37,339)
Median non-family income in Belle Haven in 2022:
Belle Haven:
$29,882
Virginia:
$40,425
Median per capita income in Belle Haven in 2022:
Belle Haven:
$15,715
State:
$34,599
Change in median per capita income between 2000 and 2022:
Belle Haven, Virginia:
+54.0%
Virginia:
+119.8%
Income statistics for Hispanic or Latino residents
Number of households with income < $10k:
Belle Haven:
0.0% (0)
State:
4.6% (11,664)
Number of households with income $10k - 20k:
Belle Haven:
0.0% (0)
Virginia:
4.9% (12,443)
Number of households with income $20k - 30k:
Belle Haven:
16.7% (3)
State:
5.9% (14,859)
Number of households with income $30k - 40k:
Belle Haven:
0.0% (0)
Virginia:
6.8% (17,059)
Number of households with income $40k - 50k:
Belle Haven:
83.3% (15)
State:
6.4% (16,261)
Number of households with income $50k - 60k:
Belle Haven:
0.0% (0)
State:
6.9% (17,468)
Number of households with income $60k - 75k:
Belle Haven:
0.0% (0)
State:
9.6% (24,193)
Number of households with income $75k - 100k:
Belle Haven:
0.0% (0)
State:
13.2% (33,405)
Number of households with income $100k - 125k:
Belle Haven:
0.0% (0)
State:
10.5% (26,356)
Number of households with income $125k - 150k:
Belle Haven:
0.0% (0)
Virginia:
8.1% (20,494)
Number of households with income $150k - 200k:
Belle Haven:
0.0% (0)
Virginia:
9.5% (23,943)
Number of households with income > $200k:
Belle Haven:
0.0% (0)
State:
13.5% (33,987)
Median per capita income in Belle Haven in 2022:
Belle Haven:
$21,018
State:
$32,277
Income statistics for American Indian and Alaska Native residents
Number of households with income < $10k:
Belle Haven:
0.0% (0)
State:
3.6% (321)
Number of households with income $10k - 20k:
Belle Haven:
0.0% (0)
State:
4.0% (353)
Number of households with income $20k - 30k:
Belle Haven:
0.0% (0)
State:
7.8% (693)
Number of households with income $30k - 40k:
Belle Haven:
0.0% (0)
Virginia:
4.7% (414)
Number of households with income $40k - 50k:
Belle Haven:
100.0% (15)
Virginia:
6.2% (548)
Number of households with income $50k - 60k:
Belle Haven:
0.0% (0)
State:
6.1% (544)
Number of households with income $60k - 75k:
Belle Haven:
0.0% (0)
Virginia:
12.7% (1,122)
Number of households with income $75k - 100k:
Belle Haven:
0.0% (0)
State:
14.7% (1,299)
Number of households with income $100k - 125k:
Belle Haven:
0.0% (0)
State:
17.8% (1,573)
Number of households with income $125k - 150k:
Belle Haven:
0.0% (0)
Virginia:
4.5% (396)
Number of households with income $150k - 200k:
Belle Haven:
0.0% (0)
Virginia:
7.8% (687)
Number of households with income > $200k:
Belle Haven:
0.0% (0)
Virginia:
10.2% (901)
Median per capita income in Belle Haven in 2022:
Belle Haven:
$25,023
Virginia:
$34,188
Change in median per capita income between 2000 and 2022:
Belle Haven, Virginia:
+73.2%
State:
+70.3%
Income statistics for Multirace residents
Aggregate household income in Belle Haven in 2022: $325,689
Median per capita income in Belle Haven in 2022:
Belle Haven:
$7,170
State:
$34,385
Change in median per capita income between 2000 and 2022:
Belle Haven, Virginia:
+8.3%
Virginia:
+130.2%
Discuss Belle Haven, Virginia (VA) on our hugely popular Virginia forum.