The median household income in Bellingham, MA in 2022 was $73,769, which was 28.1% less than the median annual income of $94,488 across the entire state of Massachusetts. Compared to the median income of $64,167 in 2000 this represents an increase of 13.0%. The per capita income in 2022 was $46,240, which means an increase of 46.7% compared to 2000 when it was $24,633.
Whole page based on the data from 2000 / 2022 when the population of Bellingham, Massachusetts was 4,497 / 4,658
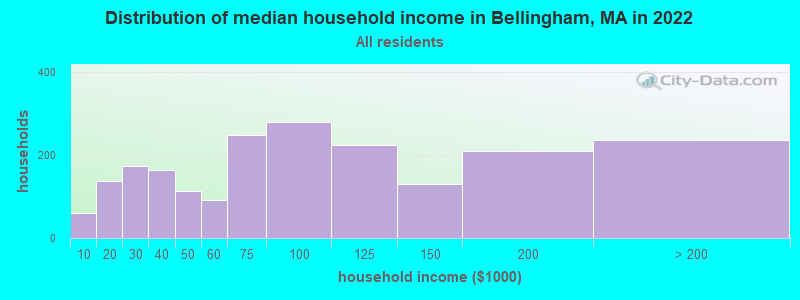
Income statistics for all residents
Median household income in Bellingham, MA in 2022:
Bellingham:
$73,770
Massachusetts:
$94,488
Change in median household income between 2000 and 2022:
Bellingham, Massachusetts:
+15.0%
State:
+87.1%
Number of households with income < $10k:
Bellingham:
2.9% (60)
Massachusetts:
5.2% (146,170)
Number of households with income $10k - 20k:
Bellingham:
6.6% (136)
State:
6.4% (180,001)
Number of households with income $20k - 30k:
Bellingham:
8.4% (173)
State:
5.6% (156,667)
Number of households with income $30k - 40k:
Bellingham:
7.9% (163)
State:
5.6% (157,168)
Number of households with income $40k - 50k:
Bellingham:
5.4% (112)
State:
5.4% (151,455)
Number of households with income $50k - 60k:
Bellingham:
4.5% (92)
State:
5.1% (142,726)
Number of households with income $60k - 75k:
Bellingham:
12.0% (248)
State:
7.6% (212,203)
Number of households with income $75k - 100k:
Bellingham:
13.5% (279)
Massachusetts:
11.3% (317,064)
Number of households with income $100k - 125k:
Bellingham:
10.8% (223)
Massachusetts:
9.7% (270,603)
Number of households with income $125k - 150k:
Bellingham:
6.3% (130)
Massachusetts:
8.0% (223,140)
Number of households with income $150k - 200k:
Bellingham:
10.1% (209)
Massachusetts:
11.0% (308,695)
Number of households with income > $200k:
Bellingham:
11.4% (235)
Massachusetts:
19.0% (531,884)
Aggregate household income in Bellingham in 2022: $214,022,362
Median family income in Bellingham in 2022:
Bellingham:
$104,801
State:
$120,263
Number of families with income < $10k:
Bellingham:
1.3% (15)
State:
2.9% (49,671)
Number of families with income $10k - 20k:
Bellingham:
1.9% (22)
Massachusetts:
2.9% (50,542)
Number of families with income $30k - 40k:
Bellingham:
4.1% (46)
State:
4.5% (78,234)
Number of families with income $40k - 50k:
Bellingham:
9.2% (105)
State:
4.5% (77,656)
Number of families with income $50k - 60k:
Bellingham:
6.1% (69)
Massachusetts:
4.5% (77,928)
Number of families with income $60k - 75k:
Bellingham:
7.2% (82)
State:
7.0% (120,295)
Number of families with income $75k - 100k:
Bellingham:
20.9% (238)
Massachusetts:
11.1% (192,172)
Number of families with income $100k - 125k:
Bellingham:
12.0% (137)
State:
10.6% (182,105)
Number of families with income $125k - 150k:
Bellingham:
6.2% (71)
State:
9.3% (159,566)
Number of families with income $150k - 200k:
Bellingham:
14.7% (168)
State:
13.4% (231,410)
Number of families with income > $200k:
Bellingham:
16.5% (189)
State:
25.4% (438,378)
Median per capita income in Bellingham in 2022:
Bellingham:
$46,240
State:
$54,025
Change in median per capita income between 2000 and 2022:
Bellingham, Massachusetts:
+87.7%
State:
+108.2%
Income statistics for White residents
Median household income in Bellingham, MA in 2022:
Bellingham:
$72,410
State:
$101,391
Change in median household income between 2000 and 2022:
Bellingham, Massachusetts:
+12.5%
State:
+93.3%
Number of households with income < $10k:
Bellingham:
2.2% (41)
State:
4.4% (91,120)
Number of households with income $10k - 20k:
Bellingham:
7.0% (130)
Massachusetts:
5.9% (122,055)
Number of households with income $20k - 30k:
Bellingham:
9.2% (171)
State:
5.1% (105,311)
Number of households with income $30k - 40k:
Bellingham:
9.0% (168)
State:
5.3% (110,239)
Number of households with income $40k - 50k:
Bellingham:
6.5% (121)
State:
5.0% (104,636)
Number of households with income $50k - 60k:
Bellingham:
4.4% (82)
State:
4.8% (99,486)
Number of households with income $60k - 75k:
Bellingham:
12.6% (234)
State:
7.5% (155,124)
Number of households with income $75k - 100k:
Bellingham:
11.9% (222)
Massachusetts:
11.4% (236,252)
Number of households with income $100k - 125k:
Bellingham:
11.1% (207)
State:
9.9% (204,731)
Number of households with income $125k - 150k:
Bellingham:
5.3% (99)
State:
8.5% (175,324)
Number of households with income $150k - 200k:
Bellingham:
9.2% (171)
Massachusetts:
11.7% (242,980)
Number of households with income > $200k:
Bellingham:
11.6% (215)
State:
20.5% (425,966)
Aggregate household income in Bellingham in 2022: $190,271,684
Median family income in Bellingham in 2022:
Bellingham:
$105,376
State:
$133,153
Number of families with income < $10k:
Bellingham:
1.2% (11)
State:
2.0% (25,038)
Number of families with income $10k - 20k:
Bellingham:
1.9% (19)
Massachusetts:
2.1% (26,403)
Number of families with income $30k - 40k:
Bellingham:
4.1% (40)
State:
3.9% (48,079)
Number of families with income $40k - 50k:
Bellingham:
11.2% (110)
Massachusetts:
3.8% (46,908)
Number of families with income $50k - 60k:
Bellingham:
6.7% (66)
Massachusetts:
3.8% (46,476)
Number of families with income $60k - 75k:
Bellingham:
7.4% (72)
State:
6.4% (79,040)
Number of families with income $75k - 100k:
Bellingham:
17.4% (170)
Massachusetts:
11.1% (137,395)
Number of families with income $100k - 125k:
Bellingham:
13.3% (130)
State:
11.1% (136,771)
Number of families with income $125k - 150k:
Bellingham:
5.9% (57)
State:
10.0% (123,709)
Number of families with income $150k - 200k:
Bellingham:
13.6% (133)
State:
14.7% (181,602)
Number of families with income > $200k:
Bellingham:
17.3% (169)
Massachusetts:
28.5% (351,887)
Median per capita income in Bellingham in 2022:
Bellingham:
$47,886
Massachusetts:
$60,804
Change in median per capita income between 2000 and 2022:
Bellingham, Massachusetts:
+92.4%
Massachusetts:
+118.7%
Income statistics for Black or African American residents
Number of households with income < $10k:
Bellingham:
100.0% (23)
Massachusetts:
9.1% (15,797)
Number of households with income $10k - 20k:
Bellingham:
0.0% (0)
State:
9.4% (16,267)
Number of households with income $20k - 30k:
Bellingham:
0.0% (0)
State:
7.8% (13,520)
Number of households with income $30k - 40k:
Bellingham:
0.0% (0)
State:
8.3% (14,412)
Number of households with income $40k - 50k:
Bellingham:
0.0% (0)
State:
7.9% (13,790)
Number of households with income $50k - 60k:
Bellingham:
0.0% (0)
State:
5.8% (10,041)
Number of households with income $60k - 75k:
Bellingham:
0.0% (0)
State:
8.5% (14,822)
Number of households with income $75k - 100k:
Bellingham:
0.0% (0)
State:
11.0% (19,122)
Number of households with income $100k - 125k:
Bellingham:
0.0% (0)
Massachusetts:
8.4% (14,575)
Number of households with income $125k - 150k:
Bellingham:
0.0% (0)
Massachusetts:
6.0% (10,429)
Number of households with income $150k - 200k:
Bellingham:
0.0% (0)
State:
7.2% (12,539)
Number of households with income > $200k:
Bellingham:
0.0% (0)
State:
10.5% (18,185)
Aggregate household income in Bellingham in 2022: $3,556,113
Median per capita income in Bellingham in 2022:
Bellingham:
$39,760
State:
$33,524
Change in median per capita income between 2000 and 2022:
Bellingham, Massachusetts:
+55.6%
State:
+109.4%
Income statistics for Asian residents
Number of households with income < $10k:
Bellingham:
0.0% (0)
State:
6.8% (11,982)
Number of households with income $10k - 20k:
Bellingham:
0.0% (0)
State:
4.8% (8,376)
Number of households with income $20k - 30k:
Bellingham:
0.0% (0)
State:
3.7% (6,558)
Number of households with income $30k - 40k:
Bellingham:
0.0% (0)
State:
3.3% (5,748)
Number of households with income $40k - 50k:
Bellingham:
0.0% (0)
Massachusetts:
4.1% (7,192)
Number of households with income $50k - 60k:
Bellingham:
0.0% (0)
State:
5.0% (8,734)
Number of households with income $60k - 75k:
Bellingham:
0.0% (0)
State:
5.8% (10,203)
Number of households with income $75k - 100k:
Bellingham:
0.0% (0)
Massachusetts:
8.6% (15,154)
Number of households with income $100k - 125k:
Bellingham:
0.0% (0)
State:
10.8% (18,942)
Number of households with income $125k - 150k:
Bellingham:
0.0% (0)
Massachusetts:
8.0% (14,037)
Number of households with income $150k - 200k:
Bellingham:
100.0% (27)
State:
12.5% (21,856)
Number of households with income > $200k:
Bellingham:
0.0% (0)
Massachusetts:
26.6% (46,694)
Median per capita income in Bellingham in 2022:
Bellingham:
$64,651
Massachusetts:
$58,900
Income statistics for Hispanic or Latino residents
Median household income in Bellingham, MA in 2022:
Bellingham:
$66,843
State:
$61,523
Number of households with income < $10k:
Bellingham:
0.0% (0)
State:
8.8% (25,307)
Number of households with income $10k - 20k:
Bellingham:
0.0% (0)
State:
10.0% (28,653)
Number of households with income $20k - 30k:
Bellingham:
0.0% (0)
State:
8.8% (25,189)
Number of households with income $30k - 40k:
Bellingham:
0.0% (0)
State:
7.2% (20,822)
Number of households with income $40k - 50k:
Bellingham:
0.0% (0)
State:
7.2% (20,817)
Number of households with income $50k - 60k:
Bellingham:
0.0% (0)
Massachusetts:
6.5% (18,748)
Number of households with income $60k - 75k:
Bellingham:
0.0% (0)
Massachusetts:
8.8% (25,390)
Number of households with income $75k - 100k:
Bellingham:
84.5% (71)
Massachusetts:
12.0% (34,488)
Number of households with income $100k - 125k:
Bellingham:
0.0% (0)
State:
8.6% (24,599)
Number of households with income $125k - 150k:
Bellingham:
10.7% (9)
Massachusetts:
6.2% (17,743)
Number of households with income $150k - 200k:
Bellingham:
4.8% (4)
State:
7.3% (21,017)
Number of households with income > $200k:
Bellingham:
0.0% (0)
Massachusetts:
8.6% (24,606)
Aggregate household income in Bellingham in 2022: $6,990,979
Median per capita income in Bellingham in 2022:
Bellingham:
$31,470
State:
$28,993
Change in median per capita income between 2000 and 2022:
Bellingham, Massachusetts:
+80.9%
State:
+142.4%
Income statistics for Multirace residents
Median household income in Bellingham, MA in 2022:
Bellingham:
$144,481
State:
$71,552
Number of households with income < $10k:
Bellingham:
0.0% (0)
Massachusetts:
6.6% (15,127)
Number of households with income $10k - 20k:
Bellingham:
0.0% (0)
State:
9.2% (21,158)
Number of households with income $20k - 30k:
Bellingham:
0.0% (0)
State:
7.8% (18,016)
Number of households with income $30k - 40k:
Bellingham:
0.0% (0)
State:
7.9% (18,260)
Number of households with income $40k - 50k:
Bellingham:
0.0% (0)
State:
5.6% (13,027)
Number of households with income $50k - 60k:
Bellingham:
0.0% (0)
State:
5.6% (12,909)
Number of households with income $60k - 75k:
Bellingham:
0.0% (0)
State:
9.0% (20,800)
Number of households with income $75k - 100k:
Bellingham:
0.0% (0)
Massachusetts:
12.1% (27,875)
Number of households with income $100k - 125k:
Bellingham:
0.0% (0)
State:
8.1% (18,754)
Number of households with income $125k - 150k:
Bellingham:
50.9% (27)
State:
6.8% (15,621)
Number of households with income $150k - 200k:
Bellingham:
9.4% (5)
Massachusetts:
9.4% (21,618)
Number of households with income > $200k:
Bellingham:
39.6% (21)
Massachusetts:
12.0% (27,592)
Aggregate household income in Bellingham in 2022: $13,039,607
Median per capita income in Bellingham in 2022:
Bellingham:
$61,870
Massachusetts:
$34,029
Income statistics for other residents
Number of households with income < $10k:
Bellingham:
0.0% (0)
Massachusetts:
8.4% (11,559)
Number of households with income $10k - 20k:
Bellingham:
0.0% (0)
State:
8.4% (11,499)
Number of households with income $20k - 30k:
Bellingham:
0.0% (0)
State:
9.5% (13,070)
Number of households with income $30k - 40k:
Bellingham:
0.0% (0)
State:
6.0% (8,291)
Number of households with income $40k - 50k:
Bellingham:
0.0% (0)
State:
9.2% (12,611)
Number of households with income $50k - 60k:
Bellingham:
0.0% (0)
State:
7.9% (10,879)
Number of households with income $60k - 75k:
Bellingham:
0.0% (0)
State:
7.5% (10,239)
Number of households with income $75k - 100k:
Bellingham:
100.0% (79)
State:
13.1% (18,032)
Number of households with income $100k - 125k:
Bellingham:
0.0% (0)
Massachusetts:
9.6% (13,141)
Number of households with income $125k - 150k:
Bellingham:
0.0% (0)
Massachusetts:
5.0% (6,808)
Number of households with income $150k - 200k:
Bellingham:
0.0% (0)
State:
6.4% (8,843)
Number of households with income > $200k:
Bellingham:
0.0% (0)
State:
9.0% (12,396)
Aggregate household income in Bellingham in 2022: $6,592,658
Median per capita income in Bellingham in 2022:
Bellingham:
$25,193
State:
$30,797
Change in median per capita income between 2000 and 2022:
Bellingham, Massachusetts:
+140.3%
Massachusetts:
+188.5%
Discuss Bellingham, Massachusetts (MA) on our hugely popular Massachusetts forum.