Bethesda, Tennessee (TN) income map, earnings map, and wages data
The median household income in Bethesda, TN in 2022 was $66,141, which was about the same as the median annual income of $65,254 across the entire state of Tennessee. Compared to the median income of $33,750 in 2000 this represents an increase of 49.0%. The per capita income in 2022 was $33,709, which means an increase of 51.2% compared to 2000 when it was $16,457.
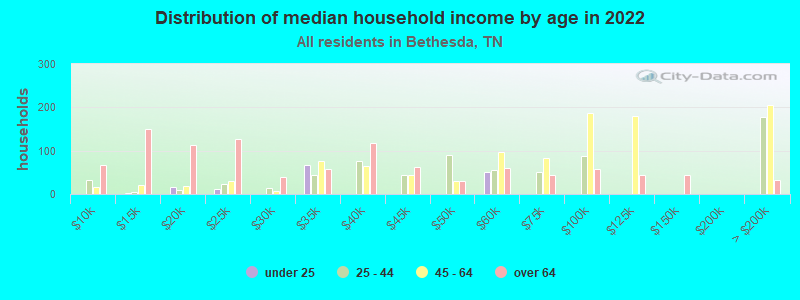
Income statistics for all residents
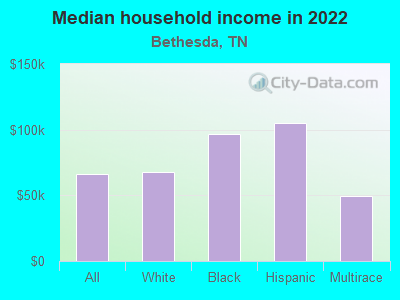
Median household income in Bethesda, TN in 2022:| Bethesda: | $66,141 |
| State: | $65,254 |
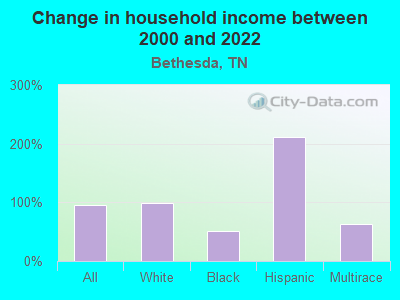
Change in median household income between 2000 and 2022:| Bethesda, Tennessee: | +96.0% |
| State: | +79.5% |
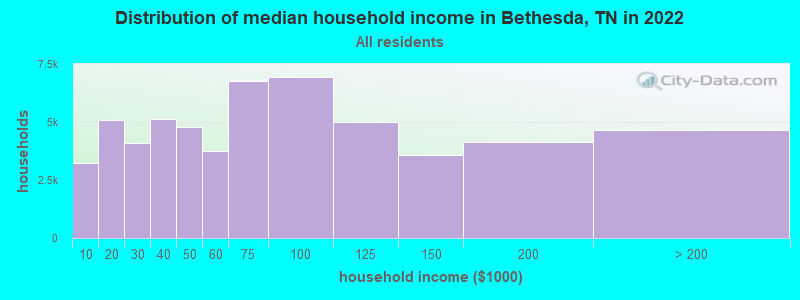
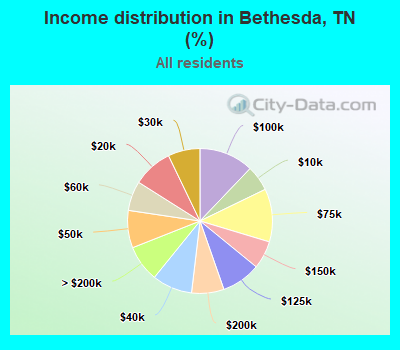
Number of households with income < $10k:| Bethesda: | 5.7% (3,243) |
| Tennessee: | 5.4% (154,793) |
Number of households with income $10k - 20k:| Bethesda: | 8.9% (5,084) |
| Tennessee: | 8.0% (228,599) |
Number of households with income $20k - 30k:| Bethesda: | 7.1% (4,082) |
| State: | 7.9% (224,908) |
Number of households with income $30k - 40k:| Bethesda: | 9.0% (5,123) |
| Tennessee: | 8.6% (244,297) |
Number of households with income $40k - 50k:| Bethesda: | 8.4% (4,776) |
| Tennessee: | 8.4% (238,949) |
Number of households with income $50k - 60k:| Bethesda: | 6.6% (3,769) |
| Tennessee: | 7.7% (218,438) |
Number of households with income $60k - 75k:| Bethesda: | 11.8% (6,772) |
| State: | 10.3% (294,172) |
Number of households with income $75k - 100k:| Bethesda: | 12.1% (6,941) |
| Tennessee: | 13.3% (377,310) |
Number of households with income $100k - 125k:| Bethesda: | 8.8% (5,002) |
| State: | 9.5% (269,124) |
Number of households with income $125k - 150k:| Bethesda: | 6.2% (3,565) |
| Tennessee: | 6.3% (178,328) |
Number of households with income $150k - 200k:| Bethesda: | 7.2% (4,133) |
| State: | 7.2% (204,030) |
Number of households with income > $200k:| Bethesda: | 8.2% (4,666) |
| State: | 7.5% (213,736) |
Aggregate household income in Bethesda in 2022: $260,775,316
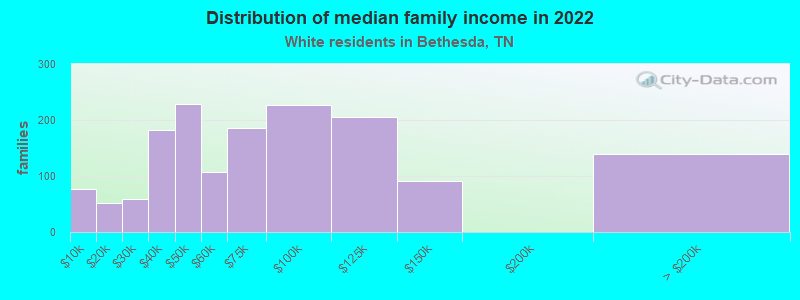
Median family income in Bethesda in 2022:| Bethesda: | $78,798 |
| Tennessee: | $80,910 |
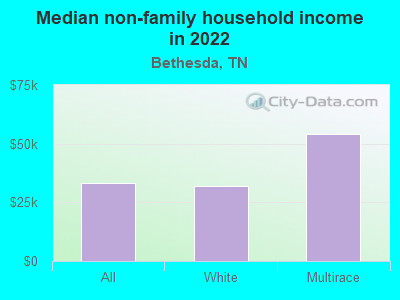
Median non-family income in Bethesda in 2022:| Bethesda: | $33,410 |
| State: | $40,285 |
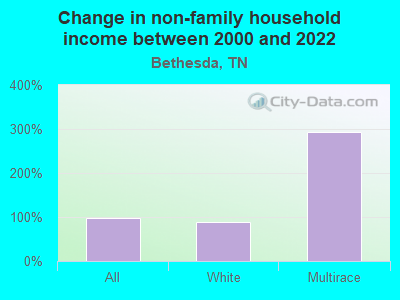
Change in median non-family income between 2000 and 2022:| Bethesda, Tennessee: | +97.1% |
| State: | +91.5% |
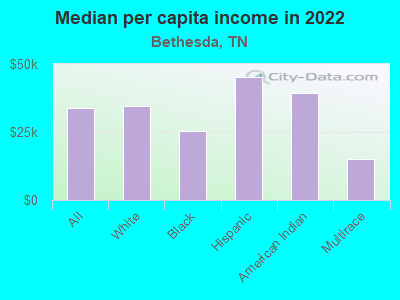
Median per capita income in Bethesda in 2022:| Bethesda: | $33,710 |
| State: | $36,704 |
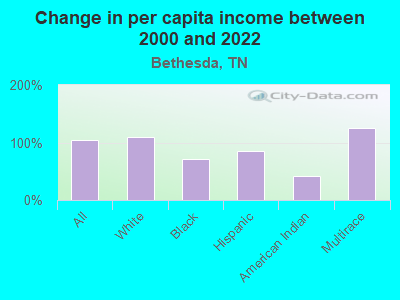
Change in median per capita income between 2000 and 2022:| Bethesda, Tennessee: | +104.8% |
| State: | +89.3% |
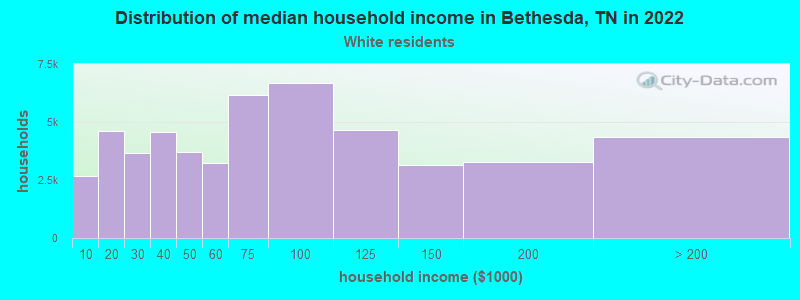
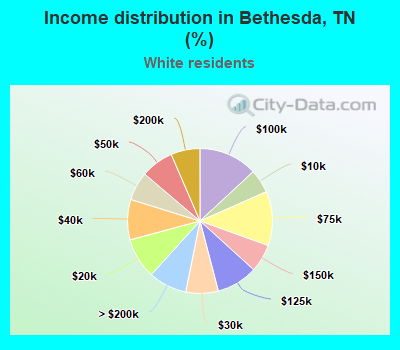
Income statistics for White residents
Median household income in Bethesda, TN in 2022:| Bethesda: | $67,654 |
| State: | $69,826 |
Change in median household income between 2000 and 2022:| Bethesda, Tennessee: | +99.1% |
| Tennessee: | +82.9% |
Number of households with income < $10k:| Bethesda: | 5.3% (2,688) |
| State: | 4.6% (100,279) |
Number of households with income $10k - 20k:| Bethesda: | 9.1% (4,614) |
| State: | 7.6% (165,031) |
Number of households with income $20k - 30k:| Bethesda: | 7.2% (3,682) |
| State: | 7.4% (160,229) |
Number of households with income $30k - 40k:| Bethesda: | 9.0% (4,570) |
| Tennessee: | 8.1% (174,784) |
Number of households with income $40k - 50k:| Bethesda: | 7.3% (3,714) |
| State: | 7.8% (169,622) |
Number of households with income $50k - 60k:| Bethesda: | 6.4% (3,245) |
| State: | 7.6% (165,508) |
Number of households with income $60k - 75k:| Bethesda: | 12.1% (6,156) |
| Tennessee: | 10.3% (223,937) |
Number of households with income $75k - 100k:| Bethesda: | 13.1% (6,660) |
| State: | 13.5% (292,688) |
Number of households with income $100k - 125k:| Bethesda: | 9.2% (4,663) |
| State: | 10.1% (219,251) |
Number of households with income $125k - 150k:| Bethesda: | 6.2% (3,166) |
| Tennessee: | 6.6% (142,574) |
Number of households with income $150k - 200k:| Bethesda: | 6.5% (3,294) |
| Tennessee: | 7.7% (166,039) |
Number of households with income > $200k:| Bethesda: | 8.6% (4,351) |
| State: | 8.5% (184,546) |
Aggregate household income in Bethesda in 2022: $245,688,274
Median family income in Bethesda in 2022:| Bethesda: | $79,078 |
| State: | $86,015 |
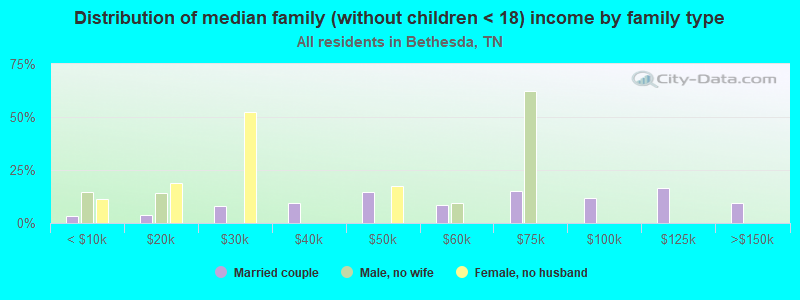
Number of families with income < $10k:| Bethesda: | 4.9% (77) |
| State: | 3.1% (43,751) |
Number of families with income $10k - 20k:| Bethesda: | 3.3% (51) |
| State: | 3.5% (49,925) |
Number of families with income $20k - 30k:| Bethesda: | 3.8% (59) |
| State: | 5.0% (70,431) |
Number of families with income $30k - 40k:| Bethesda: | 11.7% (182) |
| Tennessee: | 6.6% (93,498) |
Number of families with income $40k - 50k:| Bethesda: | 14.7% (228) |
| State: | 6.8% (96,726) |
Number of families with income $50k - 60k:| Bethesda: | 6.9% (107) |
| State: | 7.2% (101,879) |
Number of families with income $60k - 75k:| Bethesda: | 12.0% (186) |
| State: | 10.7% (151,997) |
Number of families with income $75k - 100k:| Bethesda: | 14.5% (226) |
| State: | 15.4% (218,373) |
Number of families with income $100k - 125k:| Bethesda: | 13.3% (206) |
| Tennessee: | 12.6% (178,761) |
Number of families with income $125k - 150k:| Bethesda: | 5.9% (91) |
| State: | 8.2% (116,575) |
Number of families with income > $200k:| Bethesda: | 8.9% (139) |
| Tennessee: | 11.2% (159,431) |
Median non-family income in Bethesda in 2022:| Bethesda: | $32,134 |
| State: | $41,178 |
Change in median non-family income between 2000 and 2022:| Bethesda, Tennessee: | +89.3% |
| Tennessee: | +91.1% |
Median per capita income in Bethesda in 2022:| Bethesda: | $34,564 |
| State: | $40,126 |
Change in median per capita income between 2000 and 2022:| Bethesda, Tennessee: | +109.3% |
| State: | +92.6% |
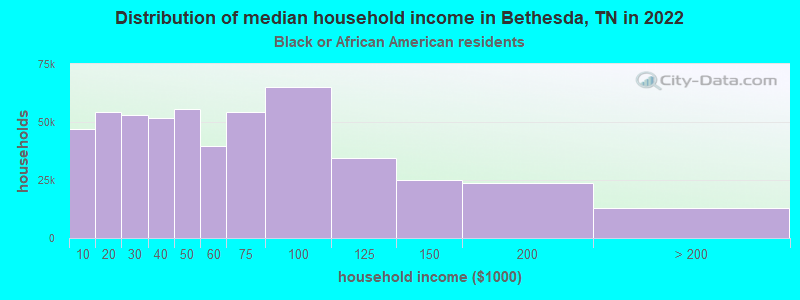
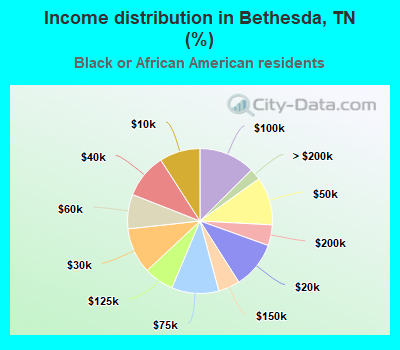
Income statistics for Black or African American residents
Median household income in Bethesda, TN in 2022:| Bethesda: | $96,400 |
| State: | $49,531 |
Change in median household income between 2000 and 2022:| Bethesda, Tennessee: | +51.2% |
| Tennessee: | +82.3% |
Number of households with income < $10k:| Bethesda: | 9.1% (46,984) |
| State: | 9.1% (39,909) |
Number of households with income $10k - 20k:| Bethesda: | 10.5% (54,348) |
| State: | 10.5% (46,276) |
Number of households with income $20k - 30k:| Bethesda: | 10.2% (53,013) |
| Tennessee: | 10.2% (45,072) |
Number of households with income $30k - 40k:| Bethesda: | 10.0% (51,538) |
| State: | 10.0% (43,885) |
Number of households with income $40k - 50k:| Bethesda: | 10.7% (55,617) |
| Tennessee: | 10.7% (47,267) |
Number of households with income $50k - 60k:| Bethesda: | 7.7% (39,805) |
| State: | 7.7% (33,868) |
Number of households with income $60k - 75k:| Bethesda: | 10.5% (54,358) |
| State: | 10.5% (46,247) |
Number of households with income $75k - 100k:| Bethesda: | 12.6% (65,134) |
| State: | 12.6% (55,465) |
Number of households with income $100k - 125k:| Bethesda: | 6.7% (34,610) |
| State: | 6.7% (29,515) |
Number of households with income $125k - 150k:| Bethesda: | 4.8% (25,012) |
| State: | 4.8% (21,306) |
Number of households with income $150k - 200k:| Bethesda: | 4.6% (23,898) |
| State: | 4.6% (20,425) |
Number of households with income > $200k:| Bethesda: | 2.5% (13,089) |
| Tennessee: | 2.5% (11,183) |
Aggregate household income in Bethesda in 2022: $899,417
Median family income in Bethesda in 2022:| Bethesda: | $62,029 |
| Tennessee: | $61,153 |
Median per capita income in Bethesda in 2022:| Bethesda: | $25,497 |
| Tennessee: | $27,306 |
Change in median per capita income between 2000 and 2022:| Bethesda, Tennessee: | +72.5% |
| Tennessee: | +105.3% |
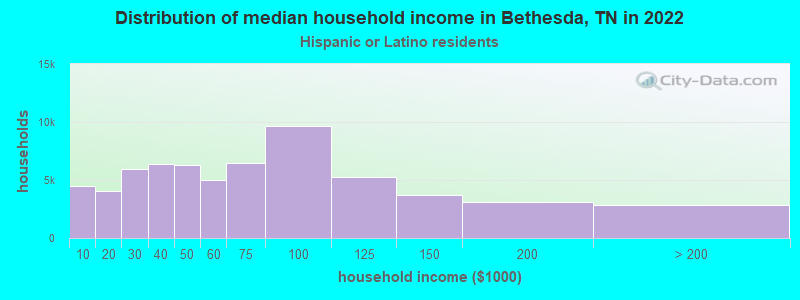
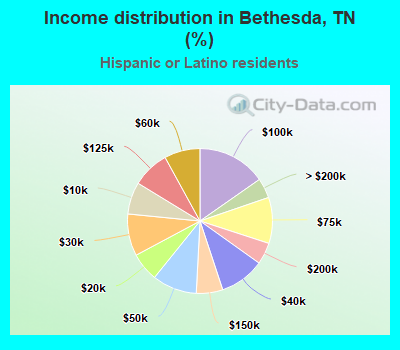
Income statistics for Hispanic or Latino residents
Median household income in Bethesda, TN in 2022:| Bethesda: | $105,411 |
| Tennessee: | $58,385 |
Number of households with income < $10k:| Bethesda: | 7.2% (4,524) |
| State: | 7.2% (8,567) |
Number of households with income $10k - 20k:| Bethesda: | 6.4% (4,037) |
| State: | 6.4% (7,670) |
Number of households with income $20k - 30k:| Bethesda: | 9.4% (5,906) |
| Tennessee: | 9.4% (11,247) |
Number of households with income $30k - 40k:| Bethesda: | 10.1% (6,346) |
| State: | 10.1% (12,072) |
Number of households with income $40k - 50k:| Bethesda: | 10.0% (6,291) |
| State: | 10.0% (11,947) |
Number of households with income $50k - 60k:| Bethesda: | 8.0% (5,036) |
| Tennessee: | 8.0% (9,569) |
Number of households with income $60k - 75k:| Bethesda: | 10.3% (6,475) |
| State: | 10.3% (12,315) |
Number of households with income $75k - 100k:| Bethesda: | 15.3% (9,650) |
| Tennessee: | 15.3% (18,285) |
Number of households with income $100k - 125k:| Bethesda: | 8.3% (5,232) |
| State: | 8.3% (9,886) |
Number of households with income $125k - 150k:| Bethesda: | 5.9% (3,729) |
| State: | 5.9% (7,066) |
Number of households with income $150k - 200k:| Bethesda: | 4.9% (3,066) |
| State: | 4.9% (5,822) |
Number of households with income > $200k:| Bethesda: | 4.5% (2,811) |
| State: | 4.5% (5,337) |
Aggregate household income in Bethesda in 2022: $1,688,921
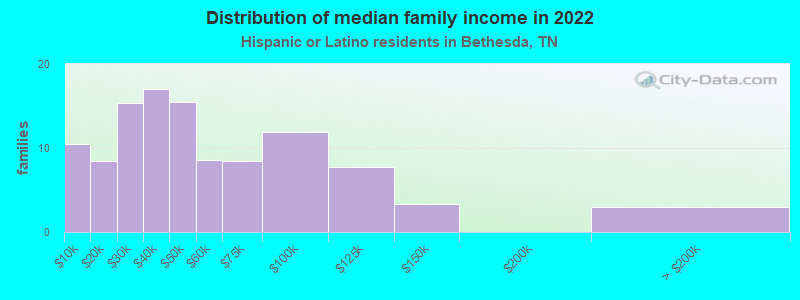
Median family income in Bethesda in 2022:| Bethesda: | $111,788 |
| State: | $64,014 |
Number of families with income < $10k:| Bethesda: | 9.5% (10) |
| Tennessee: | 6.5% (5,773) |
Number of families with income $10k - 20k:| Bethesda: | 7.7% (8) |
| State: | 5.4% (4,773) |
Number of families with income $20k - 30k:| Bethesda: | 14.0% (15) |
| State: | 9.2% (8,233) |
Number of families with income $30k - 40k:| Bethesda: | 15.5% (17) |
| Tennessee: | 9.6% (8,514) |
Number of families with income $40k - 50k:| Bethesda: | 14.1% (15) |
| Tennessee: | 8.8% (7,850) |
Number of families with income $50k - 60k:| Bethesda: | 7.8% (9) |
| State: | 7.9% (7,017) |
Number of families with income $60k - 75k:| Bethesda: | 7.7% (8) |
| State: | 10.8% (9,605) |
Number of families with income $75k - 100k:| Bethesda: | 10.9% (12) |
| State: | 16.6% (14,820) |
Number of families with income $100k - 125k:| Bethesda: | 7.0% (8) |
| State: | 8.4% (7,480) |
Number of families with income $125k - 150k:| Bethesda: | 3.0% (3) |
| State: | 6.3% (5,594) |
Number of families with income > $200k:| Bethesda: | 2.7% (3) |
| State: | 5.1% (4,577) |
Median per capita income in Bethesda in 2022:| Bethesda: | $45,061 |
| Tennessee: | $21,276 |
Change in median per capita income between 2000 and 2022:| Bethesda, Tennessee: | +86.0% |
| State: | +76.0% |
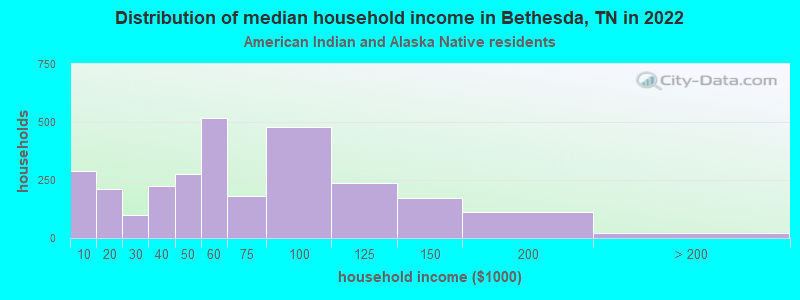
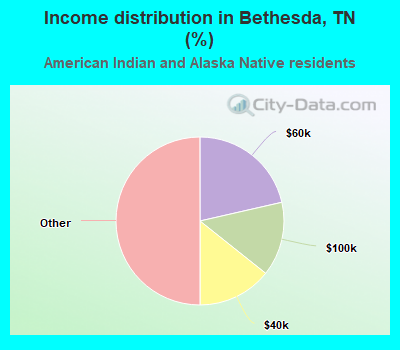
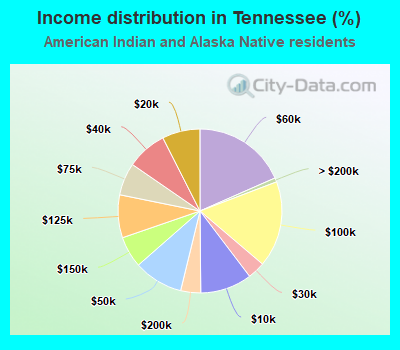
Income statistics for American Indian and Alaska Native residents
Number of households with income < $10k:| Bethesda: | 7.1% (1) |
| State: | 10.2% (535) |
Number of households with income $10k - 20k:| Bethesda: | 7.1% (1) |
| State: | 7.5% (392) |
Number of households with income $20k - 30k:| Bethesda: | 0.0% (0) |
| State: | 3.4% (181) |
Number of households with income $30k - 40k:| Bethesda: | 14.3% (2) |
| State: | 7.9% (416) |
Number of households with income $40k - 50k:| Bethesda: | 7.1% (1) |
| Tennessee: | 9.7% (511) |
Number of households with income $50k - 60k:| Bethesda: | 21.4% (3) |
| State: | 18.4% (966) |
Number of households with income $60k - 75k:| Bethesda: | 7.1% (1) |
| State: | 6.4% (337) |
Number of households with income $75k - 100k:| Bethesda: | 14.3% (2) |
| Tennessee: | 17.0% (892) |
Number of households with income $100k - 125k:| Bethesda: | 7.1% (1) |
| State: | 8.5% (444) |
Number of households with income $125k - 150k:| Bethesda: | 7.1% (1) |
| State: | 6.2% (324) |
Number of households with income $150k - 200k:| Bethesda: | 7.1% (1) |
| State: | 3.9% (207) |
Number of households with income > $200k:| Bethesda: | 0.0% (0) |
| Tennessee: | 0.8% (43) |
Aggregate household income in Bethesda in 2022: $1,011,243
Median per capita income in Bethesda in 2022:| Bethesda: | $39,356 |
| State: | $25,981 |
Change in median per capita income between 2000 and 2022:| Bethesda, Tennessee: | +41.0% |
| Tennessee: | +40.2% |
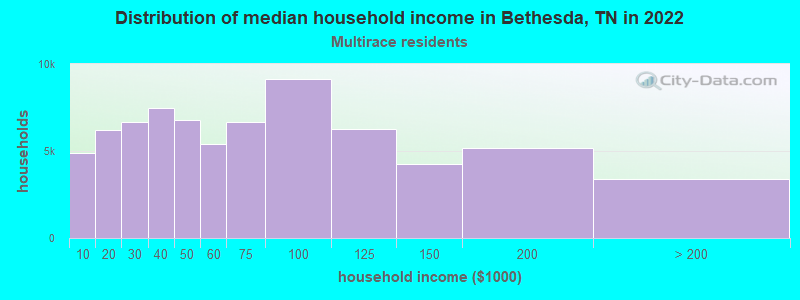
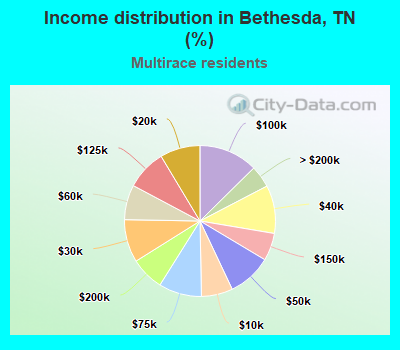
Income statistics for Multirace residents
Median household income in Bethesda, TN in 2022:| Bethesda: | $49,450 |
| Tennessee: | $57,741 |
Change in median household income between 2000 and 2022:| Bethesda, Tennessee: | +62.8% |
| State: | +87.1% |
Number of households with income < $10k:| Bethesda: | 6.7% (4,858) |
| Tennessee: | 6.7% (9,867) |
Number of households with income $10k - 20k:| Bethesda: | 8.6% (6,210) |
| State: | 8.6% (12,639) |
Number of households with income $20k - 30k:| Bethesda: | 9.2% (6,645) |
| State: | 9.2% (13,555) |
Number of households with income $30k - 40k:| Bethesda: | 10.3% (7,448) |
| State: | 10.3% (15,117) |
Number of households with income $40k - 50k:| Bethesda: | 9.4% (6,795) |
| Tennessee: | 9.4% (13,829) |
Number of households with income $50k - 60k:| Bethesda: | 7.5% (5,393) |
| Tennessee: | 7.5% (10,969) |
Number of households with income $60k - 75k:| Bethesda: | 9.2% (6,648) |
| Tennessee: | 9.2% (13,568) |
Number of households with income $75k - 100k:| Bethesda: | 12.6% (9,120) |
| Tennessee: | 12.6% (18,516) |
Number of households with income $100k - 125k:| Bethesda: | 8.6% (6,237) |
| State: | 8.6% (12,656) |
Number of households with income $125k - 150k:| Bethesda: | 5.9% (4,266) |
| State: | 5.9% (8,674) |
Number of households with income $150k - 200k:| Bethesda: | 7.2% (5,190) |
| State: | 7.2% (10,611) |
Number of households with income > $200k:| Bethesda: | 4.7% (3,413) |
| State: | 4.8% (6,986) |
Aggregate household income in Bethesda in 2022: $6,953,973
Median family income in Bethesda in 2022:| Bethesda: | $115,478 |
| State: | $70,058 |
Number of families with income $30k - 40k:| Bethesda: | 100.0% (67) |
| State: | 9.0% (8,699) |
Median non-family income in Bethesda in 2022:| Bethesda: | $54,076 |
| State: | $39,395 |
Median per capita income in Bethesda in 2022:| Bethesda: | $15,118 |
| Tennessee: | $24,436 |
Change in median per capita income between 2000 and 2022:| Bethesda, Tennessee: | +126.2% |
| Tennessee: | +84.3% |