The median household income in Blackwell, OK in 2022 was $46,028, which was 29.6% less than the median annual income of $59,673 across the entire state of Oklahoma. Compared to the median income of $25,835 in 2000 this represents an increase of 43.9%. The per capita income in 2022 was $23,660, which means an increase of 42.7% compared to 2000 when it was $13,558.
Whole page based on the data from 2000 / 2022 when the population of Blackwell, Oklahoma was 7,668 / 6,208
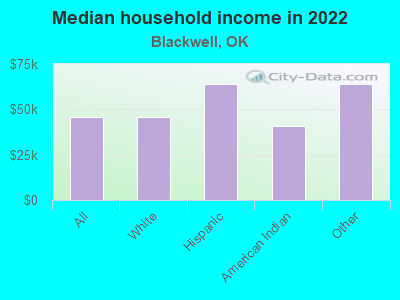
Income statistics for all residents
Median household income in Blackwell, OK in 2022:
Blackwell:
$46,029
State:
$59,673
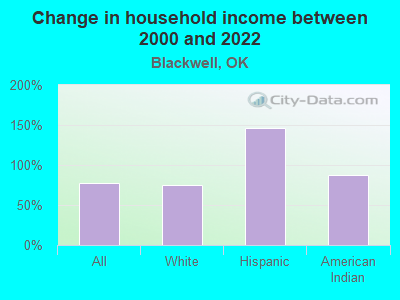
Change in median household income between 2000 and 2022:
Blackwell, Oklahoma:
+78.2%
Oklahoma:
+78.7%
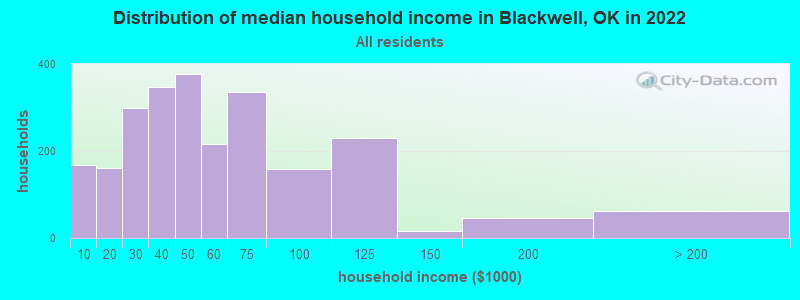
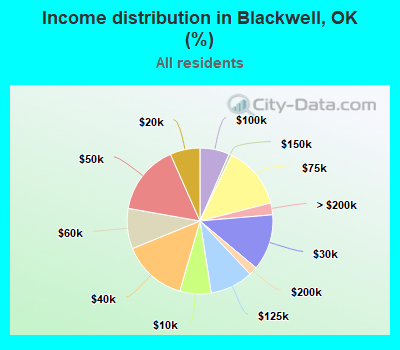
Number of households with income < $10k:
Blackwell:
6.9% (167)
State:
6.4% (100,950)
Number of households with income $10k - 20k:
Blackwell:
6.6% (160)
State:
8.8% (137,709)
Number of households with income $20k - 30k:
Blackwell:
12.4% (300)
Oklahoma:
9.1% (143,661)
Number of households with income $30k - 40k:
Blackwell:
14.4% (347)
Oklahoma:
9.0% (141,098)
Number of households with income $40k - 50k:
Blackwell:
15.6% (376)
Oklahoma:
8.9% (140,217)
Number of households with income $50k - 60k:
Blackwell:
8.9% (216)
Oklahoma:
8.1% (126,882)
Number of households with income $60k - 75k:
Blackwell:
13.9% (335)
State:
10.0% (157,916)
Number of households with income $75k - 100k:
Blackwell:
6.5% (158)
State:
12.4% (195,015)
Number of households with income $100k - 125k:
Blackwell:
9.6% (231)
Oklahoma:
9.0% (141,779)
Number of households with income $125k - 150k:
Blackwell:
0.6% (15)
State:
5.8% (91,594)
Number of households with income $150k - 200k:
Blackwell:
1.9% (46)
State:
6.3% (98,589)
Number of households with income > $200k:
Blackwell:
2.6% (63)
State:
6.2% (97,770)
Aggregate household income in Blackwell in 2022: $141,166,754
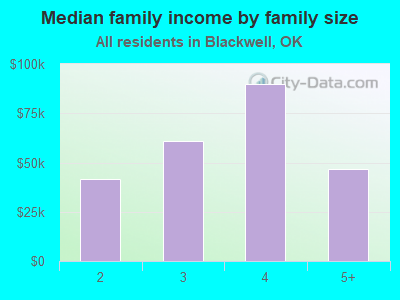
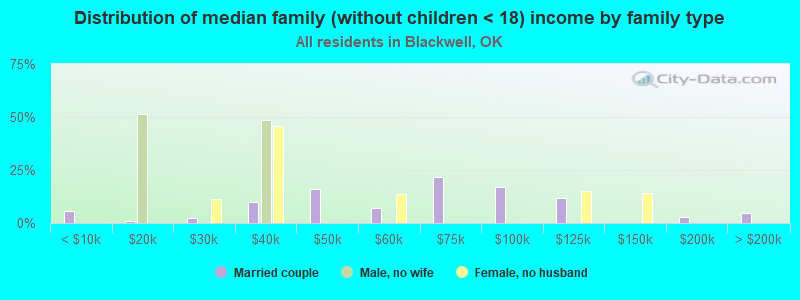
Median family income in Blackwell in 2022:
Blackwell:
$47,151
State:
$75,476
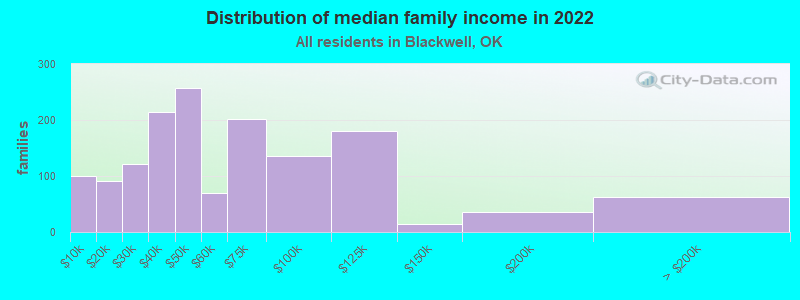
Number of families with income < $10k:
Blackwell:
6.7% (100)
Oklahoma:
4.2% (42,724)
Number of families with income $10k - 20k:
Blackwell:
6.2% (91)
Oklahoma:
4.9% (49,571)
Number of families with income $20k - 30k:
Blackwell:
8.2% (121)
State:
6.3% (64,367)
Number of families with income $30k - 40k:
Blackwell:
14.5% (215)
Oklahoma:
7.5% (76,467)
Number of families with income $40k - 50k:
Blackwell:
17.4% (258)
Oklahoma:
8.3% (84,578)
Number of families with income $50k - 60k:
Blackwell:
4.6% (69)
Oklahoma:
7.8% (79,642)
Number of families with income $60k - 75k:
Blackwell:
13.5% (201)
State:
10.6% (108,169)
Number of families with income $75k - 100k:
Blackwell:
9.2% (136)
Oklahoma:
14.6% (148,857)
Number of families with income $100k - 125k:
Blackwell:
12.1% (180)
State:
11.2% (113,480)
Number of families with income $125k - 150k:
Blackwell:
1.0% (15)
Oklahoma:
7.6% (77,253)
Number of families with income $150k - 200k:
Blackwell:
2.4% (36)
State:
8.4% (85,947)
Number of families with income > $200k:
Blackwell:
4.3% (63)
State:
8.5% (86,531)
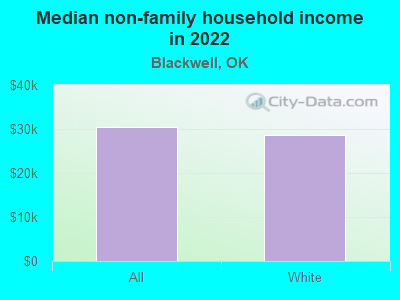
Median non-family income in Blackwell in 2022:
Blackwell:
$30,431
State:
$35,419
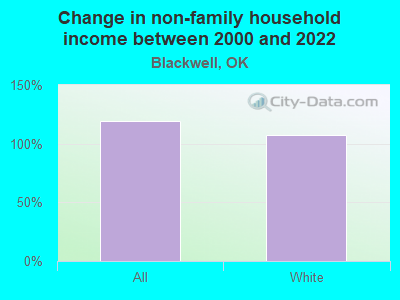
Change in median non-family income between 2000 and 2022:
Blackwell, Oklahoma:
+118.7%
State:
+83.2%
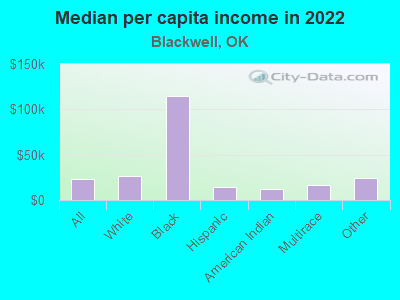
Median per capita income in Blackwell in 2022:
Blackwell:
$23,660
Oklahoma:
$32,930
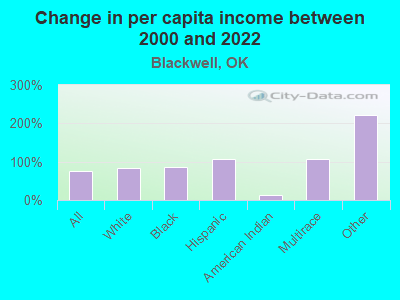
Change in median per capita income between 2000 and 2022:
Blackwell, Oklahoma:
+74.5%
State:
+86.6%
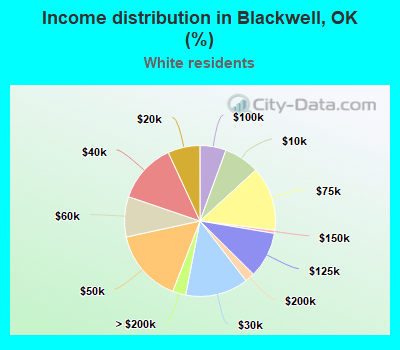
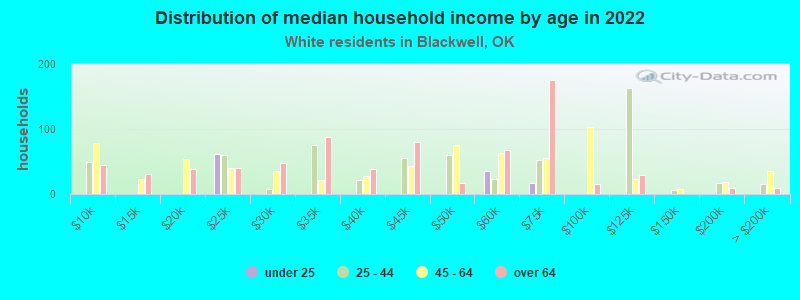
Income statistics for White residents
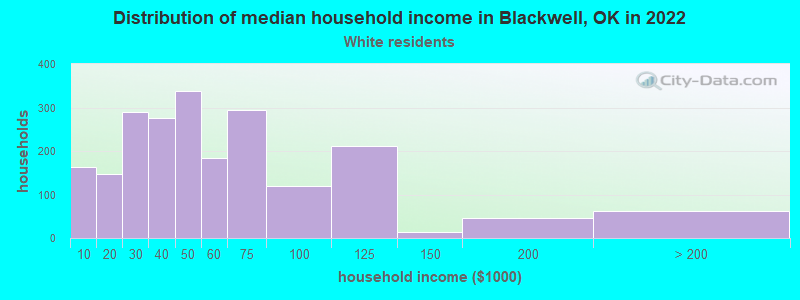
Median household income in Blackwell, OK in 2022:
Blackwell:
$45,687
State:
$63,444
Change in median household income between 2000 and 2022:
Blackwell, Oklahoma:
+75.0%
Oklahoma:
+79.3%
Number of households with income < $10k:
Blackwell:
7.6% (164)
State:
5.5% (60,994)
Number of households with income $10k - 20k:
Blackwell:
6.9% (148)
State:
8.2% (91,263)
Number of households with income $20k - 30k:
Blackwell:
13.5% (289)
Oklahoma:
8.7% (96,988)
Number of households with income $30k - 40k:
Blackwell:
12.9% (276)
Oklahoma:
8.4% (93,121)
Number of households with income $40k - 50k:
Blackwell:
15.7% (337)
State:
8.6% (95,446)
Number of households with income $50k - 60k:
Blackwell:
8.6% (185)
State:
7.9% (87,723)
Number of households with income $60k - 75k:
Blackwell:
13.8% (295)
State:
9.9% (109,955)
Number of households with income $75k - 100k:
Blackwell:
5.6% (120)
State:
12.9% (143,880)
Number of households with income $100k - 125k:
Blackwell:
9.8% (211)
State:
9.7% (107,851)
Number of households with income $125k - 150k:
Blackwell:
0.7% (14)
Oklahoma:
6.3% (69,802)
Number of households with income $150k - 200k:
Blackwell:
2.1% (45)
State:
6.9% (76,863)
Number of households with income > $200k:
Blackwell:
2.8% (61)
State:
7.0% (78,099)
Aggregate household income in Blackwell in 2022: $125,618,632
Median family income in Blackwell in 2022:
Blackwell:
$46,921
State:
$82,251
Number of families with income < $10k:
Blackwell:
6.2% (80)
State:
3.4% (24,057)
Number of families with income $10k - 20k:
Blackwell:
6.3% (81)
Oklahoma:
4.1% (29,440)
Number of families with income $20k - 30k:
Blackwell:
9.3% (121)
State:
5.7% (40,670)
Number of families with income $30k - 40k:
Blackwell:
12.7% (164)
Oklahoma:
6.5% (46,540)
Number of families with income $40k - 50k:
Blackwell:
19.1% (247)
State:
7.7% (55,082)
Number of families with income $50k - 60k:
Blackwell:
5.1% (66)
Oklahoma:
7.5% (53,408)
Number of families with income $60k - 75k:
Blackwell:
13.0% (168)
State:
10.4% (74,624)
Number of families with income $75k - 100k:
Blackwell:
7.5% (97)
State:
15.3% (109,679)
Number of families with income $100k - 125k:
Blackwell:
12.4% (160)
State:
12.0% (86,208)
Number of families with income $125k - 150k:
Blackwell:
1.1% (14)
Oklahoma:
8.3% (59,328)
Number of families with income $150k - 200k:
Blackwell:
2.7% (35)
State:
9.4% (67,640)
Number of families with income > $200k:
Blackwell:
4.7% (61)
State:
9.7% (69,551)
Median non-family income in Blackwell in 2022:
Blackwell:
$28,625
Oklahoma:
$36,941
Change in median non-family income between 2000 and 2022:
Blackwell, Oklahoma:
+106.6%
State:
+83.5%
Median per capita income in Blackwell in 2022:
Blackwell:
$26,056
Oklahoma:
$37,390
Change in median per capita income between 2000 and 2022:
Blackwell, Oklahoma:
+83.7%
State:
+92.4%
Income statistics for Black or African American residents
Median per capita income in Blackwell in 2022:
Blackwell:
$114,945
State:
$24,741
Change in median per capita income between 2000 and 2022:
Blackwell, Oklahoma:
+85.0%
State:
+98.7%
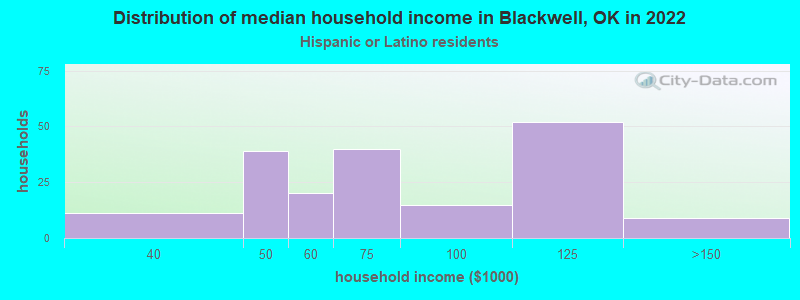
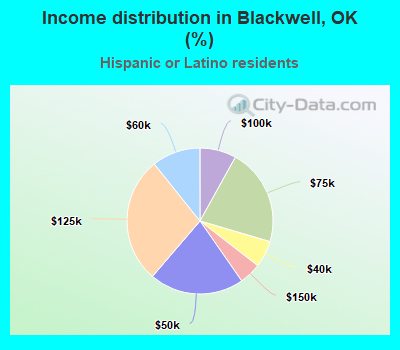
Income statistics for Hispanic or Latino residents
Median household income in Blackwell, OK in 2022:
Blackwell:
$64,017
State:
$52,856
Change in median household income between 2000 and 2022:
Blackwell, Oklahoma:
+146.4%
State:
+89.4%
Number of households with income < $10k:
Blackwell:
0.0% (0)
State:
6.0% (7,958)
Number of households with income $10k - 20k:
Blackwell:
0.0% (0)
Oklahoma:
8.4% (11,153)
Number of households with income $20k - 30k:
Blackwell:
0.0% (0)
Oklahoma:
9.7% (13,003)
Number of households with income $30k - 40k:
Blackwell:
5.9% (11)
Oklahoma:
11.7% (15,624)
Number of households with income $40k - 50k:
Blackwell:
21.0% (39)
Oklahoma:
11.0% (14,697)
Number of households with income $50k - 60k:
Blackwell:
10.8% (20)
Oklahoma:
9.6% (12,832)
Number of households with income $60k - 75k:
Blackwell:
21.5% (40)
State:
12.2% (16,321)
Number of households with income $75k - 100k:
Blackwell:
8.1% (15)
State:
12.5% (16,668)
Number of households with income $100k - 125k:
Blackwell:
28.0% (52)
Oklahoma:
7.5% (9,988)
Number of households with income $125k - 150k:
Blackwell:
4.8% (9)
State:
4.5% (6,042)
Number of households with income $150k - 200k:
Blackwell:
0.0% (0)
State:
3.8% (5,080)
Number of households with income > $200k:
Blackwell:
0.0% (0)
Oklahoma:
3.0% (4,063)
Aggregate household income in Blackwell in 2022: $13,995,159
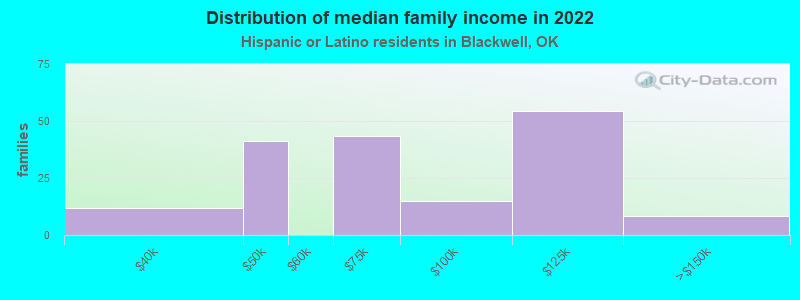
Median family income in Blackwell in 2022:
Blackwell:
$65,580
State:
$55,896
Number of families with income $30k - 40k:
Blackwell:
6.8% (12)
Oklahoma:
12.3% (12,391)
Number of families with income $40k - 50k:
Blackwell:
23.7% (41)
State:
11.7% (11,827)
Number of families with income $60k - 75k:
Blackwell:
24.9% (43)
State:
12.9% (13,025)
Number of families with income $75k - 100k:
Blackwell:
8.6% (15)
State:
13.1% (13,152)
Number of families with income $100k - 125k:
Blackwell:
31.2% (54)
State:
8.2% (8,262)
Number of families with income $125k - 150k:
Blackwell:
4.7% (8)
State:
4.6% (4,629)
Median per capita income in Blackwell in 2022:
Blackwell:
$14,399
Oklahoma:
$19,473
Change in median per capita income between 2000 and 2022:
Blackwell, Oklahoma:
+106.1%
State:
+97.3%
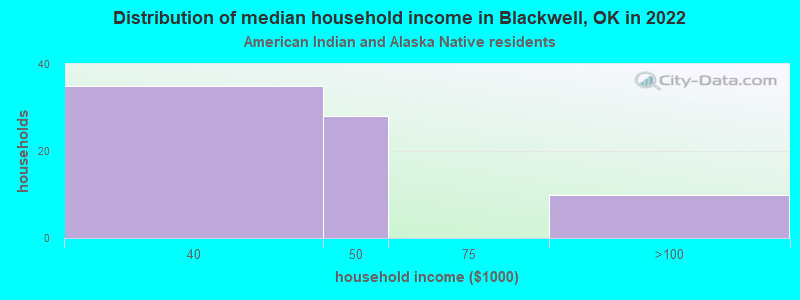
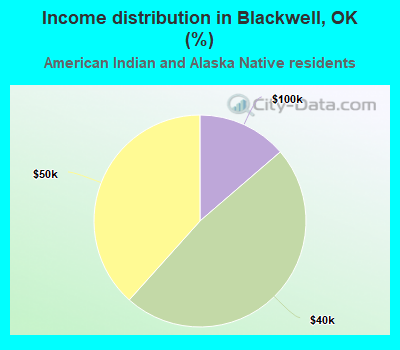
Income statistics for American Indian and Alaska Native residents
Median household income in Blackwell, OK in 2022:
Blackwell:
$41,049
State:
$53,261
Change in median household income between 2000 and 2022:
Blackwell, Oklahoma:
+87.7%
Oklahoma:
+94.7%
Number of households with income < $10k:
Blackwell:
0.0% (0)
Oklahoma:
8.0% (7,959)
Number of households with income $10k - 20k:
Blackwell:
0.0% (0)
State:
11.2% (11,175)
Number of households with income $20k - 30k:
Blackwell:
0.0% (0)
State:
9.7% (9,654)
Number of households with income $30k - 40k:
Blackwell:
47.9% (35)
State:
9.1% (9,092)
Number of households with income $40k - 50k:
Blackwell:
38.4% (28)
State:
9.1% (9,020)
Number of households with income $50k - 60k:
Blackwell:
0.0% (0)
State:
8.8% (8,714)
Number of households with income $60k - 75k:
Blackwell:
0.0% (0)
State:
10.7% (10,616)
Number of households with income $75k - 100k:
Blackwell:
13.7% (10)
Oklahoma:
11.5% (11,402)
Number of households with income $100k - 125k:
Blackwell:
0.0% (0)
State:
8.8% (8,769)
Number of households with income $125k - 150k:
Blackwell:
0.0% (0)
State:
5.0% (4,965)
Number of households with income $150k - 200k:
Blackwell:
0.0% (0)
State:
4.5% (4,512)
Number of households with income > $200k:
Blackwell:
0.0% (0)
State:
3.6% (3,569)
Aggregate household income in Blackwell in 2022: $3,348,021
Median per capita income in Blackwell in 2022:
Blackwell:
$12,315
State:
$25,549
Change in median per capita income between 2000 and 2022:
Blackwell, Oklahoma:
+14.5%
Oklahoma:
+118.7%
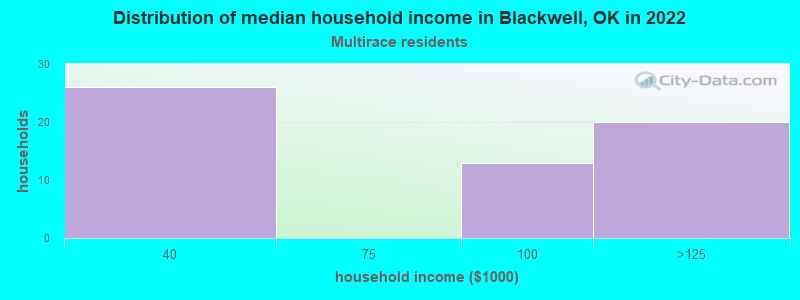
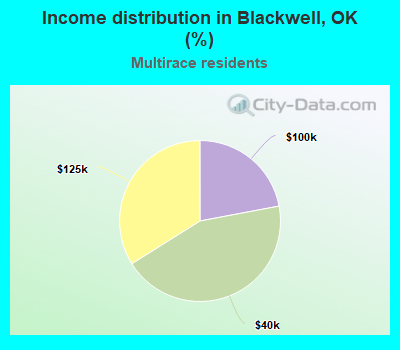
Income statistics for Multirace residents
Number of households with income < $10k:
Blackwell:
0.0% (0)
State:
6.8% (11,975)
Number of households with income $10k - 20k:
Blackwell:
0.0% (0)
State:
8.9% (15,797)
Number of households with income $20k - 30k:
Blackwell:
0.0% (0)
Oklahoma:
10.2% (18,071)
Number of households with income $30k - 40k:
Blackwell:
44.1% (26)
State:
11.0% (19,477)
Number of households with income $40k - 50k:
Blackwell:
0.0% (0)
State:
9.3% (16,501)
Number of households with income $50k - 60k:
Blackwell:
0.0% (0)
State:
8.9% (15,635)
Number of households with income $60k - 75k:
Blackwell:
0.0% (0)
Oklahoma:
10.9% (19,250)
Number of households with income $75k - 100k:
Blackwell:
22.0% (13)
State:
11.5% (20,279)
Number of households with income $100k - 125k:
Blackwell:
33.9% (20)
Oklahoma:
8.0% (14,067)
Number of households with income $125k - 150k:
Blackwell:
0.0% (0)
Oklahoma:
4.9% (8,612)
Number of households with income $150k - 200k:
Blackwell:
0.0% (0)
State:
5.0% (8,897)
Number of households with income > $200k:
Blackwell:
0.0% (0)
Oklahoma:
4.5% (7,970)
Aggregate household income in Blackwell in 2022: $4,641,660
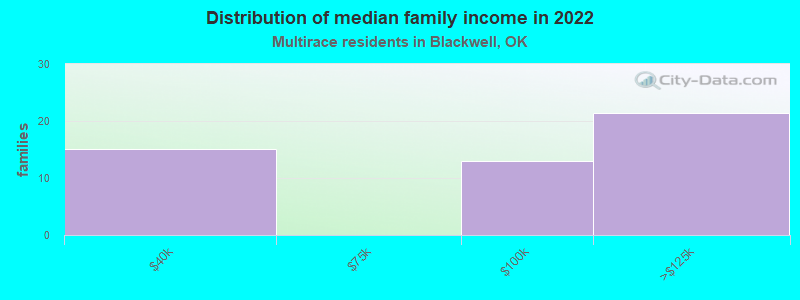
Median family income in Blackwell in 2022:
Blackwell:
$92,952
State:
$62,946
Number of families with income $30k - 40k:
Blackwell:
30.6% (15)
State:
10.8% (12,890)
Number of families with income $75k - 100k:
Blackwell:
26.3% (13)
State:
13.1% (15,759)
Number of families with income $100k - 125k:
Blackwell:
43.1% (21)
Oklahoma:
10.2% (12,250)
Median per capita income in Blackwell in 2022:
Blackwell:
$16,507
Oklahoma:
$23,085
Change in median per capita income between 2000 and 2022:
Blackwell, Oklahoma:
+107.9%
Oklahoma:
+93.8%
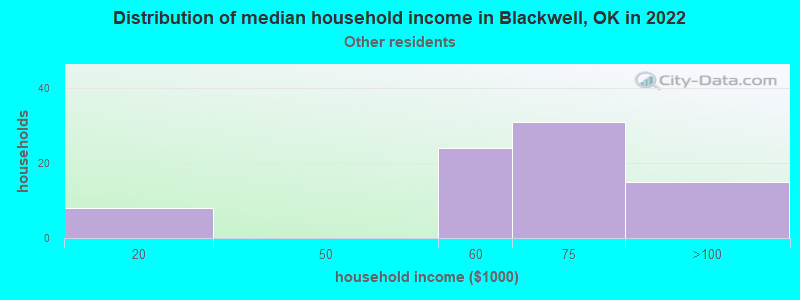
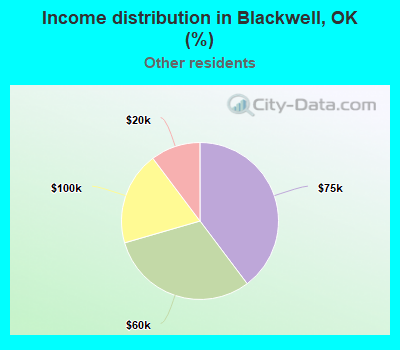
Income statistics for other residents
Median household income in Blackwell, OK in 2022:
Blackwell:
$63,793
Oklahoma:
$52,612
Number of households with income < $10k:
Blackwell:
0.0% (0)
State:
8.1% (3,420)
Number of households with income $10k - 20k:
Blackwell:
10.3% (8)
State:
8.6% (3,635)
Number of households with income $20k - 30k:
Blackwell:
0.0% (0)
State:
9.0% (3,808)
Number of households with income $30k - 40k:
Blackwell:
0.0% (0)
State:
11.4% (4,791)
Number of households with income $40k - 50k:
Blackwell:
0.0% (0)
State:
10.1% (4,256)
Number of households with income $50k - 60k:
Blackwell:
30.8% (24)
State:
11.7% (4,946)
Number of households with income $60k - 75k:
Blackwell:
39.7% (31)
State:
12.7% (5,342)
Number of households with income $75k - 100k:
Blackwell:
19.2% (15)
Oklahoma:
11.4% (4,792)
Number of households with income $100k - 125k:
Blackwell:
0.0% (0)
Oklahoma:
6.1% (2,568)
Number of households with income $125k - 150k:
Blackwell:
0.0% (0)
State:
5.4% (2,298)
Number of households with income $150k - 200k:
Blackwell:
0.0% (0)
State:
3.4% (1,427)
Number of households with income > $200k:
Blackwell:
0.0% (0)
State:
2.2% (918)
Aggregate household income in Blackwell in 2022: $4,568,770
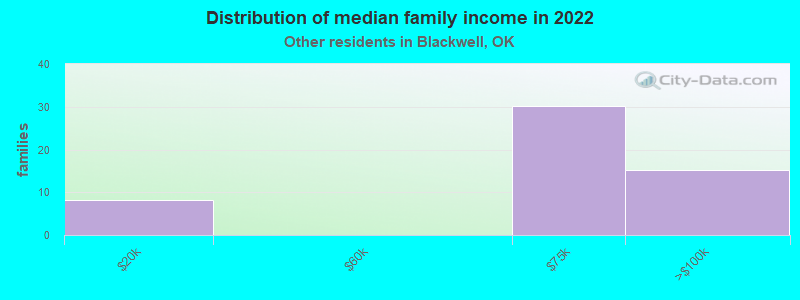
Median family income in Blackwell in 2022:
Blackwell:
$65,076
State:
$55,625
Number of families with income $10k - 20k:
Blackwell:
15.1% (8)
State:
6.8% (2,219)
Number of families with income $60k - 75k:
Blackwell:
56.4% (30)
State:
13.0% (4,231)
Number of families with income $75k - 100k:
Blackwell:
28.5% (15)
State:
11.5% (3,726)
Median per capita income in Blackwell in 2022:
Blackwell:
$24,634
State:
$21,007
Discuss Blackwell, Oklahoma (OK) on our hugely popular Oklahoma forum.