Bloomfield, Connecticut (CT) income map, earnings map, and wages data
The median household income in Bloomfield, CT in 2022 was $91,057, which was 2.9% greater than the median annual income of $88,429 across the entire state of Connecticut. Compared to the median income of $53,812 in 2000 this represents an increase of 40.9%. The per capita income in 2022 was $52,762, which means an increase of 45.3% compared to 2000 when it was $28,843.
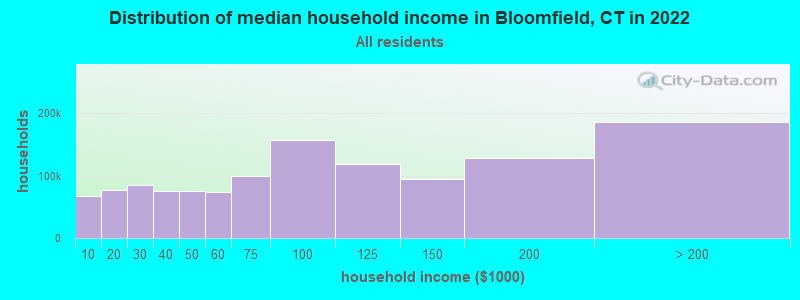
Income statistics for all residents
Median household income in Bloomfield, CT in 2022:| Bloomfield: | $91,057 |
| State: | $88,429 |
Change in median household income between 2000 and 2022:| Bloomfield, Connecticut: | +69.2% |
| State: | +64.0% |
Number of households with income < $10k:| Bloomfield: | 5.2% (37,089) |
| State: | 5.1% (72,746) |
Number of households with income $10k - 20k:| Bloomfield: | 5.8% (41,823) |
| State: | 5.7% (81,643) |
Number of households with income $20k - 30k:| Bloomfield: | 6.6% (47,341) |
| State: | 6.5% (92,844) |
Number of households with income $30k - 40k:| Bloomfield: | 5.9% (42,485) |
| State: | 5.9% (83,934) |
Number of households with income $40k - 50k:| Bloomfield: | 5.9% (42,213) |
| Connecticut: | 5.8% (83,025) |
Number of households with income $50k - 60k:| Bloomfield: | 5.8% (41,392) |
| Connecticut: | 5.7% (81,788) |
Number of households with income $60k - 75k:| Bloomfield: | 8.1% (57,996) |
| State: | 8.1% (115,651) |
Number of households with income $75k - 100k:| Bloomfield: | 12.6% (90,576) |
| State: | 12.6% (180,173) |
Number of households with income $100k - 125k:| Bloomfield: | 9.8% (70,513) |
| State: | 9.9% (141,231) |
Number of households with income $125k - 150k:| Bloomfield: | 7.8% (56,311) |
| State: | 7.9% (112,826) |
Number of households with income $150k - 200k:| Bloomfield: | 10.7% (77,029) |
| State: | 10.8% (154,641) |
Number of households with income > $200k:| Bloomfield: | 16.0% (115,076) |
| Connecticut: | 16.3% (233,133) |
Aggregate household income in Bloomfield in 2022: $23,544,822,768
Median family income in Bloomfield in 2022:| Bloomfield: | $115,897 |
| State: | $115,183 |
Median non-family income in Bloomfield in 2022:| Bloomfield: | $57,136 |
| State: | $50,964 |
Change in median non-family income between 2000 and 2022:| Bloomfield, Connecticut: | +71.5% |
| State: | +65.1% |
Median per capita income in Bloomfield in 2022:| Bloomfield: | $52,762 |
| State: | $51,581 |
Change in median per capita income between 2000 and 2022:| Bloomfield, Connecticut: | +82.9% |
| Connecticut: | +79.3% |
Income statistics for White residents
Median household income in Bloomfield, CT in 2022:| Bloomfield: | $91,013 |
| Connecticut: | $96,890 |
Change in median household income between 2000 and 2022:| Bloomfield, Connecticut: | +69.4% |
| Connecticut: | +68.5% |
Number of households with income < $10k:| Bloomfield: | 4.2% (19,906) |
| Connecticut: | 4.2% (42,265) |
Number of households with income $10k - 20k:| Bloomfield: | 4.9% (22,886) |
| State: | 4.8% (48,323) |
Number of households with income $20k - 30k:| Bloomfield: | 5.8% (27,218) |
| Connecticut: | 5.7% (57,716) |
Number of households with income $30k - 40k:| Bloomfield: | 5.4% (25,195) |
| State: | 5.3% (53,827) |
Number of households with income $40k - 50k:| Bloomfield: | 5.3% (25,090) |
| State: | 5.3% (53,301) |
Number of households with income $50k - 60k:| Bloomfield: | 5.6% (26,111) |
| Connecticut: | 5.5% (55,690) |
Number of households with income $60k - 75k:| Bloomfield: | 7.9% (37,314) |
| State: | 8.0% (80,329) |
Number of households with income $75k - 100k:| Bloomfield: | 12.7% (59,791) |
| State: | 12.7% (128,070) |
Number of households with income $100k - 125k:| Bloomfield: | 10.0% (46,950) |
| State: | 10.0% (101,210) |
Number of households with income $125k - 150k:| Bloomfield: | 8.0% (37,693) |
| State: | 8.0% (81,250) |
Number of households with income $150k - 200k:| Bloomfield: | 11.8% (55,424) |
| Connecticut: | 11.8% (119,527) |
Number of households with income > $200k:| Bloomfield: | 18.4% (86,764) |
| State: | 18.6% (187,875) |
Aggregate household income in Bloomfield in 2022: $9,535,032,965
Median family income in Bloomfield in 2022:| Bloomfield: | $132,117 |
| Connecticut: | $128,955 |
Number of families with income < $10k:| Bloomfield: | 3.5% (77) |
| Connecticut: | 1.9% (11,537) |
Number of families with income $10k - 20k:| Bloomfield: | 2.1% (47) |
| State: | 1.8% (11,289) |
Number of families with income $20k - 30k:| Bloomfield: | 2.0% (44) |
| State: | 3.0% (18,506) |
Number of families with income $30k - 40k:| Bloomfield: | 3.2% (73) |
| State: | 2.9% (18,160) |
Number of families with income $40k - 50k:| Bloomfield: | 2.9% (64) |
| State: | 3.9% (24,550) |
Number of families with income $50k - 60k:| Bloomfield: | 2.8% (64) |
| Connecticut: | 4.3% (26,723) |
Number of families with income $60k - 75k:| Bloomfield: | 4.8% (107) |
| State: | 7.1% (44,075) |
Number of families with income $75k - 100k:| Bloomfield: | 10.1% (225) |
| Connecticut: | 12.5% (77,679) |
Number of families with income $100k - 125k:| Bloomfield: | 8.5% (191) |
| State: | 11.1% (69,086) |
Number of families with income $125k - 150k:| Bloomfield: | 11.6% (261) |
| Connecticut: | 9.6% (59,616) |
Number of families with income $150k - 200k:| Bloomfield: | 17.8% (400) |
| Connecticut: | 15.7% (97,890) |
Number of families with income > $200k:| Bloomfield: | 30.7% (688) |
| State: | 26.3% (163,417) |
Median non-family income in Bloomfield in 2022:| Bloomfield: | $61,872 |
| Connecticut: | $54,067 |
Change in median non-family income between 2000 and 2022:| Bloomfield, Connecticut: | +73.7% |
| State: | +68.7% |
Median per capita income in Bloomfield in 2022:| Bloomfield: | $74,758 |
| State: | $59,916 |
Change in median per capita income between 2000 and 2022:| Bloomfield, Connecticut: | +92.1% |
| State: | +90.2% |
Income statistics for Black or African American residents
Median household income in Bloomfield, CT in 2022:| Bloomfield: | $88,409 |
| State: | $61,803 |
Change in median household income between 2000 and 2022:| Bloomfield, Connecticut: | +60.9% |
| State: | +76.1% |
Number of households with income < $10k:| Bloomfield: | 6.8% (14,860) |
| State: | 6.8% (9,494) |
Number of households with income $10k - 20k:| Bloomfield: | 7.9% (17,221) |
| Connecticut: | 7.9% (11,003) |
Number of households with income $20k - 30k:| Bloomfield: | 10.8% (23,548) |
| Connecticut: | 10.8% (15,045) |
Number of households with income $30k - 40k:| Bloomfield: | 8.2% (18,002) |
| State: | 8.2% (11,501) |
Number of households with income $40k - 50k:| Bloomfield: | 7.4% (16,303) |
| State: | 7.4% (10,416) |
Number of households with income $50k - 60k:| Bloomfield: | 7.5% (16,488) |
| Connecticut: | 7.5% (10,534) |
Number of households with income $60k - 75k:| Bloomfield: | 8.0% (17,599) |
| State: | 8.0% (11,244) |
Number of households with income $75k - 100k:| Bloomfield: | 9.6% (20,926) |
| State: | 9.6% (13,370) |
Number of households with income $100k - 125k:| Bloomfield: | 10.2% (22,294) |
| State: | 10.2% (14,244) |
Number of households with income $125k - 150k:| Bloomfield: | 8.0% (17,602) |
| State: | 8.0% (11,246) |
Number of households with income $150k - 200k:| Bloomfield: | 7.7% (16,790) |
| State: | 7.7% (10,727) |
Number of households with income > $200k:| Bloomfield: | 7.9% (17,352) |
| Connecticut: | 7.9% (11,086) |
Aggregate household income in Bloomfield in 2022: $1,181,937,531
Median family income in Bloomfield in 2022:| Bloomfield: | $138,729 |
| Connecticut: | $87,228 |
Number of families with income < $10k:| Bloomfield: | 0.3% (15) |
| State: | 3.8% (3,184) |
Number of families with income $10k - 20k:| Bloomfield: | 1.5% (69) |
| State: | 4.8% (4,026) |
Number of families with income $20k - 30k:| Bloomfield: | 2.3% (106) |
| State: | 6.0% (5,015) |
Number of families with income $30k - 40k:| Bloomfield: | 3.8% (174) |
| State: | 7.7% (6,445) |
Number of families with income $40k - 50k:| Bloomfield: | 4.8% (221) |
| State: | 6.6% (5,531) |
Number of families with income $50k - 60k:| Bloomfield: | 4.0% (183) |
| State: | 5.4% (4,480) |
Number of families with income $60k - 75k:| Bloomfield: | 7.8% (359) |
| Connecticut: | 8.2% (6,861) |
Number of families with income $75k - 100k:| Bloomfield: | 14.0% (639) |
| State: | 12.7% (10,598) |
Number of families with income $100k - 125k:| Bloomfield: | 13.7% (628) |
| Connecticut: | 11.4% (9,482) |
Number of families with income $125k - 150k:| Bloomfield: | 14.0% (641) |
| State: | 11.2% (9,356) |
Number of families with income $150k - 200k:| Bloomfield: | 24.8% (1,136) |
| State: | 11.4% (9,497) |
Number of families with income > $200k:| Bloomfield: | 8.9% (409) |
| Connecticut: | 10.8% (9,057) |
Median non-family income in Bloomfield in 2022:| Bloomfield: | $50,124 |
| Connecticut: | $38,608 |
Change in median non-family income between 2000 and 2022:| Bloomfield, Connecticut: | +77.0% |
| Connecticut: | +77.0% |
Median per capita income in Bloomfield in 2022:| Bloomfield: | $49,508 |
| State: | $36,289 |
Change in median per capita income between 2000 and 2022:| Bloomfield, Connecticut: | +115.2% |
| Connecticut: | +117.5% |
Income statistics for Asian residents
Median household income in Bloomfield, CT in 2022:| Bloomfield: | $42,894 |
| State: | $110,568 |
Change in median household income between 2000 and 2022:| Bloomfield, Connecticut: | +110.1% |
| Connecticut: | +79.5% |
Number of households with income < $10k:| Bloomfield: | 7.1% (1,407) |
| State: | 7.1% (4,245) |
Number of households with income $10k - 20k:| Bloomfield: | 3.5% (692) |
| Connecticut: | 3.5% (2,087) |
Number of households with income $20k - 30k:| Bloomfield: | 4.1% (817) |
| State: | 4.1% (2,464) |
Number of households with income $30k - 40k:| Bloomfield: | 4.1% (822) |
| State: | 4.1% (2,478) |
Number of households with income $40k - 50k:| Bloomfield: | 3.3% (657) |
| State: | 3.3% (1,983) |
Number of households with income $50k - 60k:| Bloomfield: | 3.9% (772) |
| State: | 3.9% (2,328) |
Number of households with income $60k - 75k:| Bloomfield: | 7.0% (1,402) |
| State: | 7.0% (4,228) |
Number of households with income $75k - 100k:| Bloomfield: | 11.5% (2,291) |
| Connecticut: | 11.5% (6,911) |
Number of households with income $100k - 125k:| Bloomfield: | 10.2% (2,031) |
| Connecticut: | 10.2% (6,127) |
Number of households with income $125k - 150k:| Bloomfield: | 8.5% (1,684) |
| State: | 8.5% (5,079) |
Number of households with income $150k - 200k:| Bloomfield: | 12.4% (2,464) |
| State: | 12.4% (7,434) |
Number of households with income > $200k:| Bloomfield: | 24.4% (4,860) |
| State: | 24.4% (14,661) |
Aggregate household income in Bloomfield in 2022: $21,265,031
Median family income in Bloomfield in 2022:| Bloomfield: | $45,026 |
| State: | $134,548 |
Number of families with income < $10k:| Bloomfield: | 13.0% (16) |
| State: | 4.3% (1,875) |
Number of families with income $10k - 20k:| Bloomfield: | 13.3% (16) |
| Connecticut: | 1.6% (700) |
Number of families with income $20k - 30k:| Bloomfield: | 4.4% (5) |
| Connecticut: | 3.8% (1,682) |
Number of families with income $30k - 40k:| Bloomfield: | 19.2% (24) |
| State: | 3.8% (1,652) |
Number of families with income $50k - 60k:| Bloomfield: | 3.5% (4) |
| Connecticut: | 3.7% (1,635) |
Number of families with income $150k - 200k:| Bloomfield: | 46.6% (57) |
| State: | 14.2% (6,237) |
Median non-family income in Bloomfield in 2022:| Bloomfield: | $47,853 |
| State: | $63,785 |
Change in median non-family income between 2000 and 2022:| Bloomfield, Connecticut: | +148.6% |
| Connecticut: | +77.9% |
Median per capita income in Bloomfield in 2022:| Bloomfield: | $25,414 |
| Connecticut: | $55,295 |
Change in median per capita income between 2000 and 2022:| Bloomfield, Connecticut: | +103.6% |
| Connecticut: | +97.8% |
Income statistics for Hispanic or Latino residents
Median household income in Bloomfield, CT in 2022:| Bloomfield: | $79,103 |
| Connecticut: | $60,275 |
Change in median household income between 2000 and 2022:| Bloomfield, Connecticut: | +67.8% |
| State: | +87.9% |
Number of households with income < $10k:| Bloomfield: | 8.7% (27,314) |
| State: | 8.7% (18,584) |
Number of households with income $10k - 20k:| Bloomfield: | 9.1% (28,271) |
| Connecticut: | 9.1% (19,235) |
Number of households with income $20k - 30k:| Bloomfield: | 8.9% (27,909) |
| State: | 8.9% (18,989) |
Number of households with income $30k - 40k:| Bloomfield: | 7.5% (23,468) |
| State: | 7.5% (15,967) |
Number of households with income $40k - 50k:| Bloomfield: | 8.7% (27,141) |
| State: | 8.7% (18,466) |
Number of households with income $50k - 60k:| Bloomfield: | 6.9% (21,614) |
| State: | 6.9% (14,706) |
Number of households with income $60k - 75k:| Bloomfield: | 8.9% (27,761) |
| Connecticut: | 8.9% (18,888) |
Number of households with income $75k - 100k:| Bloomfield: | 13.5% (42,137) |
| Connecticut: | 13.5% (28,669) |
Number of households with income $100k - 125k:| Bloomfield: | 8.2% (25,624) |
| State: | 8.2% (17,434) |
Number of households with income $125k - 150k:| Bloomfield: | 6.5% (20,212) |
| Connecticut: | 6.5% (13,752) |
Number of households with income $150k - 200k:| Bloomfield: | 6.6% (20,744) |
| Connecticut: | 6.6% (14,114) |
Number of households with income > $200k:| Bloomfield: | 6.4% (20,033) |
| Connecticut: | 6.4% (13,630) |
Aggregate household income in Bloomfield in 2022: $98,479,688
Median family income in Bloomfield in 2022:| Bloomfield: | $95,046 |
| State: | $68,336 |
Number of families with income < $10k:| Bloomfield: | 8.2% (36) |
| Connecticut: | 5.2% (7,456) |
Number of families with income $10k - 20k:| Bloomfield: | 7.8% (34) |
| State: | 6.0% (8,616) |
Number of families with income $20k - 30k:| Bloomfield: | 7.2% (32) |
| Connecticut: | 8.9% (12,680) |
Number of families with income $30k - 40k:| Bloomfield: | 9.2% (41) |
| State: | 8.5% (12,090) |
Number of families with income $40k - 50k:| Bloomfield: | 7.1% (31) |
| State: | 8.8% (12,624) |
Number of families with income $50k - 60k:| Bloomfield: | 6.7% (30) |
| Connecticut: | 8.4% (11,924) |
Number of families with income $60k - 75k:| Bloomfield: | 6.6% (29) |
| State: | 8.9% (12,677) |
Number of families with income $75k - 100k:| Bloomfield: | 13.1% (58) |
| State: | 14.3% (20,457) |
Number of families with income $100k - 125k:| Bloomfield: | 6.9% (31) |
| State: | 8.2% (11,720) |
Number of families with income $125k - 150k:| Bloomfield: | 10.4% (46) |
| State: | 8.2% (11,729) |
Number of families with income $150k - 200k:| Bloomfield: | 8.5% (38) |
| State: | 7.1% (10,096) |
Number of families with income > $200k:| Bloomfield: | 8.4% (37) |
| Connecticut: | 7.4% (10,622) |
Median non-family income in Bloomfield in 2022:| Bloomfield: | $45,645 |
| State: | $36,714 |
Change in median non-family income between 2000 and 2022:| Bloomfield, Connecticut: | +73.9% |
| State: | +90.0% |
Median per capita income in Bloomfield in 2022:| Bloomfield: | $31,964 |
| State: | $28,507 |
Change in median per capita income between 2000 and 2022:| Bloomfield, Connecticut: | +80.3% |
| Connecticut: | +117.2% |
Income statistics for American Indian and Alaska Native residents
Median household income in Bloomfield, CT in 2022:| Bloomfield: | $21,162 |
| State: | $41,848 |
Change in median household income between 2000 and 2022:| Bloomfield, Connecticut: | +12.9% |
| State: | +12.9% |
Number of households with income < $10k:| Bloomfield: | 8.4% (53,317) |
| Connecticut: | 10.2% (340) |
Number of households with income $10k - 20k:| Bloomfield: | 9.4% (59,500) |
| State: | 8.5% (283) |
Number of households with income $20k - 30k:| Bloomfield: | 8.5% (53,819) |
| State: | 9.4% (314) |
Number of households with income $30k - 40k:| Bloomfield: | 9.1% (57,660) |
| Connecticut: | 10.1% (337) |
Number of households with income $40k - 50k:| Bloomfield: | 8.3% (52,890) |
| Connecticut: | 13.4% (447) |
Number of households with income $50k - 60k:| Bloomfield: | 7.8% (49,871) |
| State: | 3.1% (104) |
Number of households with income $60k - 75k:| Bloomfield: | 9.8% (62,161) |
| State: | 5.6% (188) |
Number of households with income $75k - 100k:| Bloomfield: | 12.6% (80,240) |
| State: | 13.4% (447) |
Number of households with income $100k - 125k:| Bloomfield: | 9.4% (60,004) |
| State: | 9.5% (317) |
Number of households with income $125k - 150k:| Bloomfield: | 5.6% (35,924) |
| State: | 3.9% (131) |
Number of households with income $150k - 200k:| Bloomfield: | 6.0% (37,871) |
| Connecticut: | 6.3% (212) |
Number of households with income > $200k:| Bloomfield: | 5.2% (32,779) |
| State: | 6.8% (228) |
Aggregate household income in Bloomfield in 2022: $222,848
Median non-family income in Bloomfield in 2022:| Bloomfield: | $42,203 |
| State: | $40,310 |
Change in median non-family income between 2000 and 2022:| Bloomfield, Connecticut: | +125.1% |
| State: | +125.1% |
Median per capita income in Bloomfield in 2022:| Bloomfield: | $20,141 |
| State: | $25,355 |
Change in median per capita income between 2000 and 2022:| Bloomfield, Connecticut: | +45.9% |
| Connecticut: | +39.4% |
Income statistics for Multirace residents
Median household income in Bloomfield, CT in 2022:| Bloomfield: | $84,251 |
| State: | $77,277 |
Change in median household income between 2000 and 2022:| Bloomfield, Connecticut: | +119.4% |
| Connecticut: | +113.6% |
Number of households with income < $10k:| Bloomfield: | 6.0% (7,912) |
| State: | 6.0% (7,457) |
Number of households with income $10k - 20k:| Bloomfield: | 8.1% (10,757) |
| Connecticut: | 8.1% (10,139) |
Number of households with income $20k - 30k:| Bloomfield: | 7.0% (9,233) |
| State: | 7.0% (8,702) |
Number of households with income $30k - 40k:| Bloomfield: | 6.9% (9,068) |
| State: | 6.9% (8,546) |
Number of households with income $40k - 50k:| Bloomfield: | 7.0% (9,244) |
| State: | 7.0% (8,712) |
Number of households with income $50k - 60k:| Bloomfield: | 5.9% (7,778) |
| Connecticut: | 5.9% (7,331) |
Number of households with income $60k - 75k:| Bloomfield: | 8.5% (11,283) |
| State: | 8.5% (10,634) |
Number of households with income $75k - 100k:| Bloomfield: | 14.1% (18,673) |
| State: | 14.1% (17,600) |
Number of households with income $100k - 125k:| Bloomfield: | 9.9% (13,138) |
| Connecticut: | 9.9% (12,383) |
Number of households with income $125k - 150k:| Bloomfield: | 7.2% (9,465) |
| State: | 7.2% (8,921) |
Number of households with income $150k - 200k:| Bloomfield: | 8.8% (11,588) |
| Connecticut: | 8.8% (10,922) |
Number of households with income > $200k:| Bloomfield: | 10.6% (14,055) |
| State: | 10.6% (13,247) |
Aggregate household income in Bloomfield in 2022: $150,132,043
Median family income in Bloomfield in 2022:| Bloomfield: | $88,323 |
| State: | $84,255 |
Number of families with income < $10k:| Bloomfield: | 3.1% (27) |
| State: | 3.6% (3,027) |
Number of families with income $10k - 20k:| Bloomfield: | 4.6% (40) |
| State: | 4.8% (4,079) |
Number of families with income $20k - 30k:| Bloomfield: | 7.5% (64) |
| State: | 6.9% (5,812) |
Number of families with income $30k - 40k:| Bloomfield: | 1.6% (14) |
| State: | 6.8% (5,759) |
Number of families with income $40k - 50k:| Bloomfield: | 3.5% (30) |
| Connecticut: | 6.9% (5,792) |
Number of families with income $50k - 60k:| Bloomfield: | 7.5% (64) |
| Connecticut: | 7.6% (6,420) |
Number of families with income $60k - 75k:| Bloomfield: | 8.0% (69) |
| Connecticut: | 7.8% (6,550) |
Number of families with income $75k - 100k:| Bloomfield: | 4.4% (38) |
| Connecticut: | 14.5% (12,236) |
Number of families with income $100k - 125k:| Bloomfield: | 30.3% (260) |
| Connecticut: | 9.2% (7,787) |
Number of families with income > $200k:| Bloomfield: | 29.5% (253) |
| State: | 13.7% (11,603) |
Median non-family income in Bloomfield in 2022:| Bloomfield: | $56,570 |
| State: | $44,462 |
Change in median non-family income between 2000 and 2022:| Bloomfield, Connecticut: | +81.0% |
| Connecticut: | +97.6% |
Median per capita income in Bloomfield in 2022:| Bloomfield: | $31,391 |
| State: | $32,794 |
Change in median per capita income between 2000 and 2022:| Bloomfield, Connecticut: | +95.5% |
| State: | +117.2% |
Income statistics for other residents
Number of households with income < $10k:| Bloomfield: | 9.1% (44) |
| Connecticut: | 9.0% (8,596) |
Number of households with income $10k - 20k:| Bloomfield: | 10.1% (49) |
| State: | 10.2% (9,773) |
Number of households with income $20k - 30k:| Bloomfield: | 9.1% (44) |
| Connecticut: | 9.1% (8,691) |
Number of households with income $30k - 40k:| Bloomfield: | 7.8% (38) |
| State: | 7.8% (7,447) |
Number of households with income $40k - 50k:| Bloomfield: | 8.2% (40) |
| State: | 8.2% (7,860) |
Number of households with income $50k - 60k:| Bloomfield: | 6.0% (29) |
| State: | 6.0% (5,757) |
Number of households with income $60k - 75k:| Bloomfield: | 9.3% (45) |
| State: | 9.3% (8,942) |
Number of households with income $75k - 100k:| Bloomfield: | 14.2% (69) |
| State: | 14.3% (13,700) |
Number of households with income $100k - 125k:| Bloomfield: | 7.2% (35) |
| Connecticut: | 7.2% (6,906) |
Number of households with income $125k - 150k:| Bloomfield: | 6.4% (31) |
| State: | 6.5% (6,215) |
Number of households with income $150k - 200k:| Bloomfield: | 6.2% (30) |
| State: | 6.1% (5,865) |
Number of households with income > $200k:| Bloomfield: | 6.4% (31) |
| Connecticut: | 6.3% (6,065) |
Aggregate household income in Bloomfield in 2022: $68,075,951
Median family income in Bloomfield in 2022:| Bloomfield: | $131,952 |
| Connecticut: | $67,610 |
Number of families with income $10k - 20k:| Bloomfield: | 1.1% (5) |
| State: | 7.5% (4,961) |
Number of families with income $20k - 30k:| Bloomfield: | 3.1% (15) |
| State: | 8.7% (5,752) |
Number of families with income $30k - 40k:| Bloomfield: | 2.5% (13) |
| State: | 9.1% (5,996) |
Number of families with income $40k - 50k:| Bloomfield: | 8.4% (42) |
| State: | 9.1% (6,039) |
Number of families with income $50k - 60k:| Bloomfield: | 8.3% (41) |
| State: | 5.9% (3,868) |
Number of families with income $60k - 75k:| Bloomfield: | 9.1% (45) |
| State: | 9.4% (6,232) |
Number of families with income $75k - 100k:| Bloomfield: | 22.4% (112) |
| Connecticut: | 15.7% (10,362) |
Number of families with income $150k - 200k:| Bloomfield: | 45.1% (224) |
| State: | 6.6% (4,339) |
Median non-family income in Bloomfield in 2022:| Bloomfield: | $48,205 |
| State: | $34,285 |
Change in median non-family income between 2000 and 2022:| Bloomfield, Connecticut: | +83.6% |
| State: | +83.6% |
Median per capita income in Bloomfield in 2022:| Bloomfield: | $45,231 |
| State: | $29,353 |