Brasher, New York (NY) income map, earnings map, and wages data
The median household income in Brasher, NY in 2022 was $57,013, which was 39.5% less than the median annual income of $79,557 across the entire state of New York. Compared to the median income of $30,909 in 2000 this represents an increase of 45.8%. The per capita income in 2022 was $30,877, which means an increase of 45.6% compared to 2000 when it was $16,808.
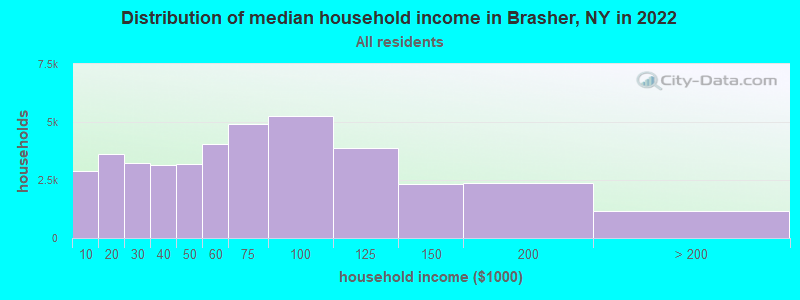
Income statistics for all residents
Median household income in Brasher, NY in 2022:| Brasher: | $57,014 |
| State: | $79,557 |
Change in median household income between 2000 and 2022:| Brasher, New York: | +84.5% |
| State: | +83.3% |
Number of households with income < $10k:| Brasher: | 7.2% (2,880) |
| State: | 6.8% (527,598) |
Number of households with income $10k - 20k:| Brasher: | 9.1% (3,624) |
| State: | 7.4% (574,940) |
Number of households with income $20k - 30k:| Brasher: | 8.1% (3,246) |
| State: | 6.7% (517,718) |
Number of households with income $30k - 40k:| Brasher: | 7.8% (3,141) |
| New York: | 6.5% (506,674) |
Number of households with income $40k - 50k:| Brasher: | 8.0% (3,195) |
| New York: | 6.1% (470,439) |
Number of households with income $50k - 60k:| Brasher: | 10.1% (4,031) |
| State: | 5.8% (454,042) |
Number of households with income $60k - 75k:| Brasher: | 12.3% (4,929) |
| State: | 8.5% (657,508) |
Number of households with income $75k - 100k:| Brasher: | 13.1% (5,260) |
| State: | 11.6% (899,824) |
Number of households with income $100k - 125k:| Brasher: | 9.7% (3,882) |
| State: | 9.3% (723,825) |
Number of households with income $125k - 150k:| Brasher: | 5.8% (2,331) |
| State: | 7.1% (552,420) |
Number of households with income $150k - 200k:| Brasher: | 5.9% (2,366) |
| New York: | 9.4% (727,051) |
Number of households with income > $200k:| Brasher: | 2.9% (1,145) |
| State: | 15.0% (1,162,269) |
Aggregate household income in Brasher in 2022: $73,132,488
Median family income in Brasher in 2022:| Brasher: | $69,457 |
| State: | $99,066 |
Median non-family income in Brasher in 2022:| Brasher: | $28,330 |
| State: | $50,181 |
Change in median non-family income between 2000 and 2022:| Brasher, New York: | +88.9% |
| State: | +85.4% |
Median per capita income in Brasher in 2022:| Brasher: | $30,877 |
| State: | $47,421 |
Change in median per capita income between 2000 and 2022:| Brasher, New York: | +83.7% |
| New York: | +102.7% |
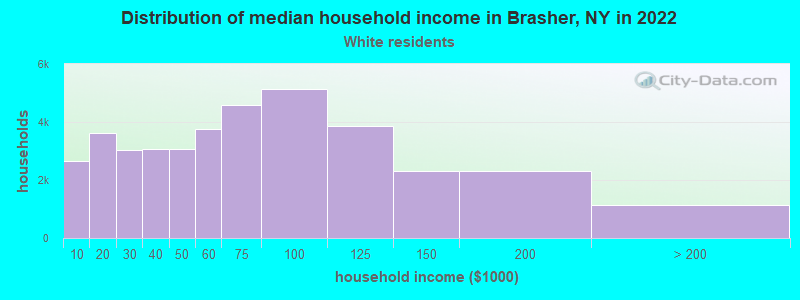
Income statistics for White residents
Median household income in Brasher, NY in 2022:| Brasher: | $57,643 |
| New York: | $89,408 |
Change in median household income between 2000 and 2022:| Brasher, New York: | +84.6% |
| New York: | +85.5% |
Number of households with income < $10k:| Brasher: | 6.9% (2,656) |
| New York: | 4.8% (225,550) |
Number of households with income $10k - 20k:| Brasher: | 9.4% (3,624) |
| State: | 6.1% (289,425) |
Number of households with income $20k - 30k:| Brasher: | 7.9% (3,047) |
| New York: | 5.9% (280,254) |
Number of households with income $30k - 40k:| Brasher: | 8.0% (3,084) |
| State: | 6.1% (288,263) |
Number of households with income $40k - 50k:| Brasher: | 7.9% (3,059) |
| New York: | 5.9% (278,079) |
Number of households with income $50k - 60k:| Brasher: | 9.7% (3,751) |
| State: | 5.7% (267,554) |
Number of households with income $60k - 75k:| Brasher: | 11.9% (4,579) |
| State: | 8.4% (398,344) |
Number of households with income $75k - 100k:| Brasher: | 13.3% (5,132) |
| New York: | 11.8% (554,841) |
Number of households with income $100k - 125k:| Brasher: | 10.0% (3,874) |
| State: | 10.0% (469,794) |
Number of households with income $125k - 150k:| Brasher: | 6.0% (2,301) |
| State: | 7.6% (360,467) |
Number of households with income $150k - 200k:| Brasher: | 6.0% (2,294) |
| State: | 10.1% (477,078) |
Number of households with income > $200k:| Brasher: | 3.0% (1,149) |
| New York: | 17.6% (829,233) |
Aggregate household income in Brasher in 2022: $71,672,553
Median family income in Brasher in 2022:| Brasher: | $69,827 |
| State: | $115,170 |
Number of families with income < $10k:| Brasher: | 3.9% (23) |
| New York: | 2.5% (68,851) |
Number of families with income $10k - 20k:| Brasher: | 6.5% (38) |
| New York: | 3.0% (83,127) |
Number of families with income $20k - 30k:| Brasher: | 7.0% (41) |
| New York: | 3.5% (97,578) |
Number of families with income $30k - 40k:| Brasher: | 5.5% (32) |
| State: | 4.1% (114,108) |
Number of families with income $40k - 50k:| Brasher: | 7.4% (43) |
| New York: | 4.7% (130,902) |
Number of families with income $50k - 60k:| Brasher: | 7.8% (46) |
| New York: | 4.9% (135,118) |
Number of families with income $60k - 75k:| Brasher: | 12.3% (72) |
| State: | 7.8% (216,254) |
Number of families with income $75k - 100k:| Brasher: | 11.3% (66) |
| New York: | 12.4% (342,382) |
Number of families with income $100k - 125k:| Brasher: | 15.0% (88) |
| State: | 11.4% (314,917) |
Number of families with income $125k - 150k:| Brasher: | 11.3% (66) |
| State: | 9.4% (260,489) |
Number of families with income $150k - 200k:| Brasher: | 6.0% (35) |
| State: | 13.2% (365,586) |
Number of families with income > $200k:| Brasher: | 6.0% (35) |
| State: | 23.2% (642,319) |
Median non-family income in Brasher in 2022:| Brasher: | $27,819 |
| New York: | $54,783 |
Change in median non-family income between 2000 and 2022:| Brasher, New York: | +88.4% |
| New York: | +87.9% |
Median per capita income in Brasher in 2022:| Brasher: | $32,415 |
| State: | $57,640 |
Change in median per capita income between 2000 and 2022:| Brasher, New York: | +89.2% |
| State: | +111.6% |
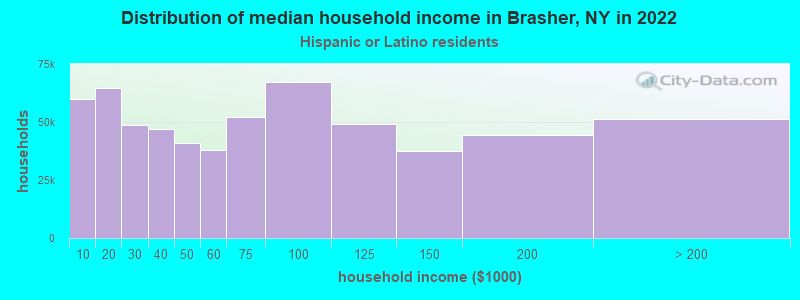
Income statistics for Hispanic or Latino residents
Median household income in Brasher, NY in 2022:| Brasher: | $59,432 |
| New York: | $60,468 |
Change in median household income between 2000 and 2022:| Brasher, New York: | +106.7% |
| New York: | +98.3% |
Number of households with income < $10k:| Brasher: | 10.0% (59,907) |
| State: | 9.9% (127,185) |
Number of households with income $10k - 20k:| Brasher: | 10.7% (64,487) |
| State: | 10.7% (136,699) |
Number of households with income $20k - 30k:| Brasher: | 8.1% (48,559) |
| State: | 8.1% (102,991) |
Number of households with income $30k - 40k:| Brasher: | 7.8% (47,035) |
| State: | 7.8% (100,149) |
Number of households with income $40k - 50k:| Brasher: | 6.8% (41,151) |
| New York: | 6.9% (87,760) |
Number of households with income $50k - 60k:| Brasher: | 6.3% (38,107) |
| State: | 6.3% (80,968) |
Number of households with income $60k - 75k:| Brasher: | 8.6% (51,941) |
| State: | 8.7% (110,631) |
Number of households with income $75k - 100k:| Brasher: | 11.2% (67,044) |
| New York: | 11.2% (142,787) |
Number of households with income $100k - 125k:| Brasher: | 8.2% (49,129) |
| State: | 8.2% (104,850) |
Number of households with income $125k - 150k:| Brasher: | 6.3% (37,695) |
| State: | 6.3% (80,274) |
Number of households with income $150k - 200k:| Brasher: | 7.4% (44,561) |
| New York: | 7.4% (95,117) |
Number of households with income > $200k:| Brasher: | 8.6% (51,392) |
| State: | 8.6% (109,514) |
Aggregate household income in Brasher in 2022: $292,445
Median non-family income in Brasher in 2022:| Brasher: | $50,224 |
| State: | $34,000 |
Change in median non-family income between 2000 and 2022:| Brasher, New York: | +74.7% |
| State: | +93.9% |
Median per capita income in Brasher in 2022:| Brasher: | $14,642 |
| State: | $29,761 |
Change in median per capita income between 2000 and 2022:| Brasher, New York: | +12.0% |
| State: | +132.7% |
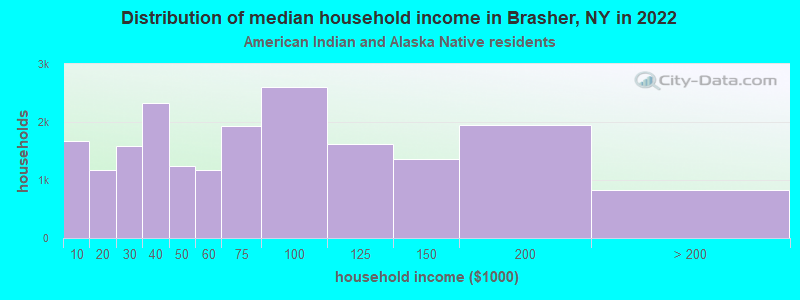
Income statistics for American Indian and Alaska Native residents
Median household income in Brasher, NY in 2022:| Brasher: | $2,721 |
| New York: | $63,208 |
Number of households with income < $10k:| Brasher: | 8.6% (1,679) |
| State: | 8.6% (3,559) |
Number of households with income $10k - 20k:| Brasher: | 6.0% (1,166) |
| State: | 5.9% (2,455) |
Number of households with income $20k - 30k:| Brasher: | 8.2% (1,594) |
| State: | 8.2% (3,393) |
Number of households with income $30k - 40k:| Brasher: | 11.9% (2,321) |
| New York: | 11.9% (4,918) |
Number of households with income $40k - 50k:| Brasher: | 6.4% (1,247) |
| State: | 6.5% (2,682) |
Number of households with income $50k - 60k:| Brasher: | 6.0% (1,174) |
| State: | 6.1% (2,516) |
Number of households with income $60k - 75k:| Brasher: | 9.9% (1,929) |
| New York: | 10.0% (4,125) |
Number of households with income $75k - 100k:| Brasher: | 13.4% (2,609) |
| State: | 13.3% (5,517) |
Number of households with income $100k - 125k:| Brasher: | 8.4% (1,628) |
| New York: | 8.4% (3,463) |
Number of households with income $125k - 150k:| Brasher: | 7.0% (1,369) |
| State: | 7.0% (2,887) |
Number of households with income $150k - 200k:| Brasher: | 10.0% (1,951) |
| State: | 9.9% (4,106) |
Number of households with income > $200k:| Brasher: | 4.2% (824) |
| New York: | 4.2% (1,744) |
Aggregate household income in Brasher in 2022: $827,431
Median family income in Brasher in 2022:| Brasher: | $2,482 |
| New York: | $69,721 |
Number of families with income < $10k:| Brasher: | 13.8% (2) |
| State: | 8.3% (2,415) |
Number of families with income $20k - 30k:| Brasher: | 35.9% (5) |
| State: | 6.2% (1,790) |
Number of families with income $40k - 50k:| Brasher: | 50.3% (6) |
| State: | 8.7% (2,524) |
Median per capita income in Brasher in 2022:| Brasher: | $9,816 |
| New York: | $25,837 |
Change in median per capita income between 2000 and 2022:| Brasher, New York: | +24.0% |
| State: | +99.6% |
Income statistics for other residents
Number of households with income < $10k:| Brasher: | 10.0% (3) |
| State: | 10.3% (69,252) |
Number of households with income $10k - 20k:| Brasher: | 10.0% (3) |
| State: | 11.0% (73,890) |
Number of households with income $20k - 30k:| Brasher: | 6.7% (2) |
| New York: | 8.8% (59,096) |
Number of households with income $30k - 40k:| Brasher: | 6.7% (2) |
| State: | 8.1% (54,418) |
Number of households with income $40k - 50k:| Brasher: | 6.7% (2) |
| State: | 7.3% (49,042) |
Number of households with income $50k - 60k:| Brasher: | 6.7% (2) |
| New York: | 6.5% (43,945) |
Number of households with income $60k - 75k:| Brasher: | 10.0% (3) |
| State: | 9.5% (64,087) |
Number of households with income $75k - 100k:| Brasher: | 10.0% (3) |
| State: | 10.9% (73,094) |
Number of households with income $100k - 125k:| Brasher: | 10.0% (3) |
| State: | 7.9% (53,055) |
Number of households with income $125k - 150k:| Brasher: | 6.7% (2) |
| State: | 5.9% (39,446) |
Number of households with income $150k - 200k:| Brasher: | 10.0% (3) |
| New York: | 7.2% (48,653) |
Number of households with income > $200k:| Brasher: | 6.7% (2) |
| State: | 6.6% (44,703) |
Aggregate household income in Brasher in 2022: $2,437,099
Median non-family income in Brasher in 2022:| Brasher: | $50,969 |
| New York: | $26,983 |
Change in median non-family income between 2000 and 2022:| Brasher, New York: | +77.3% |
| State: | +66.4% |
Median per capita income in Brasher in 2022:| Brasher: | $23,580 |
| State: | $26,975 |
Change in median per capita income between 2000 and 2022:| Brasher, New York: | +24.8% |
| New York: | +144.6% |