The median household income in Brownwood, TX in 2022 was $44,945, which was 60.8% less than the median annual income of $72,284 across the entire state of Texas. Compared to the median income of $27,325 in 2000 this represents an increase of 39.2%. The per capita income in 2022 was $26,326, which means an increase of 46.2% compared to 2000 when it was $14,158.
Whole page based on the data from 2000 / 2022 when the population of Brownwood, Texas was 18,813 / 19,326
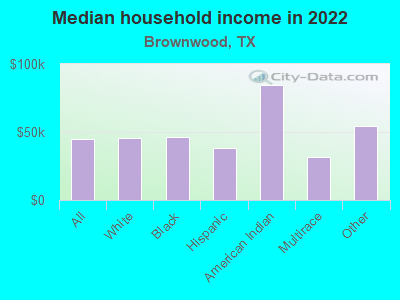
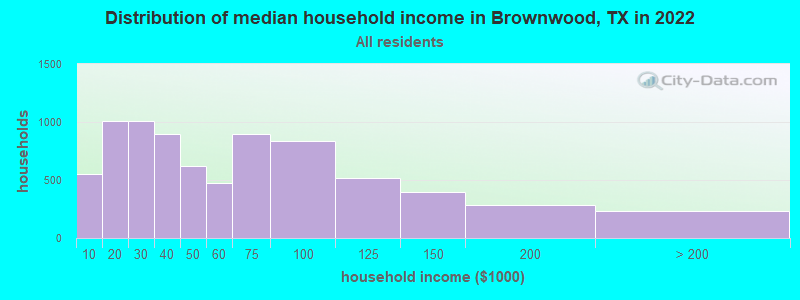
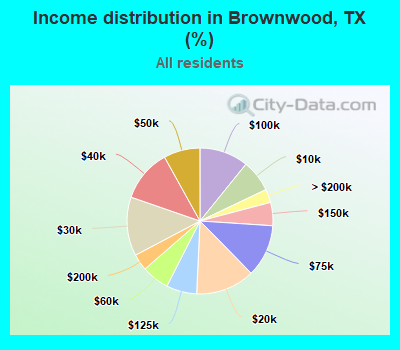
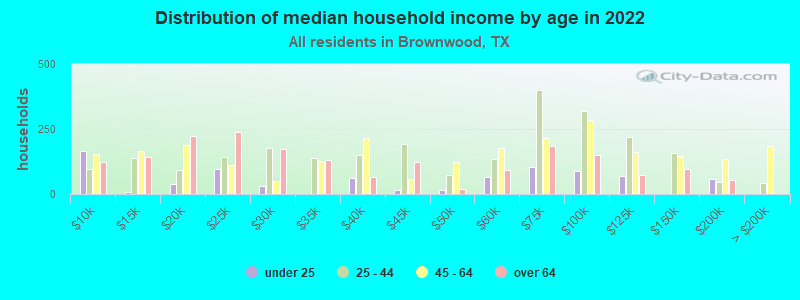
Income statistics for all residents
Median household income in Brownwood, TX in 2022:
Brownwood:
$44,945
State:
$72,284
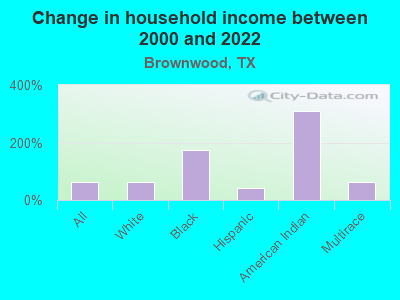
Change in median household income between 2000 and 2022:
Brownwood, Texas:
+64.5%
State:
+81.0%
Number of households with income < $10k:
Brownwood:
7.1% (548)
State:
5.5% (611,011)
Number of households with income $10k - 20k:
Brownwood:
13.1% (1,009)
State:
6.7% (743,157)
Number of households with income $20k - 30k:
Brownwood:
13.1% (1,008)
Texas:
7.2% (803,381)
Number of households with income $30k - 40k:
Brownwood:
11.6% (898)
Texas:
7.8% (866,080)
Number of households with income $40k - 50k:
Brownwood:
8.1% (623)
State:
7.3% (810,440)
Number of households with income $50k - 60k:
Brownwood:
6.1% (473)
Texas:
7.2% (799,783)
Number of households with income $60k - 75k:
Brownwood:
11.6% (897)
Texas:
9.9% (1,095,384)
Number of households with income $75k - 100k:
Brownwood:
10.8% (837)
Texas:
12.8% (1,419,057)
Number of households with income $100k - 125k:
Brownwood:
6.7% (521)
State:
9.5% (1,054,577)
Number of households with income $125k - 150k:
Brownwood:
5.1% (397)
Texas:
6.7% (741,518)
Number of households with income $150k - 200k:
Brownwood:
3.7% (282)
State:
8.7% (961,776)
Number of households with income > $200k:
Brownwood:
3.0% (230)
State:
10.7% (1,181,544)
Aggregate household income in Brownwood in 2022: $480,846,138
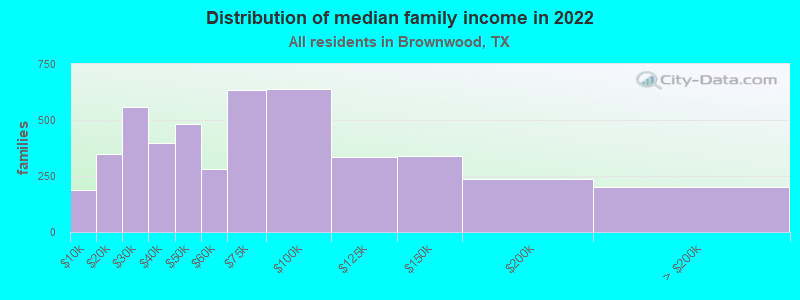
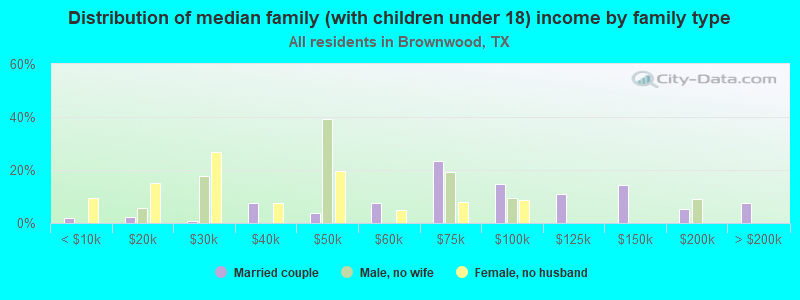
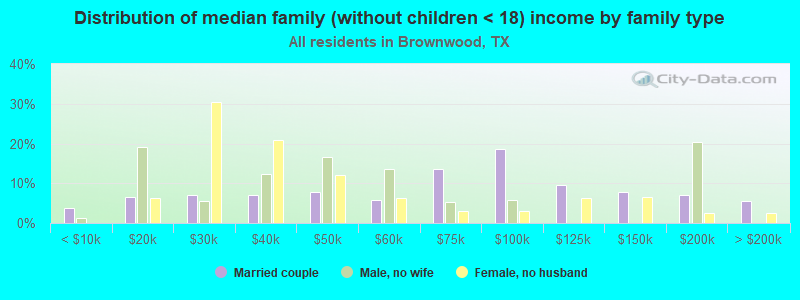
Median family income in Brownwood in 2022:
Brownwood:
$60,862
Texas:
$86,267
Number of families with income < $10k:
Brownwood:
4.1% (188)
Texas:
4.0% (297,884)
Number of families with income $10k - 20k:
Brownwood:
7.5% (346)
State:
4.3% (324,514)
Number of families with income $20k - 30k:
Brownwood:
12.0% (557)
Texas:
5.8% (430,949)
Number of families with income $30k - 40k:
Brownwood:
8.6% (399)
State:
6.6% (493,535)
Number of families with income $40k - 50k:
Brownwood:
10.4% (482)
State:
6.7% (499,663)
Number of families with income $50k - 60k:
Brownwood:
6.1% (282)
State:
6.6% (492,203)
Number of families with income $60k - 75k:
Brownwood:
13.7% (634)
State:
9.5% (710,229)
Number of families with income $75k - 100k:
Brownwood:
13.8% (639)
State:
13.6% (1,015,480)
Number of families with income $100k - 125k:
Brownwood:
7.2% (334)
State:
10.7% (797,961)
Number of families with income $125k - 150k:
Brownwood:
7.3% (339)
Texas:
8.1% (602,985)
Number of families with income $150k - 200k:
Brownwood:
5.1% (235)
State:
10.7% (804,459)
Number of families with income > $200k:
Brownwood:
4.3% (201)
Texas:
13.5% (1,013,514)
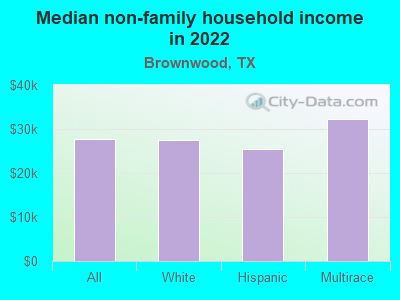
Median non-family income in Brownwood in 2022:
Brownwood:
$27,700
Texas:
$45,999
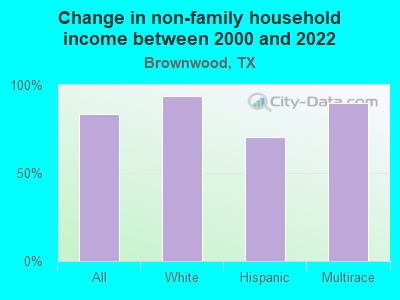
Change in median non-family income between 2000 and 2022:
Brownwood, Texas:
+83.3%
Texas:
+79.5%
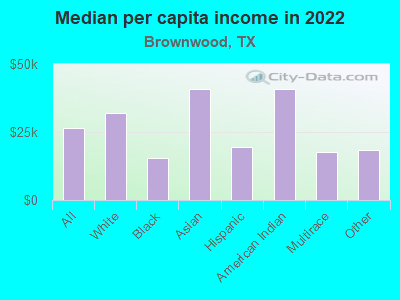
Median per capita income in Brownwood in 2022:
Brownwood:
$26,327
State:
$38,123
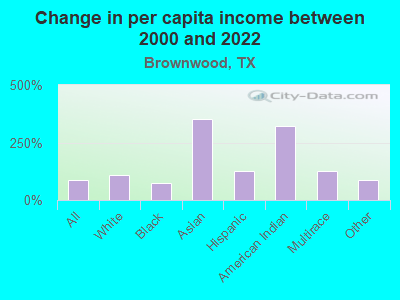
Change in median per capita income between 2000 and 2022:
Brownwood, Texas:
+85.9%
State:
+94.3%
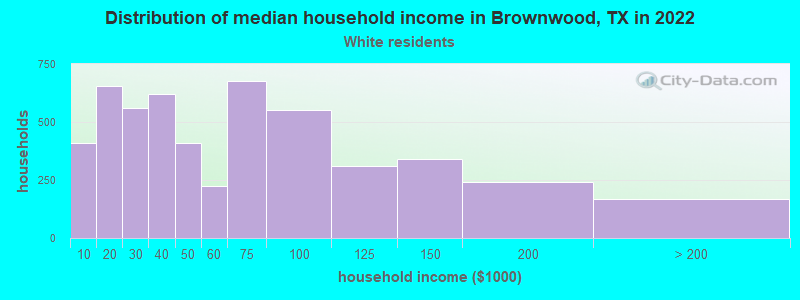
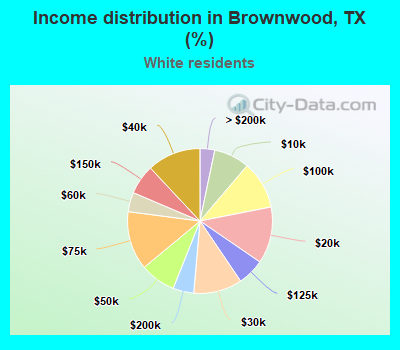
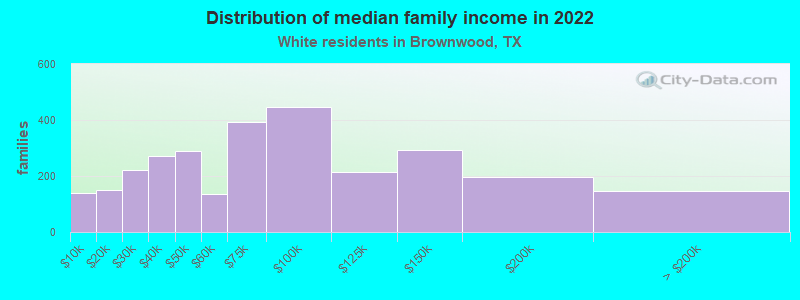
Income statistics for White residents
Median household income in Brownwood, TX in 2022:
Brownwood:
$45,701
Texas:
$82,032
Change in median household income between 2000 and 2022:
Brownwood, Texas:
+62.0%
Texas:
+91.0%
Number of households with income < $10k:
Brownwood:
7.9% (411)
State:
4.7% (273,716)
Number of households with income $10k - 20k:
Brownwood:
12.6% (654)
State:
5.5% (322,702)
Number of households with income $20k - 30k:
Brownwood:
10.9% (561)
State:
6.2% (363,947)
Number of households with income $30k - 40k:
Brownwood:
12.0% (619)
Texas:
6.8% (399,275)
Number of households with income $40k - 50k:
Brownwood:
7.9% (411)
State:
6.5% (383,417)
Number of households with income $50k - 60k:
Brownwood:
4.3% (224)
Texas:
6.6% (388,535)
Number of households with income $60k - 75k:
Brownwood:
13.1% (677)
State:
9.7% (566,295)
Number of households with income $75k - 100k:
Brownwood:
10.7% (552)
State:
13.0% (760,276)
Number of households with income $100k - 125k:
Brownwood:
6.0% (309)
State:
10.2% (597,596)
Number of households with income $125k - 150k:
Brownwood:
6.6% (342)
State:
7.4% (436,830)
Number of households with income $150k - 200k:
Brownwood:
4.6% (240)
State:
9.9% (583,067)
Number of households with income > $200k:
Brownwood:
3.3% (170)
State:
13.5% (792,647)
Aggregate household income in Brownwood in 2022: $351,692,698
Median family income in Brownwood in 2022:
Brownwood:
$67,461
Texas:
$101,788
Number of families with income < $10k:
Brownwood:
4.8% (139)
Texas:
2.8% (108,142)
Number of families with income $10k - 20k:
Brownwood:
5.1% (149)
State:
2.9% (113,421)
Number of families with income $20k - 30k:
Brownwood:
7.6% (220)
State:
4.1% (157,688)
Number of families with income $30k - 40k:
Brownwood:
9.4% (271)
State:
5.2% (198,847)
Number of families with income $40k - 50k:
Brownwood:
10.0% (289)
State:
5.6% (216,490)
Number of families with income $50k - 60k:
Brownwood:
4.7% (137)
Texas:
5.7% (220,689)
Number of families with income $60k - 75k:
Brownwood:
13.6% (393)
Texas:
9.0% (346,106)
Number of families with income $75k - 100k:
Brownwood:
15.4% (445)
Texas:
13.7% (527,363)
Number of families with income $100k - 125k:
Brownwood:
7.4% (215)
Texas:
11.6% (448,411)
Number of families with income $125k - 150k:
Brownwood:
10.2% (294)
Texas:
9.2% (355,798)
Number of families with income $150k - 200k:
Brownwood:
6.8% (196)
State:
12.5% (480,185)
Number of families with income > $200k:
Brownwood:
5.1% (147)
State:
17.6% (677,490)
Median non-family income in Brownwood in 2022:
Brownwood:
$27,444
Texas:
$50,587
Change in median non-family income between 2000 and 2022:
Brownwood, Texas:
+94.0%
State:
+87.7%
Median per capita income in Brownwood in 2022:
Brownwood:
$32,024
State:
$47,740
Change in median per capita income between 2000 and 2022:
Brownwood, Texas:
+110.0%
Texas:
+114.3%
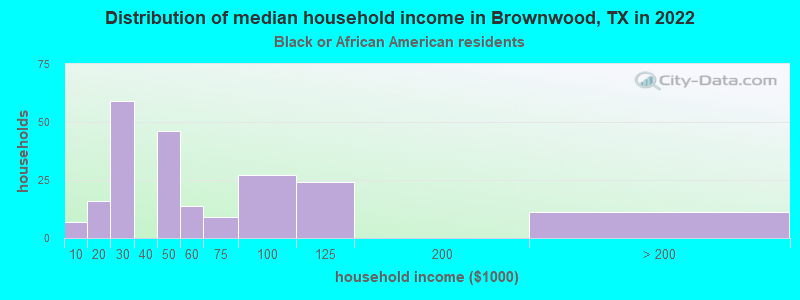
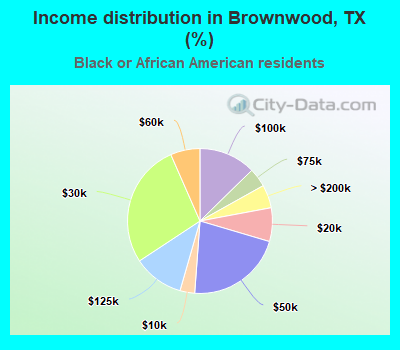
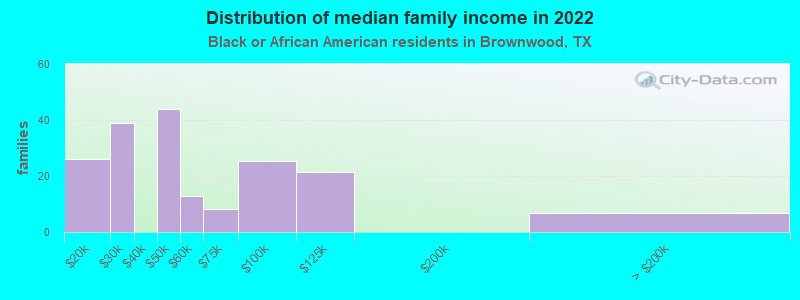
Income statistics for Black or African American residents
Median household income in Brownwood, TX in 2022:
Brownwood:
$46,215
Texas:
$55,759
Number of households with income < $10k:
Brownwood:
3.3% (7)
State:
8.9% (126,378)
Number of households with income $10k - 20k:
Brownwood:
7.5% (16)
Texas:
9.9% (140,369)
Number of households with income $20k - 30k:
Brownwood:
27.7% (59)
Texas:
8.5% (120,639)
Number of households with income $30k - 40k:
Brownwood:
0.0% (0)
Texas:
9.7% (137,517)
Number of households with income $40k - 50k:
Brownwood:
21.6% (46)
State:
8.0% (112,973)
Number of households with income $50k - 60k:
Brownwood:
6.6% (14)
Texas:
8.3% (117,156)
Number of households with income $60k - 75k:
Brownwood:
4.2% (9)
Texas:
10.4% (147,462)
Number of households with income $75k - 100k:
Brownwood:
12.7% (27)
State:
11.5% (162,718)
Number of households with income $100k - 125k:
Brownwood:
11.3% (24)
State:
8.2% (115,829)
Number of households with income $125k - 150k:
Brownwood:
0.0% (0)
State:
4.9% (69,556)
Number of households with income $150k - 200k:
Brownwood:
0.0% (0)
State:
6.4% (90,701)
Number of households with income > $200k:
Brownwood:
5.2% (11)
State:
5.5% (77,988)
Aggregate household income in Brownwood in 2022: $12,756,768
Median family income in Brownwood in 2022:
Brownwood:
$46,445
State:
$69,134
Number of families with income $10k - 20k:
Brownwood:
14.2% (26)
State:
6.8% (55,300)
Number of families with income $20k - 30k:
Brownwood:
21.1% (39)
State:
7.1% (57,877)
Number of families with income $40k - 50k:
Brownwood:
23.8% (44)
Texas:
7.1% (57,907)
Number of families with income $50k - 60k:
Brownwood:
7.1% (13)
State:
7.3% (59,511)
Number of families with income $60k - 75k:
Brownwood:
4.5% (8)
Texas:
10.1% (81,994)
Number of families with income $75k - 100k:
Brownwood:
13.9% (25)
State:
12.7% (103,723)
Number of families with income $100k - 125k:
Brownwood:
11.7% (22)
State:
9.4% (76,609)
Number of families with income > $200k:
Brownwood:
3.7% (7)
State:
7.9% (64,439)
Median per capita income in Brownwood in 2022:
Brownwood:
$15,537
State:
$30,490
Change in median per capita income between 2000 and 2022:
Brownwood, Texas:
+75.0%
State:
+113.9%
Income statistics for Asian residents
Median per capita income in Brownwood in 2022:
Brownwood:
$40,895
Texas:
$48,626
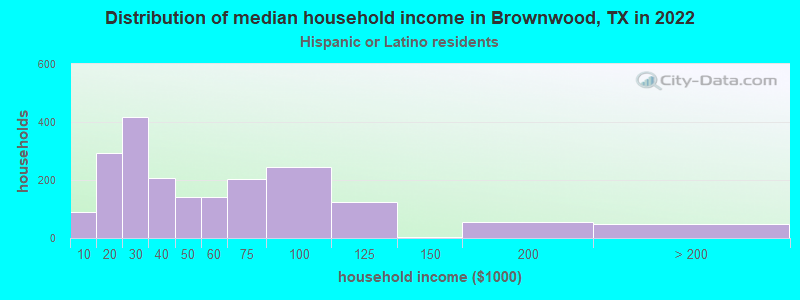
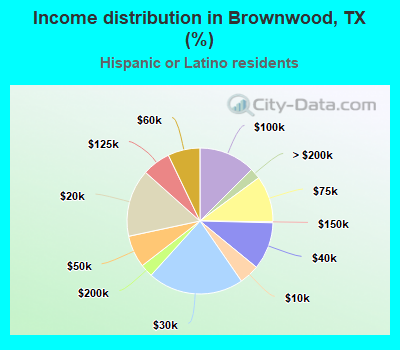
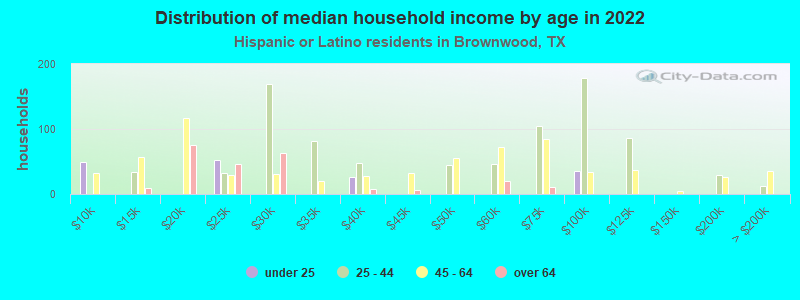
Income statistics for Hispanic or Latino residents
Median household income in Brownwood, TX in 2022:
Brownwood:
$38,121
State:
$60,504
Change in median household income between 2000 and 2022:
Brownwood, Texas:
+41.6%
State:
+102.5%
Number of households with income < $10k:
Brownwood:
4.5% (88)
State:
5.8% (213,953)
Number of households with income $10k - 20k:
Brownwood:
15.0% (294)
Texas:
8.0% (297,456)
Number of households with income $20k - 30k:
Brownwood:
21.3% (418)
Texas:
9.2% (340,166)
Number of households with income $30k - 40k:
Brownwood:
10.5% (207)
State:
9.5% (354,336)
Number of households with income $40k - 50k:
Brownwood:
7.1% (140)
State:
8.8% (327,013)
Number of households with income $50k - 60k:
Brownwood:
7.1% (140)
Texas:
8.3% (308,818)
Number of households with income $60k - 75k:
Brownwood:
10.3% (202)
Texas:
10.9% (405,109)
Number of households with income $75k - 100k:
Brownwood:
12.5% (246)
State:
13.8% (511,639)
Number of households with income $100k - 125k:
Brownwood:
6.3% (123)
State:
8.6% (319,728)
Number of households with income $125k - 150k:
Brownwood:
0.2% (4)
State:
5.7% (210,932)
Number of households with income $150k - 200k:
Brownwood:
2.8% (56)
State:
6.4% (236,055)
Number of households with income > $200k:
Brownwood:
2.4% (47)
State:
5.1% (189,259)
Aggregate household income in Brownwood in 2022: $105,185,463
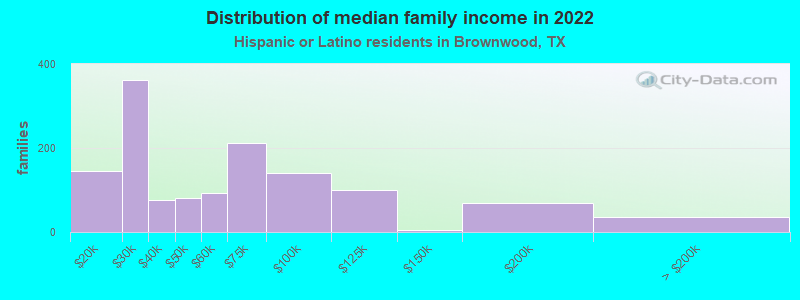
Median family income in Brownwood in 2022:
Brownwood:
$48,525
Texas:
$65,080
Number of families with income $10k - 20k:
Brownwood:
11.1% (146)
State:
6.3% (174,531)
Number of families with income $20k - 30k:
Brownwood:
27.5% (362)
Texas:
8.6% (238,528)
Number of families with income $30k - 40k:
Brownwood:
5.8% (76)
State:
9.1% (251,999)
Number of families with income $40k - 50k:
Brownwood:
6.1% (80)
Texas:
8.6% (240,188)
Number of families with income $50k - 60k:
Brownwood:
7.1% (93)
Texas:
8.0% (223,566)
Number of families with income $60k - 75k:
Brownwood:
16.0% (211)
Texas:
10.9% (302,688)
Number of families with income $75k - 100k:
Brownwood:
10.6% (140)
Texas:
14.3% (398,554)
Number of families with income $100k - 125k:
Brownwood:
7.7% (101)
State:
9.5% (264,007)
Number of families with income $125k - 150k:
Brownwood:
0.3% (4)
State:
6.2% (171,274)
Number of families with income $150k - 200k:
Brownwood:
5.2% (68)
Texas:
7.3% (202,259)
Number of families with income > $200k:
Brownwood:
2.6% (35)
Texas:
5.9% (165,129)
Median non-family income in Brownwood in 2022:
Brownwood:
$25,536
State:
$39,934
Change in median non-family income between 2000 and 2022:
Brownwood, Texas:
+70.2%
Texas:
+109.1%
Median per capita income in Brownwood in 2022:
Brownwood:
$19,319
State:
$24,862
Change in median per capita income between 2000 and 2022:
Brownwood, Texas:
+124.5%
State:
+130.8%
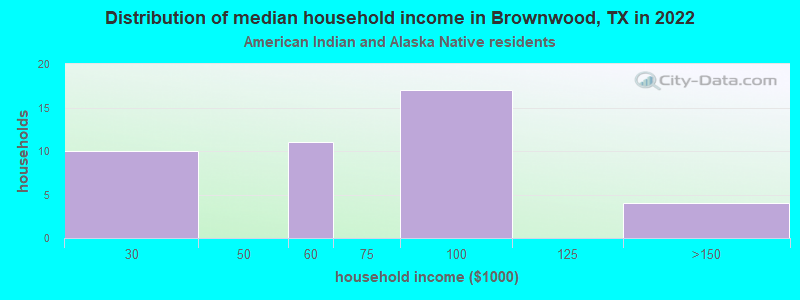
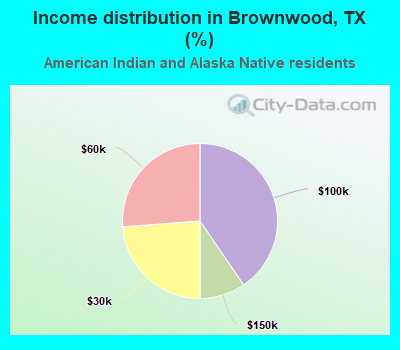
Income statistics for American Indian and Alaska Native residents
Median household income in Brownwood, TX in 2022:
Brownwood:
$84,890
State:
$65,765
Number of households with income < $10k:
Brownwood:
0.0% (0)
State:
4.1% (3,398)
Number of households with income $10k - 20k:
Brownwood:
0.0% (0)
State:
8.3% (6,949)
Number of households with income $20k - 30k:
Brownwood:
23.8% (10)
State:
9.3% (7,742)
Number of households with income $30k - 40k:
Brownwood:
0.0% (0)
State:
9.1% (7,627)
Number of households with income $40k - 50k:
Brownwood:
0.0% (0)
State:
7.1% (5,922)
Number of households with income $50k - 60k:
Brownwood:
26.2% (11)
State:
8.1% (6,761)
Number of households with income $60k - 75k:
Brownwood:
0.0% (0)
State:
12.7% (10,588)
Number of households with income $75k - 100k:
Brownwood:
40.5% (17)
State:
13.0% (10,903)
Number of households with income $100k - 125k:
Brownwood:
0.0% (0)
State:
9.9% (8,256)
Number of households with income $125k - 150k:
Brownwood:
9.5% (4)
Texas:
5.2% (4,355)
Number of households with income $150k - 200k:
Brownwood:
0.0% (0)
State:
6.7% (5,623)
Number of households with income > $200k:
Brownwood:
0.0% (0)
Texas:
6.6% (5,522)
Aggregate household income in Brownwood in 2022: $2,934,366
Median per capita income in Brownwood in 2022:
Brownwood:
$40,680
State:
$28,166
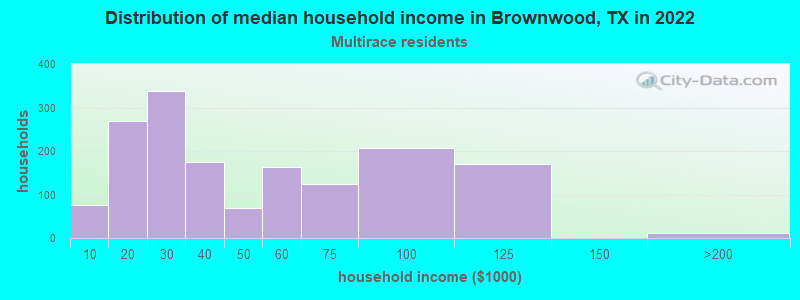
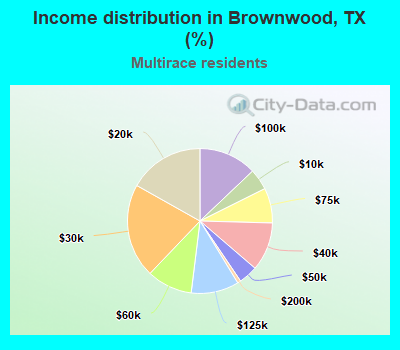
Income statistics for Multirace residents
Median household income in Brownwood, TX in 2022:
Brownwood:
$31,662
State:
$62,748
Change in median household income between 2000 and 2022:
Brownwood, Texas:
+60.8%
State:
+92.3%
Number of households with income < $10k:
Brownwood:
4.7% (76)
Texas:
5.5% (122,324)
Number of households with income $10k - 20k:
Brownwood:
16.8% (270)
Texas:
8.2% (182,232)
Number of households with income $20k - 30k:
Brownwood:
21.0% (337)
State:
8.5% (189,456)
Number of households with income $30k - 40k:
Brownwood:
10.9% (174)
State:
8.9% (197,499)
Number of households with income $40k - 50k:
Brownwood:
4.2% (68)
Texas:
8.7% (191,735)
Number of households with income $50k - 60k:
Brownwood:
10.2% (163)
State:
8.0% (177,535)
Number of households with income $60k - 75k:
Brownwood:
7.8% (125)
State:
10.5% (232,479)
Number of households with income $75k - 100k:
Brownwood:
12.9% (207)
State:
13.1% (290,448)
Number of households with income $100k - 125k:
Brownwood:
10.7% (171)
Texas:
8.6% (191,595)
Number of households with income $125k - 150k:
Brownwood:
0.0% (0)
Texas:
6.0% (133,361)
Number of households with income $150k - 200k:
Brownwood:
0.7% (12)
State:
7.2% (159,195)
Number of households with income > $200k:
Brownwood:
0.0% (0)
State:
6.7% (148,064)
Aggregate household income in Brownwood in 2022: $77,952,296
Median non-family income in Brownwood in 2022:
Brownwood:
$32,281
State:
$40,634
Change in median non-family income between 2000 and 2022:
Brownwood, Texas:
+89.5%
State:
+77.2%
Median per capita income in Brownwood in 2022:
Brownwood:
$17,539
State:
$26,785
Change in median per capita income between 2000 and 2022:
Brownwood, Texas:
+126.2%
State:
+110.9%
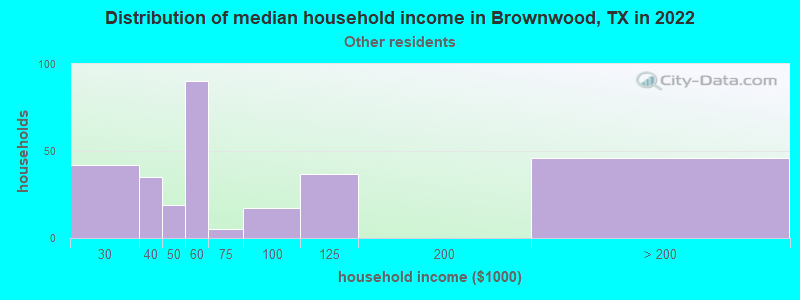
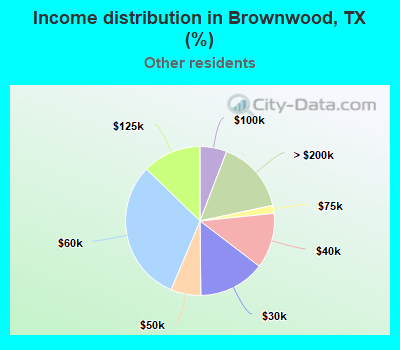
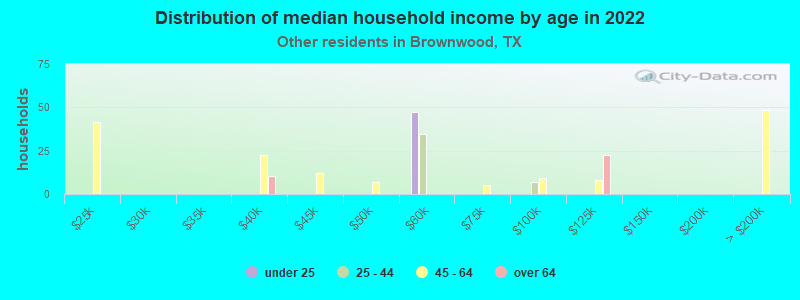
Income statistics for other residents
Median household income in Brownwood, TX in 2022:
Brownwood:
$54,663
Texas:
$57,114
Number of households with income < $10k:
Brownwood:
0.0% (0)
State:
5.9% (54,162)
Number of households with income $10k - 20k:
Brownwood:
0.0% (0)
State:
6.8% (62,891)
Number of households with income $20k - 30k:
Brownwood:
14.4% (42)
State:
10.6% (97,294)
Number of households with income $30k - 40k:
Brownwood:
12.0% (35)
State:
10.8% (99,670)
Number of households with income $40k - 50k:
Brownwood:
6.5% (19)
Texas:
9.3% (85,548)
Number of households with income $50k - 60k:
Brownwood:
30.9% (90)
Texas:
9.0% (82,757)
Number of households with income $60k - 75k:
Brownwood:
1.7% (5)
Texas:
10.9% (100,326)
Number of households with income $75k - 100k:
Brownwood:
5.8% (17)
State:
14.0% (128,767)
Number of households with income $100k - 125k:
Brownwood:
12.7% (37)
Texas:
8.2% (75,218)
Number of households with income $125k - 150k:
Brownwood:
0.0% (0)
Texas:
4.8% (44,223)
Number of households with income $150k - 200k:
Brownwood:
0.0% (0)
State:
5.6% (51,376)
Number of households with income > $200k:
Brownwood:
15.8% (46)
State:
4.0% (36,393)
Aggregate household income in Brownwood in 2022: $22,266,146
Median per capita income in Brownwood in 2022:
Brownwood:
$18,557
State:
$23,899
Change in median per capita income between 2000 and 2022:
Brownwood, Texas:
+88.1%
State:
+135.2%
Discuss Brownwood, Texas (TX) on our hugely popular Texas forum.