Burlington, New York (NY) income map, earnings map, and wages data
The median household income in Burlington, NY in 2022 was $67,035, which was 18.7% less than the median annual income of $79,557 across the entire state of New York. Compared to the median income of $36,823 in 2000 this represents an increase of 45.1%. The per capita income in 2022 was $30,941, which means an increase of 50.9% compared to 2000 when it was $15,184.
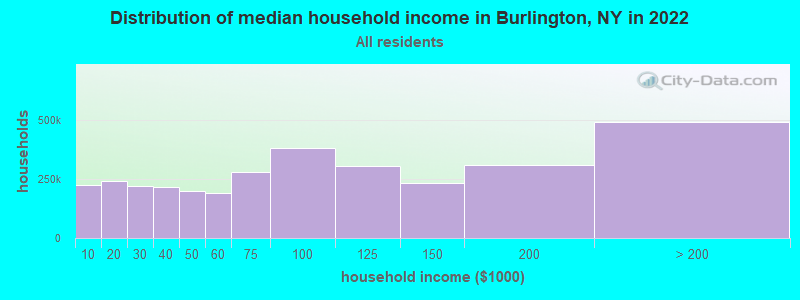
Income statistics for all residents
Median household income in Burlington, NY in 2022:| Burlington: | $67,035 |
| New York: | $79,557 |
Change in median household income between 2000 and 2022:| Burlington, New York: | +82.0% |
| State: | +83.3% |
Number of households with income < $10k:| Burlington: | 6.8% (223,971) |
| State: | 6.8% (527,598) |
Number of households with income $10k - 20k:| Burlington: | 7.4% (244,026) |
| State: | 7.4% (574,940) |
Number of households with income $20k - 30k:| Burlington: | 6.7% (219,721) |
| State: | 6.7% (517,718) |
Number of households with income $30k - 40k:| Burlington: | 6.5% (215,017) |
| New York: | 6.5% (506,674) |
Number of households with income $40k - 50k:| Burlington: | 6.1% (199,627) |
| State: | 6.1% (470,439) |
Number of households with income $50k - 60k:| Burlington: | 5.8% (192,666) |
| State: | 5.8% (454,042) |
Number of households with income $60k - 75k:| Burlington: | 8.5% (278,999) |
| New York: | 8.5% (657,508) |
Number of households with income $75k - 100k:| Burlington: | 11.6% (381,817) |
| State: | 11.6% (899,824) |
Number of households with income $100k - 125k:| Burlington: | 9.3% (307,142) |
| New York: | 9.3% (723,825) |
Number of households with income $125k - 150k:| Burlington: | 7.1% (234,421) |
| State: | 7.1% (552,420) |
Number of households with income $150k - 200k:| Burlington: | 9.4% (308,561) |
| New York: | 9.4% (727,051) |
Number of households with income > $200k:| Burlington: | 15.0% (493,368) |
| New York: | 15.0% (1,162,269) |
Aggregate household income in Burlington in 2022: $3,670,684,633
Median family income in Burlington in 2022:| Burlington: | $81,133 |
| State: | $99,066 |
Median non-family income in Burlington in 2022:| Burlington: | $38,024 |
| New York: | $50,181 |
Change in median non-family income between 2000 and 2022:| Burlington, New York: | +81.3% |
| State: | +85.4% |
Median per capita income in Burlington in 2022:| Burlington: | $30,941 |
| State: | $47,421 |
Change in median per capita income between 2000 and 2022:| Burlington, New York: | +103.8% |
| State: | +102.7% |
Income statistics for White residents
Median household income in Burlington, NY in 2022:| Burlington: | $67,506 |
| New York: | $89,408 |
Change in median household income between 2000 and 2022:| Burlington, New York: | +83.3% |
| State: | +85.5% |
Number of households with income < $10k:| Burlington: | 4.8% (85,783) |
| State: | 4.8% (225,550) |
Number of households with income $10k - 20k:| Burlington: | 6.1% (110,526) |
| New York: | 6.1% (289,425) |
Number of households with income $20k - 30k:| Burlington: | 6.0% (107,207) |
| State: | 5.9% (280,254) |
Number of households with income $30k - 40k:| Burlington: | 6.1% (110,393) |
| New York: | 6.1% (288,263) |
Number of households with income $40k - 50k:| Burlington: | 5.9% (106,601) |
| State: | 5.9% (278,079) |
Number of households with income $50k - 60k:| Burlington: | 5.7% (102,625) |
| State: | 5.7% (267,554) |
Number of households with income $60k - 75k:| Burlington: | 8.5% (152,829) |
| State: | 8.4% (398,344) |
Number of households with income $75k - 100k:| Burlington: | 11.8% (212,828) |
| State: | 11.8% (554,841) |
Number of households with income $100k - 125k:| Burlington: | 10.0% (179,693) |
| State: | 10.0% (469,794) |
Number of households with income $125k - 150k:| Burlington: | 7.7% (137,804) |
| New York: | 7.6% (360,467) |
Number of households with income $150k - 200k:| Burlington: | 10.1% (181,520) |
| New York: | 10.1% (477,078) |
Number of households with income > $200k:| Burlington: | 17.4% (313,110) |
| State: | 17.6% (829,233) |
Aggregate household income in Burlington in 2022: $2,457,030,281
Median family income in Burlington in 2022:| Burlington: | $82,916 |
| New York: | $115,170 |
Number of families with income < $10k:| Burlington: | 4.8% (8) |
| New York: | 2.5% (68,851) |
Number of families with income $10k - 20k:| Burlington: | 4.8% (8) |
| State: | 3.0% (83,127) |
Number of families with income $20k - 30k:| Burlington: | 9.6% (15) |
| State: | 3.5% (97,578) |
Number of families with income $30k - 40k:| Burlington: | 11.1% (18) |
| State: | 4.1% (114,108) |
Number of families with income $40k - 50k:| Burlington: | 14.1% (23) |
| State: | 4.7% (130,902) |
Number of families with income $50k - 60k:| Burlington: | 13.2% (21) |
| New York: | 4.9% (135,118) |
Number of families with income $60k - 75k:| Burlington: | 14.5% (23) |
| New York: | 7.8% (216,254) |
Number of families with income $75k - 100k:| Burlington: | 18.1% (29) |
| State: | 12.4% (342,382) |
Number of families with income $100k - 125k:| Burlington: | 3.0% (5) |
| State: | 11.4% (314,917) |
Number of families with income $125k - 150k:| Burlington: | 6.8% (11) |
| New York: | 9.4% (260,489) |
Median non-family income in Burlington in 2022:| Burlington: | $38,570 |
| New York: | $54,783 |
Change in median non-family income between 2000 and 2022:| Burlington, New York: | +83.9% |
| State: | +87.9% |
Median per capita income in Burlington in 2022:| Burlington: | $32,300 |
| State: | $57,640 |
Change in median per capita income between 2000 and 2022:| Burlington, New York: | +111.0% |
| State: | +111.6% |
Income statistics for Black or African American residents
Median household income in Burlington, NY in 2022:| Burlington: | $62,559 |
| New York: | $57,898 |
Change in median household income between 2000 and 2022:| Burlington, New York: | +100.2% |
| State: | +84.6% |
Number of households with income < $10k:| Burlington: | 12.0% (64,067) |
| State: | 12.0% (128,500) |
Number of households with income $10k - 20k:| Burlington: | 10.0% (53,564) |
| State: | 10.0% (107,541) |
Number of households with income $20k - 30k:| Burlington: | 8.4% (44,954) |
| New York: | 8.4% (90,192) |
Number of households with income $30k - 40k:| Burlington: | 7.4% (39,621) |
| New York: | 7.4% (79,579) |
Number of households with income $40k - 50k:| Burlington: | 6.8% (36,126) |
| State: | 6.8% (72,491) |
Number of households with income $50k - 60k:| Burlington: | 6.6% (35,432) |
| New York: | 6.7% (71,309) |
Number of households with income $60k - 75k:| Burlington: | 8.9% (47,369) |
| State: | 8.9% (95,050) |
Number of households with income $75k - 100k:| Burlington: | 11.5% (61,461) |
| New York: | 11.5% (123,569) |
Number of households with income $100k - 125k:| Burlington: | 8.1% (43,026) |
| State: | 8.1% (86,632) |
Number of households with income $125k - 150k:| Burlington: | 6.1% (32,280) |
| State: | 6.0% (64,788) |
Number of households with income $150k - 200k:| Burlington: | 7.1% (38,090) |
| New York: | 7.2% (76,644) |
Number of households with income > $200k:| Burlington: | 7.0% (37,197) |
| State: | 7.0% (75,062) |
Aggregate household income in Burlington in 2022: $1,299,835
Median family income in Burlington in 2022:| Burlington: | $61,922 |
| New York: | $72,528 |
Median per capita income in Burlington in 2022:| Burlington: | $26,804 |
| State: | $31,947 |
Change in median per capita income between 2000 and 2022:| Burlington, New York: | +99.4% |
| State: | +106.1% |
Income statistics for Hispanic or Latino residents
Number of households with income < $10k:| Burlington: | 10.0% (41,378) |
| New York: | 9.9% (127,185) |
Number of households with income $10k - 20k:| Burlington: | 10.7% (44,505) |
| New York: | 10.7% (136,699) |
Number of households with income $20k - 30k:| Burlington: | 8.1% (33,522) |
| State: | 8.1% (102,991) |
Number of households with income $30k - 40k:| Burlington: | 7.8% (32,540) |
| State: | 7.8% (100,149) |
Number of households with income $40k - 50k:| Burlington: | 6.9% (28,495) |
| New York: | 6.9% (87,760) |
Number of households with income $50k - 60k:| Burlington: | 6.3% (26,333) |
| New York: | 6.3% (80,968) |
Number of households with income $60k - 75k:| Burlington: | 8.6% (35,940) |
| State: | 8.7% (110,631) |
Number of households with income $75k - 100k:| Burlington: | 11.2% (46,389) |
| State: | 11.2% (142,787) |
Number of households with income $100k - 125k:| Burlington: | 8.2% (34,032) |
| State: | 8.2% (104,850) |
Number of households with income $125k - 150k:| Burlington: | 6.3% (26,080) |
| State: | 6.3% (80,274) |
Number of households with income $150k - 200k:| Burlington: | 7.4% (30,871) |
| State: | 7.4% (95,117) |
Number of households with income > $200k:| Burlington: | 8.6% (35,570) |
| State: | 8.6% (109,514) |
Median per capita income in Burlington in 2022:| Burlington: | $18,910 |
| State: | $29,761 |
Change in median per capita income between 2000 and 2022:| Burlington, New York: | +127.3% |
| State: | +132.7% |
Income statistics for Multirace residents
Number of households with income < $10k:| Burlington: | 8.9% (22,662) |
| New York: | 8.9% (57,924) |
Number of households with income $10k - 20k:| Burlington: | 8.7% (22,145) |
| State: | 8.7% (56,590) |
Number of households with income $20k - 30k:| Burlington: | 7.1% (18,114) |
| State: | 7.1% (46,287) |
Number of households with income $30k - 40k:| Burlington: | 6.9% (17,665) |
| State: | 6.9% (45,132) |
Number of households with income $40k - 50k:| Burlington: | 5.8% (14,856) |
| State: | 5.8% (37,946) |
Number of households with income $50k - 60k:| Burlington: | 5.6% (14,252) |
| State: | 5.6% (36,410) |
Number of households with income $60k - 75k:| Burlington: | 7.8% (19,894) |
| State: | 7.8% (50,819) |
Number of households with income $75k - 100k:| Burlington: | 11.7% (29,754) |
| New York: | 11.7% (76,024) |
Number of households with income $100k - 125k:| Burlington: | 9.3% (23,739) |
| New York: | 9.3% (60,635) |
Number of households with income $125k - 150k:| Burlington: | 6.2% (15,864) |
| State: | 6.2% (40,533) |
Number of households with income $150k - 200k:| Burlington: | 8.7% (22,079) |
| State: | 8.6% (56,409) |
Number of households with income > $200k:| Burlington: | 13.4% (34,218) |
| State: | 13.4% (87,442) |
Median per capita income in Burlington in 2022:| Burlington: | $28,721 |
| New York: | $36,931 |
Income statistics for other residents
Number of households with income < $10k:| Burlington: | 12.0% (3) |
| State: | 10.3% (69,252) |
Number of households with income $10k - 20k:| Burlington: | 12.0% (3) |
| New York: | 11.0% (73,890) |
Number of households with income $20k - 30k:| Burlington: | 8.0% (2) |
| New York: | 8.8% (59,096) |
Number of households with income $30k - 40k:| Burlington: | 8.0% (2) |
| State: | 8.1% (54,418) |
Number of households with income $40k - 50k:| Burlington: | 8.0% (2) |
| State: | 7.3% (49,042) |
Number of households with income $50k - 60k:| Burlington: | 4.0% (1) |
| State: | 6.5% (43,945) |
Number of households with income $60k - 75k:| Burlington: | 8.0% (2) |
| State: | 9.5% (64,087) |
Number of households with income $75k - 100k:| Burlington: | 12.0% (3) |
| New York: | 10.9% (73,094) |
Number of households with income $100k - 125k:| Burlington: | 8.0% (2) |
| New York: | 7.9% (53,055) |
Number of households with income $125k - 150k:| Burlington: | 4.0% (1) |
| New York: | 5.9% (39,446) |
Number of households with income $150k - 200k:| Burlington: | 8.0% (2) |
| State: | 7.2% (48,653) |
Number of households with income > $200k:| Burlington: | 8.0% (2) |
| State: | 6.6% (44,703) |
Aggregate household income in Burlington in 2022: $2,198,611
Median family income in Burlington in 2022:| Burlington: | $150,481 |
| State: | $63,465 |
Median per capita income in Burlington in 2022:| Burlington: | $29,286 |
| State: | $26,975 |
Change in median per capita income between 2000 and 2022:| Burlington, New York: | +132.7% |
| State: | +144.6% |