The median household income in Callisburg, TX in 2022 was $48,661, which was 48.5% less than the median annual income of $72,284 across the entire state of Texas. Compared to the median income of $34,500 in 2000 this represents an increase of 29.1%. The per capita income in 2022 was $25,207, which means an increase of 39.6% compared to 2000 when it was $15,228.
Whole page based on the data from 2000 / 2022 when the population of Callisburg, Texas was 365 / 310
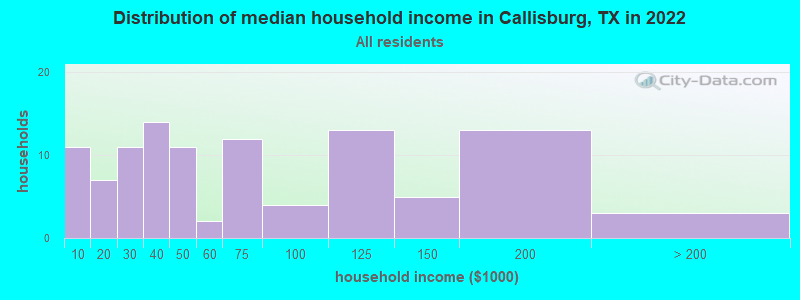
Income statistics for all residents
Median household income in Callisburg, TX in 2022:
Callisburg:
$48,661
State:
$72,284
Change in median household income between 2000 and 2022:
Callisburg, Texas:
+41.0%
Texas:
+81.0%
Number of households with income < $10k:
Callisburg:
10.4% (11)
State:
5.5% (611,011)
Number of households with income $10k - 20k:
Callisburg:
6.6% (7)
Texas:
6.7% (743,157)
Number of households with income $20k - 30k:
Callisburg:
10.4% (11)
State:
7.2% (803,381)
Number of households with income $30k - 40k:
Callisburg:
13.2% (14)
State:
7.8% (866,080)
Number of households with income $40k - 50k:
Callisburg:
10.4% (11)
Texas:
7.3% (810,440)
Number of households with income $50k - 60k:
Callisburg:
1.9% (2)
State:
7.2% (799,783)
Number of households with income $60k - 75k:
Callisburg:
11.3% (12)
State:
9.9% (1,095,384)
Number of households with income $75k - 100k:
Callisburg:
3.8% (4)
State:
12.8% (1,419,057)
Number of households with income $100k - 125k:
Callisburg:
12.3% (13)
Texas:
9.5% (1,054,577)
Number of households with income $125k - 150k:
Callisburg:
4.7% (5)
Texas:
6.7% (741,518)
Number of households with income $150k - 200k:
Callisburg:
12.3% (13)
State:
8.7% (961,776)
Number of households with income > $200k:
Callisburg:
2.8% (3)
State:
10.7% (1,181,544)
Aggregate household income in Callisburg in 2022: $7,959,894
Median family income in Callisburg in 2022:
Callisburg:
$80,019
State:
$86,267
Number of families with income < $10k:
Callisburg:
12.3% (9)
State:
4.0% (297,884)
Number of families with income $10k - 20k:
Callisburg:
2.8% (2)
Texas:
4.3% (324,514)
Number of families with income $20k - 30k:
Callisburg:
1.3% (1)
State:
5.8% (430,949)
Number of families with income $30k - 40k:
Callisburg:
18.5% (14)
State:
6.6% (493,535)
Number of families with income $40k - 50k:
Callisburg:
2.8% (2)
State:
6.7% (499,663)
Number of families with income $50k - 60k:
Callisburg:
2.7% (2)
State:
6.6% (492,203)
Number of families with income $60k - 75k:
Callisburg:
9.8% (7)
State:
9.5% (710,229)
Number of families with income $75k - 100k:
Callisburg:
5.5% (4)
Texas:
13.6% (1,015,480)
Number of families with income $100k - 125k:
Callisburg:
17.3% (13)
State:
10.7% (797,961)
Number of families with income $125k - 150k:
Callisburg:
6.4% (5)
State:
8.1% (602,985)
Number of families with income $150k - 200k:
Callisburg:
16.5% (13)
Texas:
10.7% (804,459)
Number of families with income > $200k:
Callisburg:
4.1% (3)
State:
13.5% (1,013,514)
Median non-family income in Callisburg in 2022:
Callisburg:
$24,441
Texas:
$45,999
Change in median non-family income between 2000 and 2022:
Callisburg, Texas:
+64.7%
State:
+79.5%
Median per capita income in Callisburg in 2022:
Callisburg:
$25,208
Texas:
$38,123
Change in median per capita income between 2000 and 2022:
Callisburg, Texas:
+65.5%
State:
+94.3%
Income statistics for White residents
Median household income in Callisburg, TX in 2022:
Callisburg:
$50,757
State:
$82,032
Change in median household income between 2000 and 2022:
Callisburg, Texas:
+45.0%
State:
+91.0%
Number of households with income < $10k:
Callisburg:
11.8% (10)
Texas:
4.7% (273,716)
Number of households with income $10k - 20k:
Callisburg:
7.1% (6)
State:
5.5% (322,702)
Number of households with income $20k - 30k:
Callisburg:
10.6% (9)
State:
6.2% (363,947)
Number of households with income $30k - 40k:
Callisburg:
14.1% (12)
Texas:
6.8% (399,275)
Number of households with income $40k - 50k:
Callisburg:
5.9% (5)
State:
6.5% (383,417)
Number of households with income $50k - 60k:
Callisburg:
2.4% (2)
State:
6.6% (388,535)
Number of households with income $60k - 75k:
Callisburg:
11.8% (10)
Texas:
9.7% (566,295)
Number of households with income $75k - 100k:
Callisburg:
4.7% (4)
Texas:
13.0% (760,276)
Number of households with income $100k - 125k:
Callisburg:
14.1% (12)
State:
10.2% (597,596)
Number of households with income $125k - 150k:
Callisburg:
3.5% (3)
State:
7.4% (436,830)
Number of households with income $150k - 200k:
Callisburg:
10.6% (9)
State:
9.9% (583,067)
Number of households with income > $200k:
Callisburg:
3.5% (3)
State:
13.5% (792,647)
Aggregate household income in Callisburg in 2022: $6,236,685
Median family income in Callisburg in 2022:
Callisburg:
$87,746
State:
$101,788
Number of families with income < $10k:
Callisburg:
12.7% (7)
Texas:
2.8% (108,142)
Number of families with income $10k - 20k:
Callisburg:
2.6% (1)
Texas:
2.9% (113,421)
Number of families with income $20k - 30k:
Callisburg:
1.2% (1)
State:
4.1% (157,688)
Number of families with income $30k - 40k:
Callisburg:
12.8% (7)
Texas:
5.2% (198,847)
Number of families with income $40k - 50k:
Callisburg:
3.0% (2)
Texas:
5.6% (216,490)
Number of families with income $50k - 60k:
Callisburg:
2.9% (2)
State:
5.7% (220,689)
Number of families with income $60k - 75k:
Callisburg:
11.1% (6)
Texas:
9.0% (346,106)
Number of families with income $75k - 100k:
Callisburg:
6.4% (3)
State:
13.7% (527,363)
Number of families with income $100k - 125k:
Callisburg:
20.7% (11)
State:
11.6% (448,411)
Number of families with income $125k - 150k:
Callisburg:
4.7% (3)
Texas:
9.2% (355,798)
Number of families with income $150k - 200k:
Callisburg:
16.6% (9)
State:
12.5% (480,185)
Number of families with income > $200k:
Callisburg:
5.2% (3)
State:
17.6% (677,490)
Median non-family income in Callisburg in 2022:
Callisburg:
$25,381
Texas:
$50,587
Change in median non-family income between 2000 and 2022:
Callisburg, Texas:
+10.8%
Texas:
+87.7%
Median per capita income in Callisburg in 2022:
Callisburg:
$28,453
State:
$47,740
Change in median per capita income between 2000 and 2022:
Callisburg, Texas:
+85.8%
Texas:
+114.3%
Income statistics for Hispanic or Latino residents
Aggregate household income in Callisburg in 2022: $16,222,780
Median per capita income in Callisburg in 2022:
Callisburg:
$13,938
State:
$24,862
Change in median per capita income between 2000 and 2022:
Callisburg, Texas:
+54.9%
State:
+130.8%
Income statistics for American Indian and Alaska Native residents
Aggregate household income in Callisburg in 2022: $1,089,799
Median per capita income in Callisburg in 2022:
Callisburg:
$20,769
Texas:
$28,166
Change in median per capita income between 2000 and 2022:
Callisburg, Texas:
+20.1%
Texas:
+77.2%
Income statistics for Multirace residents
Median per capita income in Callisburg in 2022:
Callisburg:
$14,880
State:
$26,785
Change in median per capita income between 2000 and 2022:: -9.5%
Callisburg, Texas:
-9.5%
State:
+110.9%
Income statistics for other residents
Aggregate household income in Callisburg in 2022: $2,477,699
Median per capita income in Callisburg in 2022:
Callisburg:
$19,043
State:
$23,899
Change in median per capita income between 2000 and 2022:
Callisburg, Texas:
+80.0%
Texas:
+135.2%
Discuss Callisburg, Texas (TX) on our hugely popular Texas forum.