The median household income in Castle Valley, UT in 2022 was $44,606, which was 99.9% less than the median annual income of $89,168 across the entire state of Utah. Compared to the median income of $33,068 in 2000 this represents an increase of 25.9%. The per capita income in 2022 was $44,754, which means an increase of 55.9% compared to 2000 when it was $19,726.
Whole page based on the data from 2000 / 2022 when the population of Castle Valley, Utah was 349 / 421
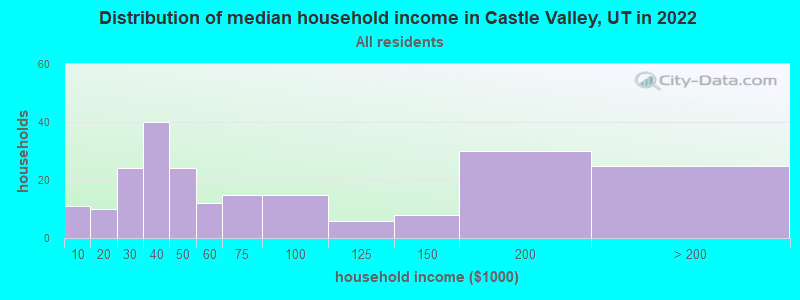
Income statistics for all residents
Median household income in Castle Valley, UT in 2022:
Castle Valley:
$44,606
State:
$89,168
Change in median household income between 2000 and 2022:
Castle Valley, Utah:
+34.9%
State:
+95.0%
Number of households with income < $10k:
Castle Valley:
5.0% (11)
State:
3.0% (33,488)
Number of households with income $10k - 20k:
Castle Valley:
4.5% (10)
State:
4.2% (47,659)
Number of households with income $20k - 30k:
Castle Valley:
10.9% (24)
State:
5.0% (55,999)
Number of households with income $30k - 40k:
Castle Valley:
18.2% (40)
State:
6.3% (71,296)
Number of households with income $40k - 50k:
Castle Valley:
10.9% (24)
Utah:
6.0% (68,315)
Number of households with income $50k - 60k:
Castle Valley:
5.5% (12)
Utah:
6.9% (77,538)
Number of households with income $60k - 75k:
Castle Valley:
6.8% (15)
State:
10.1% (114,168)
Number of households with income $75k - 100k:
Castle Valley:
6.8% (15)
State:
14.4% (163,156)
Number of households with income $100k - 125k:
Castle Valley:
2.7% (6)
State:
12.0% (135,990)
Number of households with income $125k - 150k:
Castle Valley:
3.6% (8)
State:
9.0% (101,240)
Number of households with income $150k - 200k:
Castle Valley:
13.6% (30)
State:
11.2% (126,570)
Number of households with income > $200k:
Castle Valley:
11.4% (25)
Utah:
11.9% (134,241)
Aggregate household income in Castle Valley in 2022: $18,755,491
Median non-family income in Castle Valley in 2022:
Castle Valley:
$33,558
State:
$51,496
Change in median non-family income between 2000 and 2022:
Castle Valley, Utah:
+11.2%
State:
+95.0%
Median per capita income in Castle Valley in 2022:
Castle Valley:
$44,755
State:
$38,514
Change in median per capita income between 2000 and 2022:
Castle Valley, Utah:
+126.9%
State:
+111.8%
Income statistics for White residents
Median household income in Castle Valley, UT in 2022:
Castle Valley:
$44,860
Utah:
$92,391
Change in median household income between 2000 and 2022:
Castle Valley, Utah:
+37.1%
Utah:
+98.1%
Number of households with income < $10k:
Castle Valley:
5.1% (11)
Utah:
2.8% (26,009)
Number of households with income $10k - 20k:
Castle Valley:
4.7% (10)
Utah:
4.3% (40,322)
Number of households with income $20k - 30k:
Castle Valley:
10.2% (22)
State:
4.6% (42,908)
Number of households with income $30k - 40k:
Castle Valley:
18.6% (40)
Utah:
6.0% (56,214)
Number of households with income $40k - 50k:
Castle Valley:
11.2% (24)
State:
6.0% (56,454)
Number of households with income $50k - 60k:
Castle Valley:
5.1% (11)
State:
6.7% (63,011)
Number of households with income $60k - 75k:
Castle Valley:
6.5% (14)
Utah:
9.6% (90,095)
Number of households with income $75k - 100k:
Castle Valley:
7.0% (15)
State:
14.3% (135,141)
Number of households with income $100k - 125k:
Castle Valley:
2.8% (6)
State:
12.4% (117,040)
Number of households with income $125k - 150k:
Castle Valley:
3.7% (8)
State:
9.2% (86,215)
Number of households with income $150k - 200k:
Castle Valley:
13.5% (29)
State:
11.6% (109,741)
Number of households with income > $200k:
Castle Valley:
11.6% (25)
Utah:
12.6% (118,969)
Aggregate household income in Castle Valley in 2022: $18,266,972
Median non-family income in Castle Valley in 2022:
Castle Valley:
$33,979
State:
$52,493
Change in median non-family income between 2000 and 2022:
Castle Valley, Utah:
+27.4%
Utah:
+97.4%
Median per capita income in Castle Valley in 2022:
Castle Valley:
$45,451
Utah:
$41,454
Change in median per capita income between 2000 and 2022:
Castle Valley, Utah:
+130.1%
State:
+118.4%
Discuss Castle Valley, Utah (UT) on our hugely popular Utah forum.