Cathan, Washington (WA) income map, earnings map, and wages data
The median household income in Cathan, WA in 2022 was $112,659, which was 19.0% greater than the median annual income of $91,306 across the entire state of Washington. Compared to the median income of $58,875 in 2000 this represents an increase of 47.7%. The per capita income in 2022 was $45,906, which means an increase of 54.4% compared to 2000 when it was $20,940.
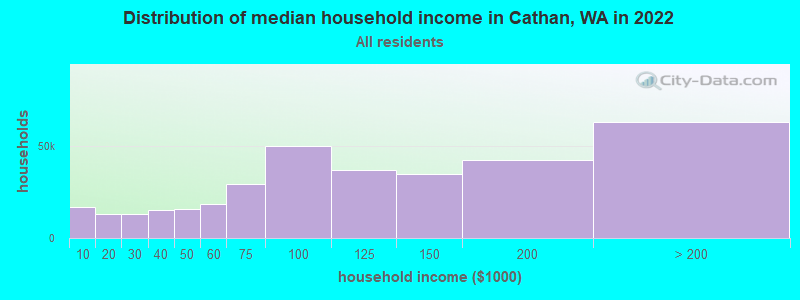
Income statistics for all residents
Median household income in Cathan, WA in 2022:| Cathan: | $112,659 |
| State: | $91,306 |
Change in median household income between 2000 and 2022:| Cathan, Washington: | +91.4% |
| State: | +99.5% |
Number of households with income < $10k:| Cathan: | 4.8% (16,690) |
| State: | 4.5% (139,331) |
Number of households with income $10k - 20k:| Cathan: | 3.8% (13,312) |
| Washington: | 5.0% (154,508) |
Number of households with income $20k - 30k:| Cathan: | 3.7% (12,920) |
| Washington: | 5.4% (166,555) |
Number of households with income $30k - 40k:| Cathan: | 4.3% (15,086) |
| Washington: | 5.5% (170,324) |
Number of households with income $40k - 50k:| Cathan: | 4.5% (15,816) |
| Washington: | 6.0% (183,941) |
Number of households with income $50k - 60k:| Cathan: | 5.3% (18,530) |
| State: | 6.1% (187,395) |
Number of households with income $60k - 75k:| Cathan: | 8.5% (29,634) |
| Washington: | 8.7% (266,771) |
Number of households with income $75k - 100k:| Cathan: | 14.3% (49,988) |
| State: | 13.1% (404,672) |
Number of households with income $100k - 125k:| Cathan: | 10.6% (36,875) |
| Washington: | 11.0% (337,911) |
Number of households with income $125k - 150k:| Cathan: | 9.9% (34,634) |
| State: | 8.0% (244,934) |
Number of households with income $150k - 200k:| Cathan: | 12.2% (42,682) |
| State: | 10.5% (323,812) |
Number of households with income > $200k:| Cathan: | 18.1% (63,230) |
| Washington: | 16.2% (499,799) |
Aggregate household income in Cathan in 2022: $192,168,034
Median family income in Cathan in 2022:| Cathan: | $123,248 |
| State: | $109,192 |
Median non-family income in Cathan in 2022:| Cathan: | $78,017 |
| State: | $57,299 |
Change in median non-family income between 2000 and 2022:| Cathan, Washington: | +89.1% |
| State: | +94.9% |
Median per capita income in Cathan in 2022:| Cathan: | $45,907 |
| Washington: | $50,764 |
Change in median per capita income between 2000 and 2022:| Cathan, Washington: | +119.2% |
| State: | +121.0% |
Income statistics for White residents
Median household income in Cathan, WA in 2022:| Cathan: | $110,916 |
| Washington: | $91,916 |
Change in median household income between 2000 and 2022:| Cathan, Washington: | +86.4% |
| Washington: | +95.4% |
Number of households with income < $10k:| Cathan: | 4.4% (11,128) |
| Washington: | 4.3% (95,850) |
Number of households with income $10k - 20k:| Cathan: | 3.9% (9,924) |
| State: | 4.8% (106,421) |
Number of households with income $20k - 30k:| Cathan: | 3.9% (9,979) |
| Washington: | 5.5% (122,860) |
Number of households with income $30k - 40k:| Cathan: | 4.2% (10,716) |
| Washington: | 5.4% (119,627) |
Number of households with income $40k - 50k:| Cathan: | 4.4% (11,113) |
| State: | 5.9% (132,276) |
Number of households with income $50k - 60k:| Cathan: | 5.9% (14,793) |
| Washington: | 6.1% (136,212) |
Number of households with income $60k - 75k:| Cathan: | 8.3% (20,930) |
| State: | 8.8% (196,086) |
Number of households with income $75k - 100k:| Cathan: | 14.9% (37,747) |
| State: | 13.4% (299,192) |
Number of households with income $100k - 125k:| Cathan: | 10.8% (27,205) |
| State: | 11.3% (252,209) |
Number of households with income $125k - 150k:| Cathan: | 9.6% (24,383) |
| State: | 7.9% (175,962) |
Number of households with income $150k - 200k:| Cathan: | 12.3% (31,175) |
| Washington: | 10.7% (239,156) |
Number of households with income > $200k:| Cathan: | 17.3% (43,748) |
| Washington: | 16.1% (359,917) |
Aggregate household income in Cathan in 2022: $126,426,287
Median family income in Cathan in 2022:| Cathan: | $127,153 |
| State: | $112,511 |
Number of families with income < $10k:| Cathan: | 2.5% (2) |
| State: | 2.4% (33,676) |
Number of families with income $10k - 20k:| Cathan: | 0.7% (1) |
| Washington: | 2.0% (28,228) |
Number of families with income $20k - 30k:| Cathan: | 1.6% (1) |
| Washington: | 2.9% (39,288) |
Number of families with income $30k - 40k:| Cathan: | 7.9% (6) |
| State: | 3.6% (50,190) |
Number of families with income $40k - 50k:| Cathan: | 6.8% (5) |
| State: | 4.6% (63,009) |
Number of families with income $50k - 60k:| Cathan: | 6.5% (5) |
| State: | 5.0% (69,270) |
Number of families with income $60k - 75k:| Cathan: | 16.1% (12) |
| State: | 8.2% (112,369) |
Number of families with income $75k - 100k:| Cathan: | 18.4% (14) |
| Washington: | 14.1% (194,214) |
Number of families with income $100k - 125k:| Cathan: | 32.1% (25) |
| State: | 13.2% (182,184) |
Number of families with income $125k - 150k:| Cathan: | 7.3% (6) |
| State: | 9.5% (130,928) |
Median non-family income in Cathan in 2022:| Cathan: | $76,815 |
| Washington: | $56,103 |
Change in median non-family income between 2000 and 2022:| Cathan, Washington: | +87.4% |
| State: | +87.7% |
Median per capita income in Cathan in 2022:| Cathan: | $47,923 |
| State: | $55,212 |
Change in median per capita income between 2000 and 2022:| Cathan, Washington: | +128.1% |
| Washington: | +123.8% |
Income statistics for Black or African American residents
Median household income in Cathan, WA in 2022:| Cathan: | $26,633 |
| State: | $68,202 |
Change in median household income between 2000 and 2022:| Cathan, Washington: | +93.7% |
| State: | +89.9% |
Number of households with income < $10k:| Cathan: | 12.9% (402) |
| State: | 7.2% (8,014) |
Number of households with income $10k - 20k:| Cathan: | 4.5% (139) |
| State: | 8.0% (8,904) |
Number of households with income $20k - 30k:| Cathan: | 4.9% (152) |
| State: | 7.4% (8,207) |
Number of households with income $30k - 40k:| Cathan: | 5.8% (181) |
| Washington: | 5.6% (6,220) |
Number of households with income $40k - 50k:| Cathan: | 7.3% (226) |
| State: | 9.5% (10,585) |
Number of households with income $50k - 60k:| Cathan: | 2.4% (76) |
| State: | 7.3% (8,078) |
Number of households with income $60k - 75k:| Cathan: | 3.3% (103) |
| State: | 8.7% (9,704) |
Number of households with income $75k - 100k:| Cathan: | 13.5% (419) |
| State: | 12.9% (14,315) |
Number of households with income $100k - 125k:| Cathan: | 6.0% (186) |
| Washington: | 7.7% (8,592) |
Number of households with income $125k - 150k:| Cathan: | 18.0% (559) |
| State: | 8.9% (9,840) |
Number of households with income $150k - 200k:| Cathan: | 10.1% (313) |
| State: | 7.6% (8,434) |
Number of households with income > $200k:| Cathan: | 11.3% (352) |
| Washington: | 9.1% (10,075) |
Aggregate household income in Cathan in 2022: $78,257
Median non-family income in Cathan in 2022:| Cathan: | $23,076 |
| State: | $49,169 |
Change in median non-family income between 2000 and 2022:| Cathan, Washington: | +67.8% |
| Washington: | +87.7% |
Median per capita income in Cathan in 2022:| Cathan: | $34,412 |
| State: | $38,209 |
Income statistics for Asian residents
Median household income in Cathan, WA in 2022:| Cathan: | $125,562 |
| State: | $125,692 |
Change in median household income between 2000 and 2022:| Cathan, Washington: | +145.0% |
| Washington: | +164.5% |
Number of households with income < $10k:| Cathan: | 5.1% (1,783) |
| Washington: | 4.9% (14,099) |
Number of households with income $10k - 20k:| Cathan: | 1.7% (607) |
| State: | 3.5% (9,873) |
Number of households with income $20k - 30k:| Cathan: | 2.3% (802) |
| State: | 2.9% (8,352) |
Number of households with income $30k - 40k:| Cathan: | 3.6% (1,281) |
| State: | 4.0% (11,415) |
Number of households with income $40k - 50k:| Cathan: | 3.3% (1,179) |
| Washington: | 4.0% (11,421) |
Number of households with income $50k - 60k:| Cathan: | 2.1% (744) |
| State: | 4.2% (12,100) |
Number of households with income $60k - 75k:| Cathan: | 7.5% (2,655) |
| State: | 6.3% (17,903) |
Number of households with income $75k - 100k:| Cathan: | 12.7% (4,462) |
| State: | 10.4% (29,663) |
Number of households with income $100k - 125k:| Cathan: | 9.1% (3,194) |
| Washington: | 9.4% (26,839) |
Number of households with income $125k - 150k:| Cathan: | 8.3% (2,908) |
| State: | 8.5% (24,200) |
Number of households with income $150k - 200k:| Cathan: | 13.4% (4,735) |
| State: | 12.6% (35,976) |
Number of households with income > $200k:| Cathan: | 30.9% (10,881) |
| Washington: | 29.2% (83,109) |
Aggregate household income in Cathan in 2022: $1,664,370
Median family income in Cathan in 2022:| Cathan: | $119,740 |
| State: | $143,595 |
Median per capita income in Cathan in 2022:| Cathan: | $105,378 |
| State: | $67,666 |
Income statistics for Hispanic or Latino residents
Number of households with income < $10k:| Cathan: | 6.4% (473) |
| State: | 4.9% (14,456) |
Number of households with income $10k - 20k:| Cathan: | 2.3% (173) |
| State: | 5.3% (15,449) |
Number of households with income $20k - 30k:| Cathan: | 4.9% (363) |
| Washington: | 6.8% (20,016) |
Number of households with income $30k - 40k:| Cathan: | 4.6% (342) |
| State: | 7.7% (22,548) |
Number of households with income $40k - 50k:| Cathan: | 6.1% (454) |
| Washington: | 7.3% (21,450) |
Number of households with income $50k - 60k:| Cathan: | 7.0% (521) |
| State: | 7.7% (22,744) |
Number of households with income $60k - 75k:| Cathan: | 14.1% (1,049) |
| State: | 10.5% (30,737) |
Number of households with income $75k - 100k:| Cathan: | 17.7% (1,320) |
| Washington: | 14.9% (43,843) |
Number of households with income $100k - 125k:| Cathan: | 8.3% (616) |
| State: | 11.1% (32,554) |
Number of households with income $125k - 150k:| Cathan: | 9.5% (708) |
| Washington: | 7.4% (21,624) |
Number of households with income $150k - 200k:| Cathan: | 8.1% (603) |
| State: | 7.3% (21,360) |
Number of households with income > $200k:| Cathan: | 11.0% (822) |
| Washington: | 9.2% (27,055) |
Median per capita income in Cathan in 2022:| Cathan: | $9,175 |
| State: | $28,252 |
Change in median per capita income between 2000 and 2022:| Cathan, Washington: | +89.2% |
| Washington: | +150.2% |
Income statistics for American Indian and Alaska Native residents
Median household income in Cathan, WA in 2022:| Cathan: | $194,378 |
| State: | $71,255 |
Number of households with income < $10k:| Cathan: | 5.9% (1,461) |
| State: | 5.9% (1,768) |
Number of households with income $10k - 20k:| Cathan: | 9.0% (2,230) |
| State: | 8.9% (2,694) |
Number of households with income $20k - 30k:| Cathan: | 8.0% (1,973) |
| State: | 8.0% (2,412) |
Number of households with income $30k - 40k:| Cathan: | 7.7% (1,911) |
| Washington: | 7.7% (2,327) |
Number of households with income $40k - 50k:| Cathan: | 5.9% (1,461) |
| State: | 5.8% (1,755) |
Number of households with income $50k - 60k:| Cathan: | 7.5% (1,858) |
| Washington: | 7.5% (2,259) |
Number of households with income $60k - 75k:| Cathan: | 8.8% (2,191) |
| State: | 8.8% (2,669) |
Number of households with income $75k - 100k:| Cathan: | 12.7% (3,158) |
| Washington: | 12.8% (3,861) |
Number of households with income $100k - 125k:| Cathan: | 12.0% (2,981) |
| State: | 12.0% (3,618) |
Number of households with income $125k - 150k:| Cathan: | 8.6% (2,129) |
| State: | 8.6% (2,580) |
Number of households with income $150k - 200k:| Cathan: | 5.9% (1,456) |
| State: | 5.9% (1,774) |
Number of households with income > $200k:| Cathan: | 8.0% (1,993) |
| State: | 8.1% (2,447) |
Aggregate household income in Cathan in 2022: $392,819
Median family income in Cathan in 2022:| Cathan: | $122,563 |
| State: | $79,010 |
Median per capita income in Cathan in 2022:| Cathan: | $23,831 |
| State: | $27,053 |
Change in median per capita income between 2000 and 2022:| Cathan, Washington: | +85.4% |
| State: | +98.6% |
Income statistics for Multirace residents
Median household income in Cathan, WA in 2022:| Cathan: | $134,811 |
| Washington: | $84,303 |
Change in median household income between 2000 and 2022:| Cathan, Washington: | +103.5% |
| State: | +125.7% |
Number of households with income < $10k:| Cathan: | 2.9% (918) |
| State: | 4.3% (12,040) |
Number of households with income $10k - 20k:| Cathan: | 5.9% (1,889) |
| State: | 6.6% (18,437) |
Number of households with income $20k - 30k:| Cathan: | 2.4% (773) |
| State: | 5.2% (14,559) |
Number of households with income $30k - 40k:| Cathan: | 5.3% (1,698) |
| State: | 6.7% (18,491) |
Number of households with income $40k - 50k:| Cathan: | 4.2% (1,349) |
| Washington: | 6.3% (17,459) |
Number of households with income $50k - 60k:| Cathan: | 4.5% (1,457) |
| State: | 6.9% (19,086) |
Number of households with income $60k - 75k:| Cathan: | 12.2% (3,899) |
| State: | 9.1% (25,310) |
Number of households with income $75k - 100k:| Cathan: | 11.1% (3,540) |
| State: | 13.5% (37,493) |
Number of households with income $100k - 125k:| Cathan: | 13.4% (4,304) |
| Washington: | 10.7% (29,626) |
Number of households with income $125k - 150k:| Cathan: | 11.9% (3,811) |
| Washington: | 8.6% (23,899) |
Number of households with income $150k - 200k:| Cathan: | 13.1% (4,192) |
| State: | 10.2% (28,214) |
Number of households with income > $200k:| Cathan: | 13.1% (4,198) |
| State: | 11.9% (32,947) |
Aggregate household income in Cathan in 2022: $4,042,500
Median family income in Cathan in 2022:| Cathan: | $177,959 |
| Washington: | $95,629 |
Number of families with income $60k - 75k:| Cathan: | 53.5% (7) |
| Washington: | 9.7% (17,113) |
Number of families with income $75k - 100k:| Cathan: | 46.5% (6) |
| Washington: | 13.6% (23,984) |
Median non-family income in Cathan in 2022:| Cathan: | $105,535 |
| State: | $56,573 |
Change in median non-family income between 2000 and 2022:| Cathan, Washington: | +128.2% |
| Washington: | +115.0% |
Median per capita income in Cathan in 2022:| Cathan: | $45,627 |
| State: | $32,496 |
Change in median per capita income between 2000 and 2022:| Cathan, Washington: | +128.0% |
| State: | +156.8% |
Income statistics for other residents
Number of households with income < $10k:| Cathan: | 6.7% (853) |
| State: | 5.3% (6,540) |
Number of households with income $10k - 20k:| Cathan: | 2.5% (318) |
| State: | 6.0% (7,385) |
Number of households with income $20k - 30k:| Cathan: | 4.8% (606) |
| Washington: | 7.5% (9,289) |
Number of households with income $30k - 40k:| Cathan: | 4.7% (604) |
| State: | 8.9% (11,015) |
Number of households with income $40k - 50k:| Cathan: | 8.8% (1,126) |
| State: | 7.6% (9,399) |
Number of households with income $50k - 60k:| Cathan: | 9.0% (1,141) |
| Washington: | 7.2% (8,867) |
Number of households with income $60k - 75k:| Cathan: | 14.1% (1,800) |
| State: | 10.5% (13,032) |
Number of households with income $75k - 100k:| Cathan: | 16.1% (2,053) |
| Washington: | 14.6% (18,007) |
Number of households with income $100k - 125k:| Cathan: | 9.8% (1,253) |
| State: | 12.2% (15,128) |
Number of households with income $125k - 150k:| Cathan: | 8.6% (1,099) |
| Washington: | 5.6% (6,950) |
Number of households with income $150k - 200k:| Cathan: | 6.1% (776) |
| Washington: | 7.1% (8,749) |
Number of households with income > $200k:| Cathan: | 8.6% (1,097) |
| State: | 7.5% (9,208) |
Median per capita income in Cathan in 2022:| Cathan: | $32,495 |
| Washington: | $27,542 |
Change in median per capita income between 2000 and 2022:| Cathan, Washington: | +125.7% |
| State: | +167.8% |