The median household income in Centralia, IL in 2022 was $45,446, which was 68.8% less than the median annual income of $76,708 across the entire state of Illinois. Compared to the median income of $31,905 in 2000 this represents an increase of 29.8%. The per capita income in 2022 was $27,763, which means an increase of 38.1% compared to 2000 when it was $17,174.
Whole page based on the data from 2000 / 2022 when the population of Centralia, Illinois was 14,136 / 11,930
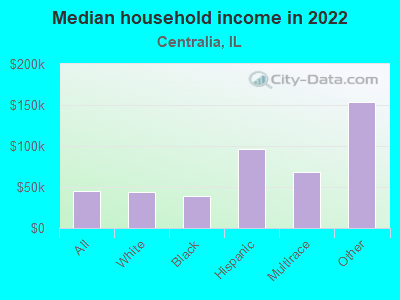
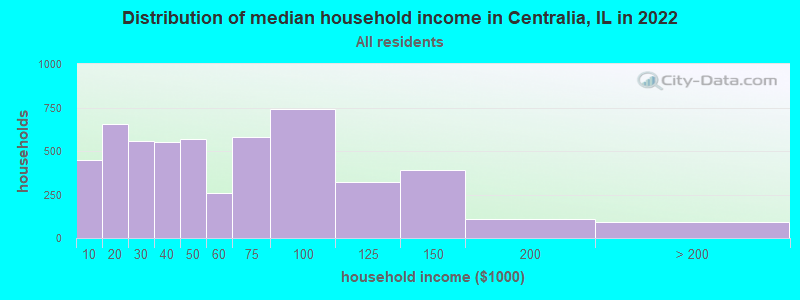
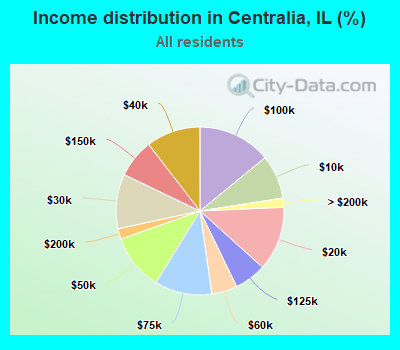
Income statistics for all residents
Median household income in Centralia, IL in 2022:
Centralia:
$45,446
State:
$76,708
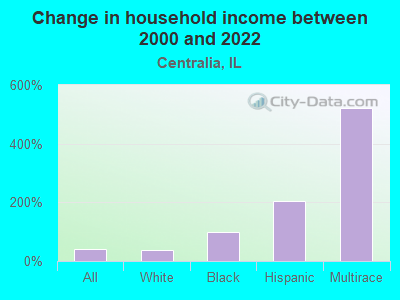
Change in median household income between 2000 and 2022:
Centralia, Illinois:
+42.4%
Illinois:
+64.6%
Number of households with income < $10k:
Centralia:
8.5% (448)
State:
5.9% (296,090)
Number of households with income $10k - 20k:
Centralia:
12.4% (653)
Illinois:
6.6% (333,259)
Number of households with income $20k - 30k:
Centralia:
10.5% (555)
Illinois:
6.8% (342,921)
Number of households with income $30k - 40k:
Centralia:
10.4% (551)
Illinois:
7.0% (355,254)
Number of households with income $40k - 50k:
Centralia:
10.8% (570)
State:
6.7% (340,678)
Number of households with income $50k - 60k:
Centralia:
4.9% (260)
Illinois:
6.7% (339,405)
Number of households with income $60k - 75k:
Centralia:
11.0% (582)
Illinois:
9.2% (465,709)
Number of households with income $75k - 100k:
Centralia:
14.1% (742)
State:
12.9% (651,353)
Number of households with income $100k - 125k:
Centralia:
6.1% (324)
Illinois:
10.3% (522,359)
Number of households with income $125k - 150k:
Centralia:
7.4% (392)
State:
7.3% (367,136)
Number of households with income $150k - 200k:
Centralia:
2.0% (107)
State:
9.0% (455,249)
Number of households with income > $200k:
Centralia:
1.8% (93)
State:
11.6% (586,947)
Aggregate household income in Centralia in 2022: $328,387,768
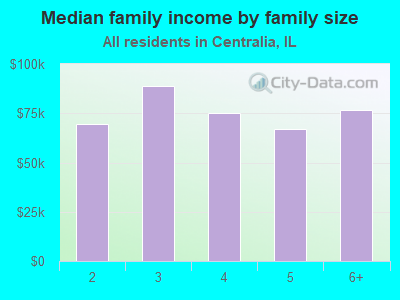
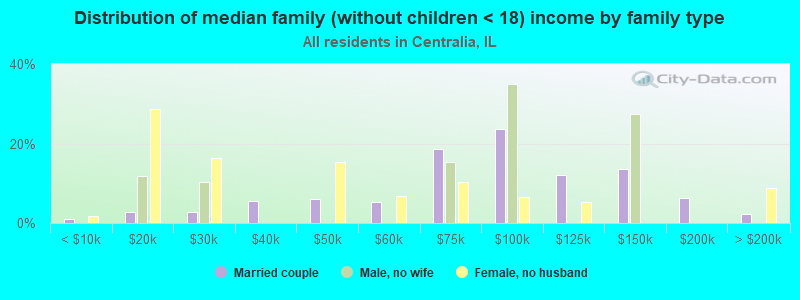
Median family income in Centralia in 2022:
Centralia:
$74,986
State:
$96,948
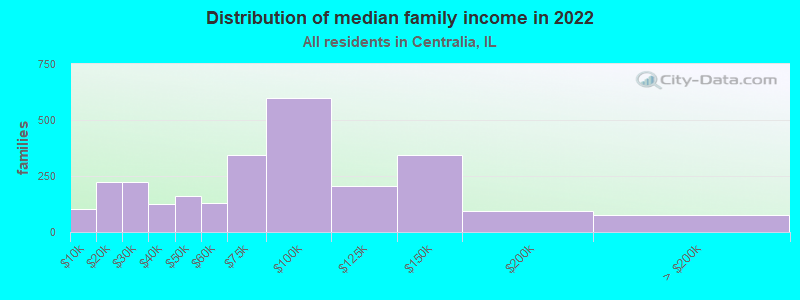
Number of families with income < $10k:
Centralia:
3.9% (103)
Illinois:
3.4% (105,875)
Number of families with income $10k - 20k:
Centralia:
8.6% (225)
Illinois:
3.3% (105,017)
Number of families with income $20k - 30k:
Centralia:
8.5% (222)
State:
4.7% (146,403)
Number of families with income $30k - 40k:
Centralia:
4.8% (125)
State:
5.3% (167,069)
Number of families with income $40k - 50k:
Centralia:
6.1% (159)
Illinois:
5.8% (181,164)
Number of families with income $50k - 60k:
Centralia:
4.9% (128)
Illinois:
6.1% (191,561)
Number of families with income $60k - 75k:
Centralia:
13.1% (343)
State:
9.0% (282,985)
Number of families with income $75k - 100k:
Centralia:
22.8% (597)
State:
13.8% (432,725)
Number of families with income $100k - 125k:
Centralia:
7.9% (207)
State:
11.9% (373,296)
Number of families with income $125k - 150k:
Centralia:
13.1% (344)
State:
8.9% (279,791)
Number of families with income $150k - 200k:
Centralia:
3.5% (92)
Illinois:
11.9% (372,004)
Number of families with income > $200k:
Centralia:
2.8% (74)
State:
15.9% (500,033)
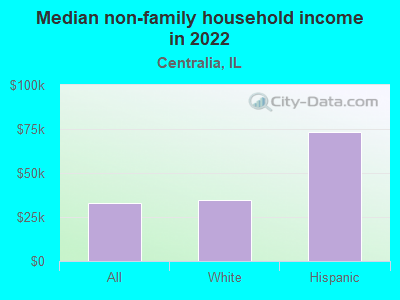
Median non-family income in Centralia in 2022:
Centralia:
$33,080
State:
$46,533
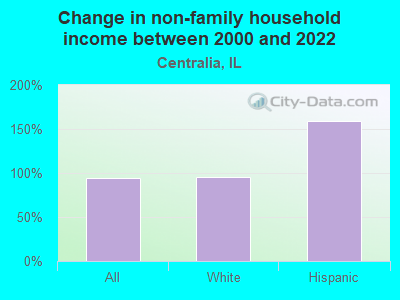
Change in median non-family income between 2000 and 2022:
Centralia, Illinois:
+93.8%
Illinois:
+64.0%
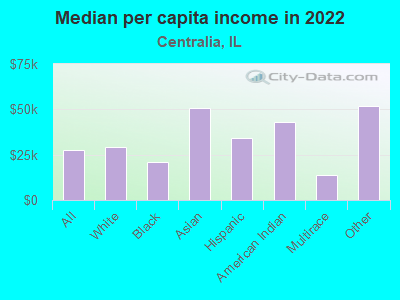
Median per capita income in Centralia in 2022:
Centralia:
$27,763
State:
$43,317
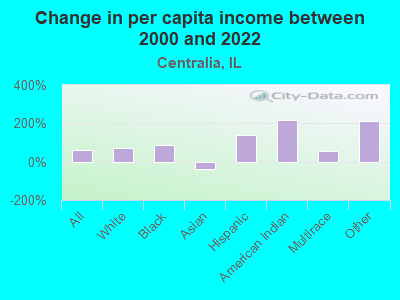
Change in median per capita income between 2000 and 2022:
Centralia, Illinois:
+61.7%
State:
+87.5%
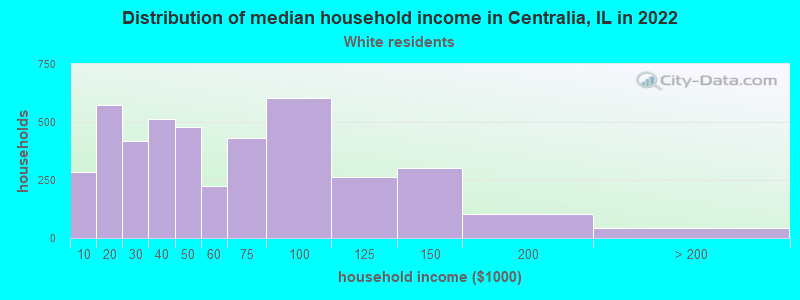
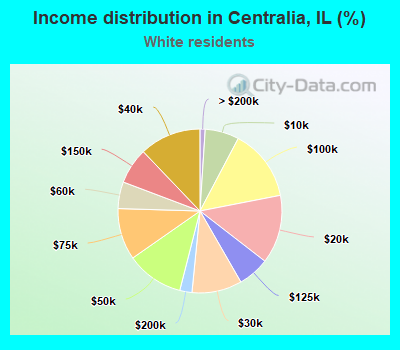
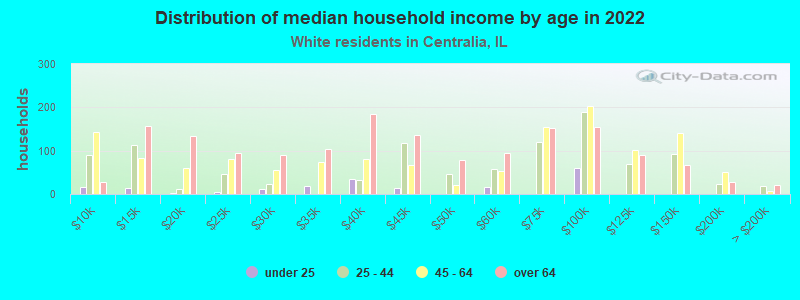
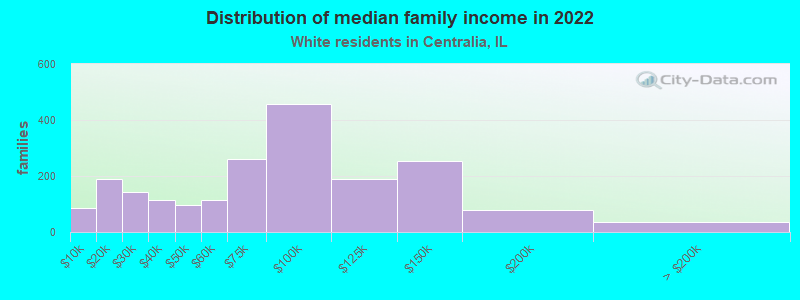
Income statistics for White residents
Median household income in Centralia, IL in 2022:
Centralia:
$44,506
State:
$83,346
Change in median household income between 2000 and 2022:
Centralia, Illinois:
+35.7%
State:
+67.5%
Number of households with income < $10k:
Centralia:
6.7% (284)
Illinois:
4.5% (149,895)
Number of households with income $10k - 20k:
Centralia:
13.5% (574)
State:
5.5% (184,529)
Number of households with income $20k - 30k:
Centralia:
9.9% (419)
State:
6.1% (205,767)
Number of households with income $30k - 40k:
Centralia:
12.1% (514)
Illinois:
6.7% (225,572)
Number of households with income $40k - 50k:
Centralia:
11.3% (479)
State:
6.5% (216,965)
Number of households with income $50k - 60k:
Centralia:
5.3% (223)
Illinois:
6.6% (222,841)
Number of households with income $60k - 75k:
Centralia:
10.2% (432)
State:
9.3% (312,758)
Number of households with income $75k - 100k:
Centralia:
14.2% (602)
State:
12.9% (433,180)
Number of households with income $100k - 125k:
Centralia:
6.2% (263)
Illinois:
10.7% (360,753)
Number of households with income $125k - 150k:
Centralia:
7.1% (302)
Illinois:
7.9% (266,532)
Number of households with income $150k - 200k:
Centralia:
2.4% (102)
State:
10.0% (337,357)
Number of households with income > $200k:
Centralia:
1.0% (44)
State:
13.3% (446,069)
Aggregate household income in Centralia in 2022: $260,063,680
Median family income in Centralia in 2022:
Centralia:
$75,706
State:
$107,938
Number of families with income < $10k:
Centralia:
4.2% (85)
Illinois:
2.2% (45,983)
Number of families with income $10k - 20k:
Centralia:
9.4% (190)
State:
2.5% (50,574)
Number of families with income $20k - 30k:
Centralia:
7.1% (143)
State:
3.5% (70,927)
Number of families with income $30k - 40k:
Centralia:
5.7% (115)
State:
4.4% (90,563)
Number of families with income $40k - 50k:
Centralia:
4.8% (96)
Illinois:
5.0% (102,597)
Number of families with income $50k - 60k:
Centralia:
5.7% (115)
State:
5.8% (119,129)
Number of families with income $60k - 75k:
Centralia:
12.9% (260)
State:
8.8% (179,665)
Number of families with income $75k - 100k:
Centralia:
22.7% (457)
Illinois:
13.5% (276,887)
Number of families with income $100k - 125k:
Centralia:
9.3% (188)
State:
12.5% (256,099)
Number of families with income $125k - 150k:
Centralia:
12.6% (254)
State:
9.8% (199,855)
Number of families with income $150k - 200k:
Centralia:
3.9% (78)
State:
13.4% (274,569)
Number of families with income > $200k:
Centralia:
1.7% (35)
State:
18.6% (381,354)
Median non-family income in Centralia in 2022:
Centralia:
$34,789
Illinois:
$50,934
Change in median non-family income between 2000 and 2022:
Centralia, Illinois:
+94.7%
State:
+70.7%
Median per capita income in Centralia in 2022:
Centralia:
$29,361
Illinois:
$50,738
Change in median per capita income between 2000 and 2022:
Centralia, Illinois:
+69.7%
State:
+95.5%
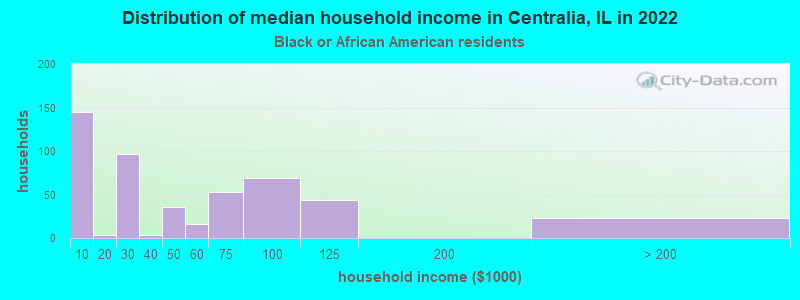
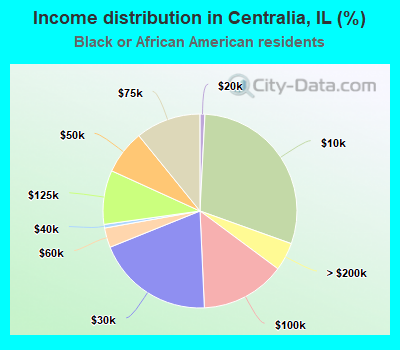
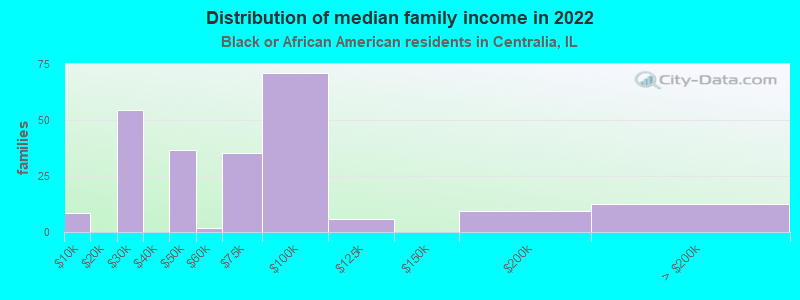
Income statistics for Black or African American residents
Median household income in Centralia, IL in 2022:
Centralia:
$38,667
State:
$45,019
Change in median household income between 2000 and 2022:
Centralia, Illinois:
+99.6%
Illinois:
+42.0%
Number of households with income < $10k:
Centralia:
29.7% (145)
State:
13.3% (92,224)
Number of households with income $10k - 20k:
Centralia:
0.8% (4)
Illinois:
13.5% (93,732)
Number of households with income $20k - 30k:
Centralia:
19.6% (96)
State:
9.9% (68,453)
Number of households with income $30k - 40k:
Centralia:
0.6% (3)
Illinois:
8.5% (59,072)
Number of households with income $40k - 50k:
Centralia:
7.4% (36)
State:
7.9% (55,033)
Number of households with income $50k - 60k:
Centralia:
3.3% (16)
Illinois:
7.2% (49,556)
Number of households with income $60k - 75k:
Centralia:
10.8% (53)
State:
7.8% (53,726)
Number of households with income $75k - 100k:
Centralia:
14.1% (69)
State:
11.6% (80,439)
Number of households with income $100k - 125k:
Centralia:
9.0% (44)
State:
7.5% (52,244)
Number of households with income $125k - 150k:
Centralia:
0.0% (0)
State:
3.9% (27,058)
Number of households with income $150k - 200k:
Centralia:
0.0% (0)
Illinois:
4.6% (32,057)
Number of households with income > $200k:
Centralia:
4.7% (23)
State:
4.1% (28,731)
Aggregate household income in Centralia in 2022: $23,883,212
Median family income in Centralia in 2022:
Centralia:
$64,060
Illinois:
$60,661
Number of families with income < $10k:
Centralia:
3.7% (9)
State:
9.5% (35,136)
Number of families with income $20k - 30k:
Centralia:
23.1% (55)
Illinois:
8.8% (32,666)
Number of families with income $40k - 50k:
Centralia:
15.5% (37)
State:
8.5% (31,429)
Number of families with income $50k - 60k:
Centralia:
0.8% (2)
State:
7.1% (26,341)
Number of families with income $60k - 75k:
Centralia:
15.0% (35)
State:
8.3% (30,626)
Number of families with income $75k - 100k:
Centralia:
30.1% (71)
State:
14.0% (51,750)
Number of families with income $100k - 125k:
Centralia:
2.5% (6)
State:
9.3% (34,471)
Number of families with income $150k - 200k:
Centralia:
3.9% (9)
State:
6.8% (25,177)
Number of families with income > $200k:
Centralia:
5.3% (13)
State:
6.3% (23,371)
Median per capita income in Centralia in 2022:
Centralia:
$20,742
Illinois:
$28,045
Change in median per capita income between 2000 and 2022:
Centralia, Illinois:
+88.3%
State:
+90.2%
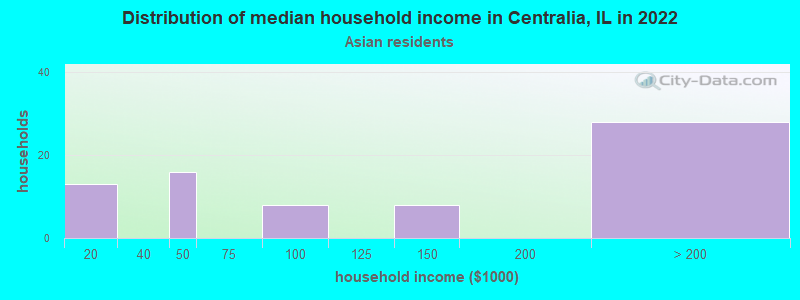
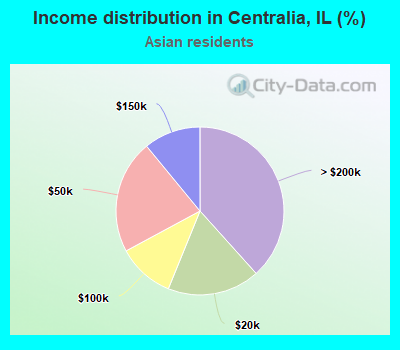
Income statistics for Asian residents
Number of households with income < $10k:
Centralia:
0.0% (0)
State:
5.3% (14,653)
Number of households with income $10k - 20k:
Centralia:
17.8% (13)
State:
4.5% (12,283)
Number of households with income $20k - 30k:
Centralia:
0.0% (0)
State:
4.8% (13,135)
Number of households with income $30k - 40k:
Centralia:
0.0% (0)
State:
5.0% (13,655)
Number of households with income $40k - 50k:
Centralia:
21.9% (16)
Illinois:
4.5% (12,357)
Number of households with income $50k - 60k:
Centralia:
0.0% (0)
State:
4.9% (13,568)
Number of households with income $60k - 75k:
Centralia:
0.0% (0)
State:
7.1% (19,606)
Number of households with income $75k - 100k:
Centralia:
11.0% (8)
State:
12.1% (33,349)
Number of households with income $100k - 125k:
Centralia:
0.0% (0)
Illinois:
9.7% (26,669)
Number of households with income $125k - 150k:
Centralia:
11.0% (8)
Illinois:
7.3% (20,172)
Number of households with income $150k - 200k:
Centralia:
0.0% (0)
State:
11.5% (31,711)
Number of households with income > $200k:
Centralia:
38.4% (28)
State:
23.1% (63,411)
Aggregate household income in Centralia in 2022: $14,335,842
Median per capita income in Centralia in 2022:
Centralia:
$50,768
Illinois:
$52,977
Change in median per capita income between 2000 and 2022:: -38.0%
Centralia, Illinois:
-38.0%
Illinois:
+119.5%
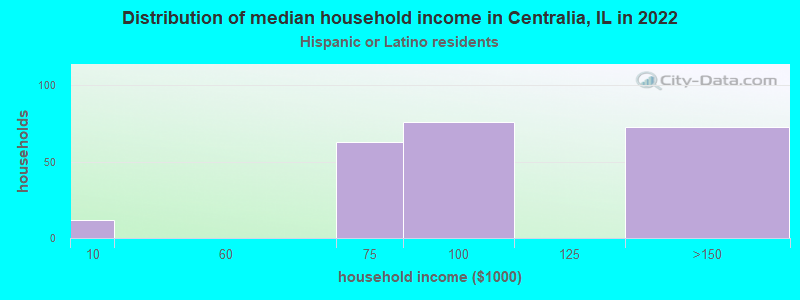
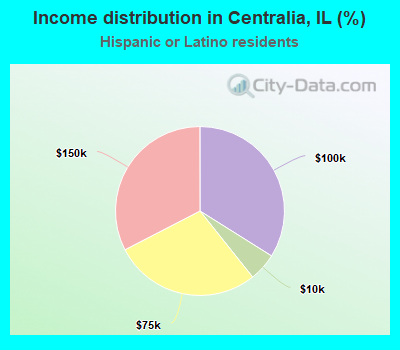
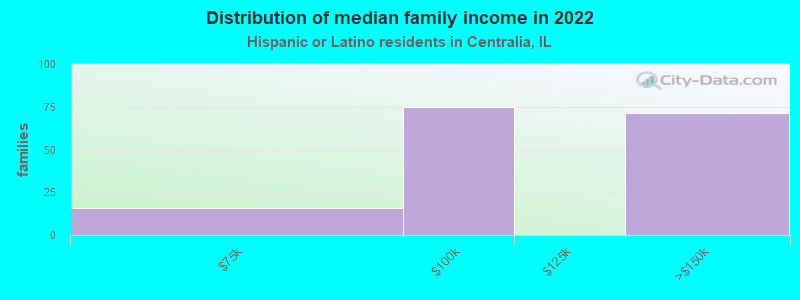
Income statistics for Hispanic or Latino residents
Median household income in Centralia, IL in 2022:
Centralia:
$95,834
Illinois:
$72,139
Number of households with income < $10k:
Centralia:
5.4% (12)
State:
4.9% (33,145)
Number of households with income $10k - 20k:
Centralia:
0.0% (0)
Illinois:
5.4% (36,345)
Number of households with income $20k - 30k:
Centralia:
0.0% (0)
State:
7.5% (50,677)
Number of households with income $30k - 40k:
Centralia:
0.0% (0)
State:
7.7% (52,008)
Number of households with income $40k - 50k:
Centralia:
0.0% (0)
State:
8.1% (54,702)
Number of households with income $50k - 60k:
Centralia:
0.0% (0)
State:
7.5% (51,062)
Number of households with income $60k - 75k:
Centralia:
28.1% (63)
Illinois:
11.3% (76,576)
Number of households with income $75k - 100k:
Centralia:
33.9% (76)
State:
15.5% (105,152)
Number of households with income $100k - 125k:
Centralia:
0.0% (0)
State:
11.5% (77,760)
Number of households with income $125k - 150k:
Centralia:
32.6% (73)
Illinois:
7.3% (49,310)
Number of households with income $150k - 200k:
Centralia:
0.0% (0)
State:
7.6% (51,233)
Number of households with income > $200k:
Centralia:
0.0% (0)
Illinois:
5.9% (40,028)
Aggregate household income in Centralia in 2022: $21,330,475
Median family income in Centralia in 2022:
Centralia:
$95,924
State:
$76,467
Number of families with income $60k - 75k:
Centralia:
9.8% (16)
Illinois:
11.5% (58,164)
Number of families with income $75k - 100k:
Centralia:
46.2% (75)
Illinois:
16.0% (81,055)
Number of families with income $125k - 150k:
Centralia:
44.0% (72)
State:
8.0% (40,271)
Median non-family income in Centralia in 2022:
Centralia:
$73,172
Illinois:
$45,965
Median per capita income in Centralia in 2022:
Centralia:
$34,306
State:
$26,551
Change in median per capita income between 2000 and 2022:
Centralia, Illinois:
+138.9%
State:
+111.0%
Income statistics for American Indian and Alaska Native residents
Aggregate household income in Centralia in 2022: $1,114,635
Median per capita income in Centralia in 2022:
Centralia:
$42,804
State:
$26,979
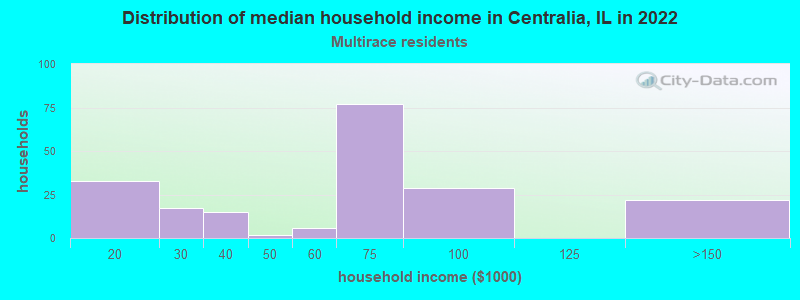
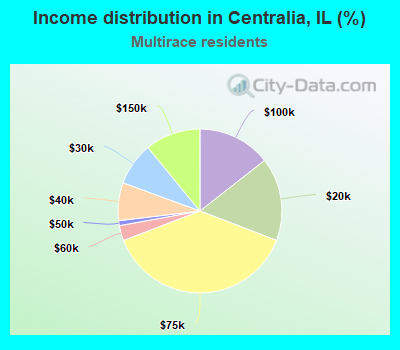
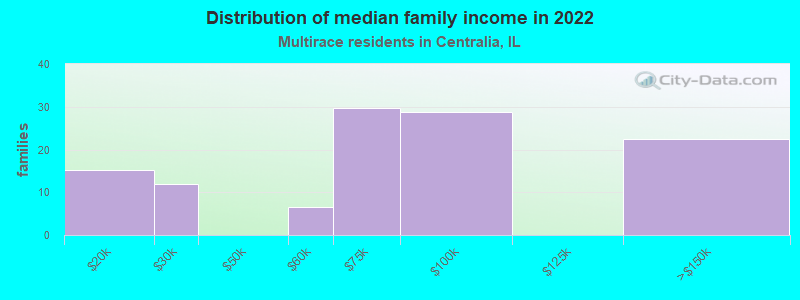
Income statistics for Multirace residents
Median household income in Centralia, IL in 2022:
Centralia:
$68,016
Illinois:
$71,185
Number of households with income < $10k:
Centralia:
0.0% (0)
State:
5.3% (21,595)
Number of households with income $10k - 20k:
Centralia:
16.4% (33)
State:
6.5% (26,720)
Number of households with income $20k - 30k:
Centralia:
8.5% (17)
Illinois:
8.0% (32,573)
Number of households with income $30k - 40k:
Centralia:
7.5% (15)
State:
8.4% (34,383)
Number of households with income $40k - 50k:
Centralia:
1.0% (2)
Illinois:
7.4% (30,234)
Number of households with income $50k - 60k:
Centralia:
3.0% (6)
State:
6.9% (28,432)
Number of households with income $60k - 75k:
Centralia:
38.3% (77)
State:
10.2% (41,780)
Number of households with income $75k - 100k:
Centralia:
14.4% (29)
State:
13.0% (53,426)
Number of households with income $100k - 125k:
Centralia:
0.0% (0)
State:
10.5% (43,126)
Number of households with income $125k - 150k:
Centralia:
10.9% (22)
State:
7.6% (31,153)
Number of households with income $150k - 200k:
Centralia:
0.0% (0)
Illinois:
7.6% (30,946)
Number of households with income > $200k:
Centralia:
0.0% (0)
Illinois:
8.6% (35,208)
Aggregate household income in Centralia in 2022: $12,265,184
Median family income in Centralia in 2022:
Centralia:
$70,184
State:
$84,400
Number of families with income $10k - 20k:
Centralia:
13.2% (15)
Illinois:
4.2% (11,692)
Number of families with income $20k - 30k:
Centralia:
10.4% (12)
Illinois:
6.3% (17,559)
Number of families with income $50k - 60k:
Centralia:
5.7% (7)
State:
6.9% (19,177)
Number of families with income $60k - 75k:
Centralia:
25.9% (30)
State:
9.3% (25,936)
Number of families with income $75k - 100k:
Centralia:
25.1% (29)
State:
13.6% (37,857)
Number of families with income $125k - 150k:
Centralia:
19.6% (22)
State:
9.0% (25,085)
Median per capita income in Centralia in 2022:
Centralia:
$13,712
Illinois:
$29,285
Change in median per capita income between 2000 and 2022:
Centralia, Illinois:
+57.7%
Illinois:
+112.9%
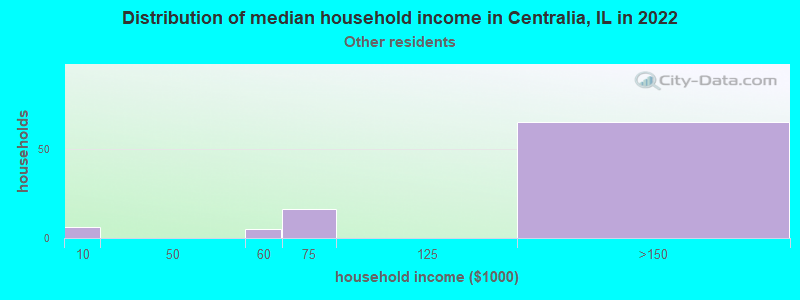
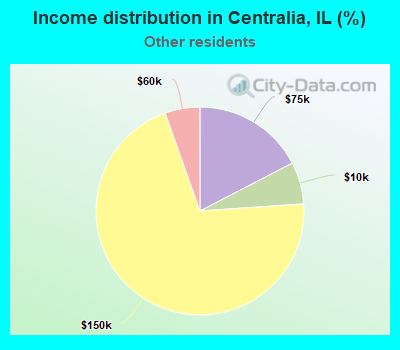
Income statistics for other residents
Median household income in Centralia, IL in 2022:
Centralia:
$154,250
State:
$71,711
Number of households with income < $10k:
Centralia:
6.5% (6)
State:
5.7% (16,383)
Number of households with income $10k - 20k:
Centralia:
0.0% (0)
Illinois:
4.8% (13,886)
Number of households with income $20k - 30k:
Centralia:
0.0% (0)
Illinois:
7.0% (20,054)
Number of households with income $30k - 40k:
Centralia:
0.0% (0)
State:
7.0% (20,038)
Number of households with income $40k - 50k:
Centralia:
0.0% (0)
State:
8.3% (23,759)
Number of households with income $50k - 60k:
Centralia:
5.4% (5)
State:
7.8% (22,410)
Number of households with income $60k - 75k:
Centralia:
17.4% (16)
Illinois:
12.0% (34,448)
Number of households with income $75k - 100k:
Centralia:
0.0% (0)
State:
16.2% (46,508)
Number of households with income $100k - 125k:
Centralia:
0.0% (0)
State:
12.5% (35,952)
Number of households with income $125k - 150k:
Centralia:
70.7% (65)
State:
6.9% (19,732)
Number of households with income $150k - 200k:
Centralia:
0.0% (0)
Illinois:
7.5% (21,422)
Number of households with income > $200k:
Centralia:
0.0% (0)
Illinois:
4.3% (12,194)
Aggregate household income in Centralia in 2022: $10,723,047
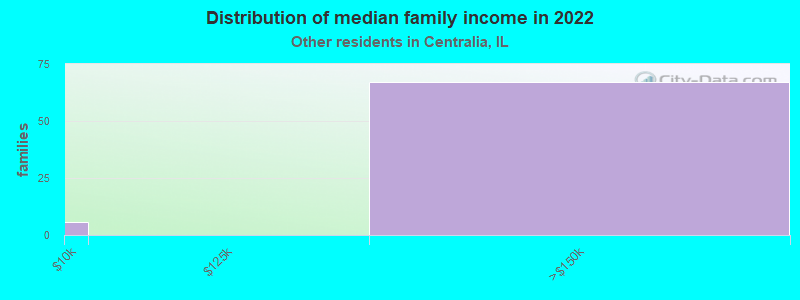
Median family income in Centralia in 2022:
Centralia:
$153,761
State:
$74,069
Number of families with income < $10k:
Centralia:
8.0% (6)
Illinois:
4.1% (9,256)
Number of families with income $125k - 150k:
Centralia:
92.0% (67)
State:
7.3% (16,287)
Median per capita income in Centralia in 2022:
Centralia:
$51,821
Illinois:
$25,392
Discuss Centralia, Illinois (IL) on our hugely popular Illinois forum.